Mga Batayang Estadistika
| Pemilik Institusional | 279 total, 279 long only, 0 short only, 0 long/short - change of 2.94% MRQ |
| Alokasi Portofolio Rata-rata | 0.6522 % - change of -0.03% MRQ |
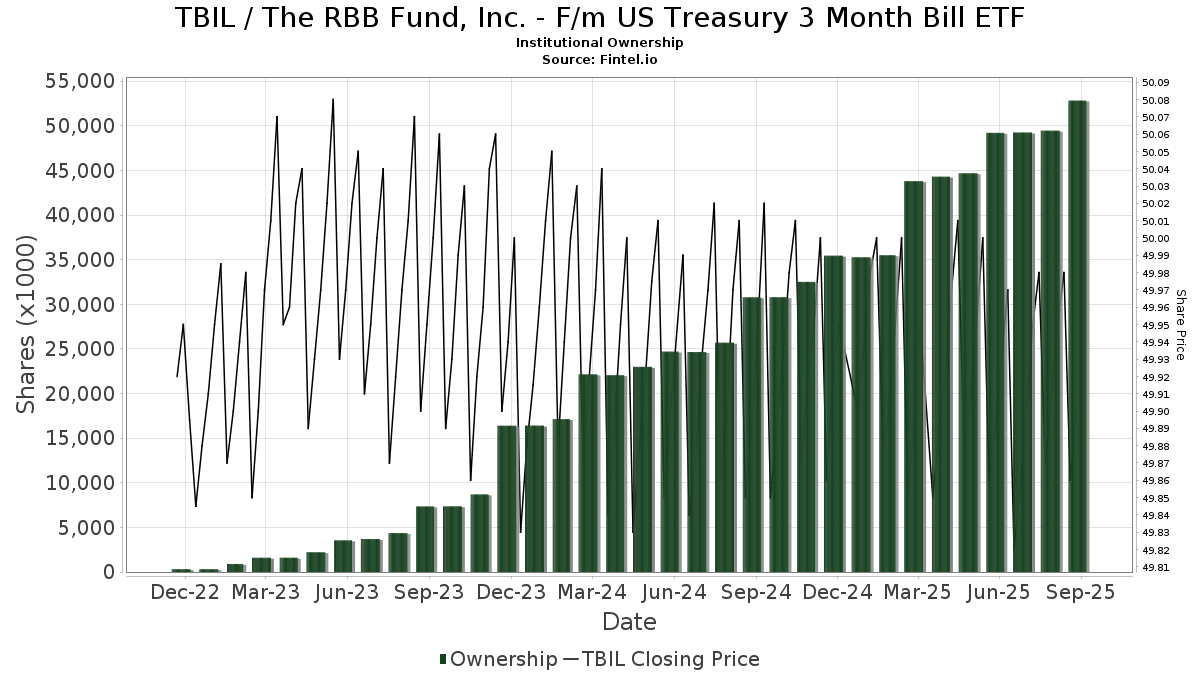
| Saham Institusional (Jangka Panjang) | 52,811,176 (ex 13D/G) - change of 3.59MM shares 7.30% MRQ |
| Nilai Institusional (Jangka Panjang) | $ 2,506,628 USD ($1000) |
Kepemilikan Institusional dan Pemegang Saham
The RBB Fund, Inc. - F/m US Treasury 3 Month Bill ETF (US:TBIL) memiliki 279 pemilik institusional dan pemegang saham yang telah mengajukan formulir 13D/G atau 13F kepada Komisi Bursa Efek (Securities Exchange Commission/SEC). Lembaga-lembaga ini memegang total 52,811,176 saham. Pemegang saham terbesar meliputi LPL Financial LLC, Morgan Stanley, Oxbow Advisors, LLC, Raymond James Financial Inc, Stifel Financial Corp, Wealth Enhancement Advisory Services, Llc, Wells Fargo & Company/mn, Total Investment Management Inc, Moloney Securities Asset Management, LLC, and F/M Investments LLC .
Struktur kepemilikan institusional The RBB Fund, Inc. - F/m US Treasury 3 Month Bill ETF (NasdaqGM:TBIL) menunjukkan posisi terkini di perusahaan oleh institusi dan dana, serta perubahan terbaru dalam ukuran posisi. Pemegang saham utama dapat mencakup investor individu, reksa dana, dana lindung nilai, atau institusi. Jadwal 13D menunjukkan bahwa investor memegang (atau pernah memegang) lebih dari 5% saham perusahaan dan bermaksud (atau pernah bermaksud) untuk secara aktif mengejar perubahan strategi bisnis. Jadwal 13G menunjukkan investasi pasif lebih dari 5%.
The share price as of September 5, 2025 is 49.89 / share. Previously, on September 9, 2024, the share price was 49.88 / share. This represents an increase of 0.02% over that period.
Skor Sentimen Dana
Skor Sentimen Dana (sebelumnya dikenal sebagai Skor Akumulasi Kepemilikan) menemukan saham-saham yang paling banyak dibeli oleh dana. Ini adalah hasil dari model kuantitatif multi-faktor yang canggih yang mengidentifikasi perusahaan dengan tingkat akumulasi institusional tertinggi. Model penilaian menggunakan kombinasi dari total peningkatan pemilik yang diungkapkan, perubahan dalam alokasi portofolio pada pemilik tersebut, dan metrik lainnya. Angka berkisar dari 0 hingga 100, dengan angka yang lebih tinggi menunjukkan tingkat akumulasi yang lebih tinggi dibandingkan dengan perusahaan sejenisnya, dan 50 adalah rata-ratanya.
Frekuensi Pembaruan: Setiap Hari
Lihat Ownership Explorer, yang menyediakan daftar perusahaan dengan peringkat tertinggi.
Rasio Put/Call Institusional
Selain melaporkan isu ekuitas dan utang standar, institusi dengan aset di bawah manajemen lebih dari 100 juta dolar AS juga harus mengungkapkan kepemilikan opsi put dan call mereka. Karena opsi put umumnya menunjukkan sentimen negatif, dan opsi call menunjukkan sentimen positif, kita dapat mengetahui sentimen institusional secara keseluruhan dengan memplot rasio put terhadap call. Grafik di sebelah kanan memplot rasio put/call historis untuk instrumen ini.
Menggunakan Rasio Put/Call sebagai indikator sentimen investor mengatasi salah satu kekurangan utama dari penggunaan total kepemilikan institusional, yaitu sejumlah besar aset yang dikelola diinvestasikan secara pasif untuk melacak indeks. Dana yang dikelola secara pasif biasanya tidak membeli opsi, sehingga indikator rasio put/call lebih akurat dalam melacak sentimen dana yang dikelola secara aktif.
Pengajuan 13F dan NPORT
Detail pada pengajuan 13F tersedia gratis. Detail pada pengajuan NP memerlukan keanggotaan premium. Baris berwarna hijau menunjukkan posisi baru. Baris berwarna merah menunjukkan posisi yang sudah ditutup. Klik tautan ini ikon untuk melihat riwayat transaksi selengkapnya.
Tingkatkan
untuk membuka data premium dan mengekspor ke Excel ![]() .
.
| Tanggal File | Sumber | Investor | Ketik | Presyo ng Avg (Silangan) |
Saham | Δ Saham (%) |
Dilaporkan Nilai ($1000) |
Nilai Δ (%) |
Alokasi Port (%) |
|
|---|---|---|---|---|---|---|---|---|---|---|
| 2025-08-29 | NP | RAA - SMI 3Fourteen Real Asset Allocation ETF SMI 3Fourteen REAL Asset Allocation ETF | 192,814 | 148.39 | 9,640 | 148.30 | ||||
| 2025-07-31 | 13F | Moloney Securities Asset Management, LLC | 1,022,473 | 4.30 | 51,119 | 4.26 | ||||
| 2025-08-12 | 13F | Tableaux Llc | 0 | -100.00 | 0 | |||||
| 2025-08-14 | 13F | Wiley Bros.-aintree Capital, Llc | 0 | -100.00 | 0 | |||||
| 2025-08-07 | 13F | Cypress Capital, LLC | 86,275 | -20.54 | 4,313 | -20.56 | ||||
| 2025-07-29 | NP | OHSHX - Oakhurst Short Duration High Yield Credit Fund Institutional Shares | 44,015 | 2,201 | ||||||
| 2025-08-12 | 13F | J.w. Cole Advisors, Inc. | 46,798 | 136.86 | 2,340 | 136.74 | ||||
| 2025-07-29 | 13F | Manchester Financial Inc | 128,424 | -3.17 | 6,421 | -3.20 | ||||
| 2025-08-13 | 13F | Scotia Capital Inc. | 202,151 | 10,107 | ||||||
| 2025-08-12 | 13F | Wayfinding Financial, LLC | 0 | -100.00 | 0 | |||||
| 2025-08-06 | 13F | Centerpoint Advisory Group | 6,815 | 0.00 | 341 | 0.00 | ||||
| 2025-07-08 | 13F | Parallel Advisors, LLC | 74,773 | 25.86 | 3,738 | 25.82 | ||||
| 2025-07-29 | 13F | Stephens Inc /ar/ | 5,540 | 277 | ||||||
| 2025-08-06 | 13F | Legacy Investment Solutions, LLC | 2,846 | 219.78 | 142 | 222.73 | ||||
| 2025-07-25 | 13F | Astoria Portfolio Advisors LLC. | 5,962 | 298 | ||||||
| 2025-08-12 | 13F | LPL Financial LLC | 9,994,024 | 0.71 | 499,651 | 0.68 | ||||
| 2025-07-16 | 13F | Perigon Wealth Management, LLC | 7,403 | -25.13 | 370 | -25.10 | ||||
| 2025-07-28 | 13F | Acorn Financial Advisory Services Inc /adv | 18,564 | -37.28 | 928 | -37.30 | ||||
| 2025-07-31 | 13F | Strait & Sound Wealth Management LLC | 232,396 | -4.05 | 11,619 | -4.09 | ||||
| 2025-08-11 | 13F | Advisor Resource Council | 0 | -100.00 | 0 | |||||
| 2025-08-11 | 13F | Synergy Investment Management, LLC | 0 | -100.00 | 0 | |||||
| 2025-08-13 | 13F | Baird Financial Group, Inc. | 88,014 | 4,400 | ||||||
| 2025-08-14 | 13F | Old Mission Capital Llc | 11,299 | 565 | ||||||
| 2025-08-13 | 13F | Northwestern Mutual Wealth Management Co | 124,228 | 2.02 | 6,211 | 1.99 | ||||
| 2025-07-17 | 13F | Alpine Bank Wealth Management | 189,728 | 188.93 | 9,485 | 188.91 | ||||
| 2025-08-11 | 13F | Aptus Capital Advisors, LLC | 8,900 | -2.20 | 445 | -2.42 | ||||
| 2025-07-11 | 13F | Harbour Capital Advisors, LLC | 11,195 | 37.36 | 558 | 37.19 | ||||
| 2025-08-05 | 13F | Tsfg, Llc | 438 | 0.00 | 0 | |||||
| 2025-08-14 | 13F | Jane Street Group, Llc | 38,193 | 171.95 | 1,909 | 171.94 | ||||
| 2025-07-22 | 13F | Belpointe Asset Management LLC | 8,887 | -34.61 | 444 | -34.61 | ||||
| 2025-08-12 | 13F | Financial Advocates Investment Management | 33,032 | 25.38 | 1,651 | 25.36 | ||||
| 2025-08-18 | 13F | Geneos Wealth Management Inc. | 1,102 | 0.00 | 55 | 0.00 | ||||
| 2025-08-05 | 13F | Obermeyer Wood Investment Counsel, Lllp | 968,882 | 4.21 | 48,439 | 4.18 | ||||
| 2025-05-15 | 13F | Bank Of America Corp /de/ | 0 | -100.00 | 0 | |||||
| 2025-07-24 | 13F | Strong Tower Advisory Services | 206,975 | 564.70 | 10,348 | 566.69 | ||||
| 2025-05-09 | 13F | Empower Advisory Group, LLC | 0 | -100.00 | 0 | -100.00 | ||||
| 2025-07-25 | 13F | Concurrent Investment Advisors, LLC | 70,214 | 11.93 | 3,510 | 11.89 | ||||
| 2025-07-11 | 13F | Farther Finance Advisors, LLC | 69,086 | 16.42 | 3,454 | 16.77 | ||||
| 2025-07-25 | 13F | Sequoia Financial Advisors, LLC | 0 | -100.00 | 0 | -100.00 | ||||
| 2025-08-13 | 13F/A | StoneX Group Inc. | 6,644 | 331 | ||||||
| 2025-08-06 | 13F | Wedbush Securities Inc | 6,915 | 0 | ||||||
| 2025-07-14 | 13F | Gries Financial Llc | 274,207 | -6.24 | 13,709 | -6.27 | ||||
| 2025-08-11 | 13F | CFS Investment Advisory Services, LLC | 5,000 | 0 | ||||||
| 2025-07-21 | 13F | Mirae Asset Global Investments Co., Ltd. | 94,300 | 4,715 | ||||||
| 2025-08-11 | 13F | Private Advisor Group, LLC | 692,063 | 7.29 | 34,600 | 7.26 | ||||
| 2025-08-14 | 13F | Mpwm Advisory Solutions, Llc | 7,166 | -32.98 | 358 | -32.96 | ||||
| 2025-08-08 | 13F | Capital Investment Counsel, Inc | 35,825 | 10.23 | 1,791 | 10.22 | ||||
| 2025-08-12 | 13F | Gitterman Wealth Management, LLC | 16,376 | -5.25 | 819 | -5.32 | ||||
| 2025-07-17 | 13F | KG&L Capital Management,LLC | 54,228 | 26.14 | 2,711 | 26.15 | ||||
| 2025-04-28 | 13F | Summit Trail Advisors, Llc | 0 | -100.00 | 0 | -100.00 | ||||
| 2025-08-14 | 13F | Guardian Wealth Advisors, Llc / Nc | 17,013 | -50.84 | 851 | -50.87 | ||||
| 2025-07-14 | 13F | Occidental Asset Management, LLC | 5,000 | 0.00 | 250 | -0.40 | ||||
| 2025-08-14 | 13F | Royal Bank Of Canada | 960 | -88.19 | 48 | -88.24 | ||||
| 2025-08-05 | 13F | C2P Capital Advisory Group, LLC d.b.a. Prosperity Capital Advisors | 0 | -100.00 | 0 | |||||
| 2025-08-01 | 13F | Gwn Securities Inc. | 19,780 | -0.18 | 990 | -0.20 | ||||
| 2025-08-14 | 13F | Camarda Financial Advisors, LLC | 5,498 | 33.19 | 275 | 33.01 | ||||
| 2025-08-15 | 13F | Global View Capital Management LLC | 96,142 | 5.64 | 4,807 | 5.60 | ||||
| 2025-07-29 | 13F | International Assets Investment Management, Llc | 55,774 | -9.45 | 2,788 | -9.48 | ||||
| 2025-08-04 | 13F | Arkadios Wealth Advisors | 4,729 | 236 | ||||||
| 2025-07-29 | 13F | Kraft, Davis & Associates, LLC | 31,707 | 1,584 | ||||||
| 2025-08-12 | 13F | MAI Capital Management | 1,560 | 108.00 | 78 | 108.11 | ||||
| 2025-08-04 | 13F | Pensionmark Financial Group, Llc | 22,141 | 159.11 | 1,107 | 159.02 | ||||
| 2025-07-31 | 13F | Leavell Investment Management, Inc. | 10,355 | 4.41 | 518 | 4.44 | ||||
| 2025-08-14 | 13F | UBS Group AG | 703,865 | 31.96 | 35,190 | 31.92 | ||||
| 2025-07-23 | 13F | Tcfg Wealth Management, Llc | 15,881 | -36.99 | 794 | -37.06 | ||||
| 2025-07-09 | 13F | VisionPoint Advisory Group, LLC | 51,461 | 0.34 | 2,573 | 0.31 | ||||
| 2025-08-01 | 13F | Brookwood Investment Group LLC | 7,050 | -7.84 | 352 | -7.85 | ||||
| 2025-07-30 | 13F | Avidian Wealth Solutions, LLC | 156,894 | 5.16 | 7,844 | 5.13 | ||||
| 2025-08-14 | 13F | Stifel Financial Corp | 1,601,660 | -9.27 | 80,075 | -9.30 | ||||
| 2025-08-18 | 13F/A | National Bank Of Canada /fi/ | 19,699 | 65.14 | 985 | 65.10 | ||||
| 2025-08-26 | 13F | Claris Financial LLC | 45,070 | 42.09 | 2,253 | 42.50 | ||||
| 2025-08-13 | 13F | Renaissance Technologies Llc | 0 | -100.00 | 0 | |||||
| 2025-08-11 | 13F | HighTower Advisors, LLC | 268,750 | 291.13 | 13,436 | 291.04 | ||||
| 2025-08-07 | 13F | Nwam Llc | 0 | -100.00 | 0 | |||||
| 2025-08-14 | 13F | CoreCap Advisors, LLC | 1,250 | -14.50 | 62 | -15.07 | ||||
| 2025-04-21 | 13F | Beacon Capital Management, LLC | 0 | -100.00 | 0 | |||||
| 2025-07-17 | 13F | Venture Visionary Partners LLC | 5,402 | 0.00 | 270 | 0.00 | ||||
| 2025-08-12 | 13F | Jpmorgan Chase & Co | 151,383 | 49,050.32 | 7,568 | 50,353.33 | ||||
| 2025-07-24 | 13F | Us Bancorp \de\ | 7,329 | 0.00 | 366 | 0.00 | ||||
| 2025-08-15 | 13F | Keel Point, LLC | 8,012 | 0.00 | 401 | 0.00 | ||||
| 2025-08-13 | 13F | Proactive Wealth Strategies LLC | 128,401 | 1.38 | 6 | 0.00 | ||||
| 2025-08-06 | 13F | SOUTH STATE Corp | 0 | -100.00 | 0 | |||||
| 2025-07-25 | 13F | Prostatis Group LLC | 23,744 | 19.11 | 1,187 | 19.18 | ||||
| 2025-08-14 | 13F | Williams Jones Wealth Management, LLC. | 5,750 | 287 | ||||||
| 2025-05-16 | 13F | Jones Financial Companies Lllp | 0 | -100.00 | 0 | |||||
| 2025-08-14 | 13F | Millennium Management Llc | 32,122 | 1,606 | ||||||
| 2025-07-14 | 13F | Crew Capital Management, Ltd. | 47,963 | -12.23 | 2,398 | -12.26 | ||||
| 2025-07-16 | 13F/A | CX Institutional | 53,475 | 4.66 | 3 | 0.00 | ||||
| 2025-07-14 | 13F | Armstrong Advisory Group, Inc | 901 | 45 | ||||||
| 2025-08-14 | 13F | Mml Investors Services, Llc | 1,003,941 | 18.06 | 50 | 19.05 | ||||
| 2025-08-04 | 13F | Creative Financial Designs Inc /adv | 2,248 | 15.88 | 112 | 16.67 | ||||
| 2025-08-13 | 13F | Lido Advisors, LLC | 270,981 | -7.10 | 13,548 | -7.12 | ||||
| 2025-07-30 | 13F | Strategic Blueprint, LLC | 4,392 | -9.29 | 220 | -9.50 | ||||
| 2025-08-15 | 13F | Equitable Holdings, Inc. | 255,061 | 24.04 | 12,752 | 24.00 | ||||
| 2025-08-08 | 13F | Good Life Advisors, LLC | 15,378 | -4.95 | 769 | -5.07 | ||||
| 2025-08-06 | 13F | Walkner Condon Financial Advisors LLC | 0 | -100.00 | 0 | |||||
| 2025-05-02 | 13F | Kingsview Wealth Management, LLC | 0 | -100.00 | 0 | |||||
| 2025-07-25 | 13F | Cwm, Llc | 1,560 | -17.85 | 0 | |||||
| 2025-08-13 | 13F | Cerity Partners LLC | 7,181 | 0.00 | 359 | 0.00 | ||||
| 2025-08-08 | 13F | Cetera Investment Advisers | 393,444 | -1.15 | 19,670 | -1.18 | ||||
| 2025-08-14 | 13F | PenderFund Capital Management Ltd. | 6,000 | 300 | ||||||
| 2025-08-05 | 13F | American Institute for Advanced Investment Management, LLP | 4,600 | 0.00 | 230 | -0.43 | ||||
| 2025-05-28 | NP | RSEE - Rareview Systematic Equity ETF | 53,821 | -75.78 | 2,692 | -75.71 | ||||
| 2025-08-15 | 13F | Kestra Advisory Services, LLC | 363,963 | 26.35 | 18,196 | 26.32 | ||||
| 2025-07-14 | 13F | AdvisorNet Financial, Inc | 104,610 | 72.69 | 5,230 | 72.63 | ||||
| 2025-08-06 | 13F | Valtinson Bruner Financial Planning LLC | 16,063 | 1.69 | 803 | 1.77 | ||||
| 2025-08-06 | 13F | Golden State Wealth Management, LLC | 9,794 | -7.23 | 490 | -7.21 | ||||
| 2025-08-07 | 13F | Resources Investment Advisors, LLC. | 44,891 | 0.61 | 2,244 | 0.58 | ||||
| 2025-08-04 | 13F | IFG Advisory, LLC | 84,294 | -17.98 | 4,214 | -18.00 | ||||
| 2025-07-15 | 13F | Accurate Wealth Management, LLC | 11,041 | -4.58 | 550 | -4.68 | ||||
| 2025-08-12 | 13F | Proequities, Inc. | 0 | 0 | ||||||
| 2025-07-23 | 13F | WESPAC Advisors, LLC | 5,300 | 0.00 | 265 | -0.38 | ||||
| 2025-07-22 | 13F | Wealthcare Advisory Partners LLC | 324,665 | -16.61 | 16,232 | -16.64 | ||||
| 2025-07-25 | 13F | Genesee Capital Advisors, LLC | 4,226 | -2.72 | 211 | -2.76 | ||||
| 2025-04-30 | 13F | Allworth Financial LP | 0 | -100.00 | 0 | |||||
| 2025-08-05 | 13F | Integrity Financial Corp /WA | 8,418 | 0.00 | 421 | 0.00 | ||||
| 2025-08-05 | 13F | Sigma Planning Corp | 65,522 | 41.26 | 3,276 | 41.22 | ||||
| 2025-08-14 | 13F | Pinnacle Family Advisors, LLC | 0 | -100.00 | 0 | |||||
| 2025-08-06 | 13F | Stone House Investment Management, LLC | 0 | -100.00 | 0 | |||||
| 2025-07-14 | 13F | Opal Wealth Advisors, LLC | 4,280 | 214 | ||||||
| 2025-07-31 | 13F | Longview Financial Advisors, Inc. | 61,375 | -19.62 | 3,068 | -19.64 | ||||
| 2025-09-04 | 13F/A | Advisor Group Holdings, Inc. | 41,888 | -60.59 | 2,094 | -60.60 | ||||
| 2025-07-14 | 13F | Wealth Advisory Solutions, LLC | 18,238 | 106.80 | 912 | 106.58 | ||||
| 2025-07-17 | 13F | Argus Investors' Counsel, Inc. | 4,263 | -37.15 | 213 | -37.17 | ||||
| 2025-08-14 | 13F | Widmann Financial Services, Inc. | 10,680 | 5.95 | 534 | 5.75 | ||||
| 2025-07-29 | 13F | Oxbow Advisors, LLC | 2,060,435 | -20.08 | 103,011 | -20.11 | ||||
| 2025-08-14 | 13F | IHT Wealth Management, LLC | 25,672 | 12.80 | 1,283 | 12.74 | ||||
| 2025-08-14 | 13F | Great Valley Advisor Group, Inc. | 52,456 | 151.52 | 2,623 | 151.39 | ||||
| 2025-08-13 | 13F | Fi3 FINANCIAL ADVISORS, LLC | 0 | -100.00 | 0 | |||||
| 2025-07-15 | 13F | Signet Financial Management, Llc | 24,481 | -38.97 | 1,224 | -39.03 | ||||
| 2025-08-11 | 13F | Principal Securities, Inc. | 16,833 | 11.87 | 842 | 12.13 | ||||
| 2025-08-11 | 13F | NewEdge Wealth, LLC | 17,139 | -18.39 | 855 | -18.67 | ||||
| 2025-08-15 | 13F | Captrust Financial Advisors | 187,924 | 4,270.33 | 9,395 | 4,269.77 | ||||
| 2025-08-04 | 13F | Integrity Alliance, Llc. | 0 | -100.00 | 0 | |||||
| 2025-08-14 | 13F | Hilton Capital Management, LLC | 136,385 | 150.16 | 6,819 | 150.11 | ||||
| 2025-07-17 | 13F | Janney Montgomery Scott LLC | 16,093 | -1.49 | 1 | |||||
| 2025-07-28 | 13F | Mutual Advisors, LLC | 16,862 | -5.80 | 843 | -5.82 | ||||
| 2025-08-15 | 13F | Semmax Financial Advisors Inc. | 110,452 | -11.97 | 5,510 | -11.98 | ||||
| 2025-08-14 | 13F | Money Concepts Capital Corp | 171,804 | -21.26 | 8,589 | -21.29 | ||||
| 2025-05-08 | 13F | Strategic Advocates LLC | 0 | -100.00 | 0 | |||||
| 2025-04-11 | 13F | Signal Advisors Wealth, LLC | 0 | -100.00 | 0 | |||||
| 2025-07-08 | 13F | Nbc Securities, Inc. | 500 | 0 | ||||||
| 2025-07-30 | 13F | Eqis Capital Management, Inc. | 17,281 | -0.42 | 864 | -0.46 | ||||
| 2025-08-07 | 13F | CENTRAL TRUST Co | 504,477 | 5.42 | 25,221 | 5.39 | ||||
| 2025-08-28 | NP | SAMT - STRATEGAS MACRO THEMATIC OPPORTUNITIES ETF | 87,751 | 4,387 | ||||||
| 2025-07-22 | 13F | Inlight Wealth Management, LLC | 0 | -100.00 | 0 | |||||
| 2025-08-07 | 13F | Ibex Wealth Advisors | 260,015 | 13.13 | 12,999 | 13.09 | ||||
| 2025-07-16 | 13F | Strategic Investment Solutions, Inc. /IL | 21,494 | -3.77 | 1,071 | -4.12 | ||||
| 2025-07-09 | 13F | Massmutual Trust Co Fsb/adv | 60 | 3 | ||||||
| 2025-08-11 | 13F | TD Waterhouse Canada Inc. | 1,200 | 60 | ||||||
| 2025-08-12 | 13F | Gladstone Institutional Advisory LLC | 11,535 | -74.66 | 577 | -74.69 | ||||
| 2025-07-22 | 13F | MBL Wealth, LLC | 18,462 | -12.20 | 923 | -12.18 | ||||
| 2025-07-31 | 13F | Glass Jacobson Investment Advisors llc | 35,316 | -0.55 | 1,766 | -0.28 | ||||
| 2025-08-14 | 13F | Colony Group, LLC | 4,352 | -34.46 | 218 | -34.64 | ||||
| 2025-08-04 | 13F | Coign Capital Advisors LLC | 157,411 | -11.36 | 7,870 | -11.39 | ||||
| 2025-08-13 | 13F | Twin Peaks Wealth Advisors, LLC | 140 | 7 | ||||||
| 2025-08-08 | 13F | Fortis Group Advisors, LLC | 79,032 | -24.17 | 3,950 | -24.21 | ||||
| 2025-05-14 | 13F | Huntington National Bank | 12 | -82.54 | ||||||
| 2025-08-13 | 13F | Vermillion & White Wealth Management Group, LLC | 3,961 | 198 | ||||||
| 2025-07-31 | 13F | Pinnacle Wealth Management Group, Inc. | 156,066 | 4.38 | 7,803 | 4.36 | ||||
| 2025-08-07 | 13F | Summit X, LLC | 5,000 | 250 | ||||||
| 2025-08-06 | 13F | Legacy Wealth Managment, LLC/ID | 2,846 | 0.00 | 142 | 0.00 | ||||
| 2025-08-13 | 13F | Cresset Asset Management, LLC | 30,217 | 0.09 | 1,511 | 0.07 | ||||
| 2025-07-22 | 13F | Global Assets Advisory, LLC | 24,341 | -53.56 | 1,213 | -53.62 | ||||
| 2025-04-22 | 13F | VanWeelden Wealth Management, LLC | 278,928 | -35.05 | 13,949 | -34.85 | ||||
| 2025-08-12 | 13F | Jaffetilchin Investment Partners, LLC | 82,310 | -2.50 | 4,115 | -2.51 | ||||
| 2025-08-04 | 13F | Kovack Advisors, Inc. | 4,265 | 213 | ||||||
| 2025-08-14 | 13F | Wells Fargo & Company/mn | 1,098,489 | 3,844.87 | 54,919 | 3,845.26 | ||||
| 2025-07-28 | 13F | Copia Wealth Management | 124,184 | 0.26 | 6,209 | 0.23 | ||||
| 2025-07-24 | 13F | Wealthstar Advisors, Llc | 133,289 | 13.68 | 6,664 | 13.64 | ||||
| 2025-04-21 | 13F | Ronald Blue Trust, Inc. | 0 | -100.00 | 0 | -100.00 | ||||
| 2025-07-24 | 13F | Lindenwold Advisors | 4,149 | 0.00 | 207 | 0.00 | ||||
| 2025-08-18 | 13F | N.E.W. Advisory Services LLC | 204 | -19.05 | 10 | -16.67 | ||||
| 2025-04-21 | 13F | ORG Partners LLC | 0 | -100.00 | 0 | |||||
| 2025-08-15 | 13F | First Heartland Consultants, Inc. | 98,035 | -2.57 | 4,901 | -2.58 | ||||
| 2025-08-13 | 13F | Denver Wealth Management, Inc. | 162,135 | 3.30 | 8,106 | 3.26 | ||||
| 2025-05-06 | 13F | WT Wealth Management | 0 | -100.00 | 0 | |||||
| 2025-08-27 | 13F/A | Brinker Capital Investments, LLC | 31,915 | 164.15 | 1,596 | 164.07 | ||||
| 2025-08-08 | 13F | Altfest L J & Co Inc | 34,140 | -10.56 | 1,707 | -10.59 | ||||
| 2025-04-30 | 13F | Values First Advisors, Inc. | 0 | -100.00 | 0 | |||||
| 2025-07-25 | 13F | Apollon Wealth Management, LLC | 12,437 | -27.99 | 622 | -28.04 | ||||
| 2025-07-16 | 13F | Signaturefd, Llc | 118 | -76.40 | 6 | -80.00 | ||||
| 2025-08-05 | 13F | Prosperity Wealth Management, Inc. | 9,000 | 106.90 | 450 | 106.91 | ||||
| 2025-08-25 | 13F/A | Neuberger Berman Group LLC | 132,300 | -22.80 | 6,614 | -22.82 | ||||
| 2025-08-13 | 13F | RIA Advisory Group LLC | 175,044 | 7.64 | 8,751 | 7.61 | ||||
| 2025-08-12 | 13F | Zacks Investment Management | 4,705 | 13.43 | 235 | 13.53 | ||||
| 2025-04-22 | 13F | Synergy Financial Management, LLC | 0 | -100.00 | 0 | |||||
| 2025-05-15 | 13F | Foguth Wealth Management, LLC. | 0 | -100.00 | 0 | |||||
| 2025-08-14 | 13F | CIBC World Markets Inc. | 13,435 | 93.92 | 672 | 93.93 | ||||
| 2025-05-15 | 13F/A | Orion Portfolio Solutions, LLC | 12,082 | 154.04 | 604 | 154.85 | ||||
| 2025-07-22 | 13F | DAVENPORT & Co LLC | 72,662 | 4.86 | 3,633 | 4.85 | ||||
| 2025-05-02 | 13F | Montis Financial, LLC | 0 | -100.00 | 0 | |||||
| 2025-05-15 | 13F | Creative Planning | 0 | -100.00 | 0 | |||||
| 2025-08-12 | 13F | Founders Financial Alliance, LLC | 61,128 | 9.87 | 3,056 | 9.85 | ||||
| 2025-07-29 | 13F | Vista Finance, Llc | 7,465 | -70.80 | 373 | -70.81 | ||||
| 2025-08-14 | 13F | Goldman Sachs Group Inc | 0 | -100.00 | 0 | |||||
| 2025-08-01 | 13F | GoalVest Advisory LLC | 6,661 | 408.09 | 333 | 412.31 | ||||
| 2025-08-04 | 13F | Spire Wealth Management | 95 | 5 | ||||||
| 2025-08-12 | 13F | Northeast Planning Associates, Inc. / Nh / | 9,945 | -68.94 | 497 | -68.96 | ||||
| 2025-08-04 | 13F | Bay Colony Advisory Group, Inc d/b/a Bay Colony Advisors | 103,080 | 11.15 | 5,153 | 11.18 | ||||
| 2025-08-12 | 13F | Insigneo Advisory Services, Llc | 4,011 | -20.37 | 201 | -20.32 | ||||
| 2025-08-01 | 13F | Ashton Thomas Private Wealth, LLC | 112,175 | 3.49 | 5,608 | 3.47 | ||||
| 2025-04-29 | NP | LFSC - F/m Emerald Life Sciences Innovation ETF | 17,962 | 26.27 | 898 | 26.30 | ||||
| 2025-07-31 | 13F | Cambridge Investment Research Advisors, Inc. | 496,336 | -2.90 | 25 | -4.00 | ||||
| 2025-08-15 | 13F | Morgan Stanley | 8,588,384 | 27.22 | 429,376 | 27.18 | ||||
| 2025-07-30 | 13F | D.a. Davidson & Co. | 5,848 | -62.78 | 292 | -62.80 | ||||
| 2025-08-19 | 13F | National Asset Management, Inc. | 57,098 | -28.72 | 2,855 | -28.52 | ||||
| 2025-08-05 | 13F | Westside Investment Management, Inc. | 4,750 | -16.67 | 237 | -16.84 | ||||
| 2025-08-14 | 13F/A | Rockefeller Capital Management L.P. | 21,272 | 51.99 | 1,064 | 52.07 | ||||
| 2025-05-12 | 13F | Independent Advisor Alliance | 0 | -100.00 | 0 | |||||
| 2025-07-29 | 13F | Stratos Wealth Partners, LTD. | 261,675 | -42.51 | 13,082 | -42.52 | ||||
| 2025-08-08 | 13F/A | Ignite Planners, LLC | 36,396 | 21.65 | 1,817 | 21.86 | ||||
| 2025-08-12 | 13F | Change Path, LLC | 13,985 | -0.75 | 699 | -0.71 | ||||
| 2025-07-24 | 13F | WMG Financial Advisors, LLC | 111,057 | -2.87 | 5,552 | -2.90 | ||||
| 2025-08-13 | 13F | Everstar Asset Management, LLC | 9,473 | 76.57 | 474 | 76.49 | ||||
| 2025-08-19 | 13F | Newbridge Financial Services Group, Inc. | 200 | 0.00 | 10 | -10.00 | ||||
| 2025-07-18 | 13F | Trilogy Capital Inc. | 15,421 | 771 | ||||||
| 2025-07-07 | 13F | TruWealth Advisors, LLC | 22,518 | -3.27 | 1,126 | -3.35 | ||||
| 2025-08-12 | 13F | Calton & Associates, Inc. | 14,063 | 0.45 | 703 | 0.43 | ||||
| 2025-08-08 | 13F | Intrua Financial, LLC | 4,045 | 1.05 | 202 | 1.00 | ||||
| 2025-08-12 | 13F | Global Retirement Partners, LLC | 26,197 | 3,685.69 | 1,310 | 3,750.00 | ||||
| 2025-07-10 | 13F | Wealth Enhancement Advisory Services, Llc | 1,422,449 | 31.61 | 70,909 | 31.19 | ||||
| 2025-08-13 | 13F | VestGen Advisors, LLC | 4,025 | -4.24 | 201 | -4.29 | ||||
| 2025-05-05 | 13F | Lindbrook Capital, Llc | 0 | -100.00 | 0 | |||||
| 2025-08-14 | 13F | Ausdal Financial Partners, Inc. | 6,000 | 300 | ||||||
| 2025-05-14 | 13F | Orion Capital Management LLC | 0 | -100.00 | 0 | |||||
| 2025-07-21 | 13F | Ameritas Advisory Services, LLC | 40,809 | -75.02 | 2,040 | -75.02 | ||||
| 2025-08-08 | 13F | Gts Securities Llc | 61,609 | 3,080 | ||||||
| 2025-04-15 | 13F | GPS Wealth Strategies Group, LLC | 0 | -100.00 | 0 | |||||
| 2025-07-29 | 13F | Latitude Advisors, LLC | 6,034 | 1.02 | 302 | 1.01 | ||||
| 2025-07-31 | 13F | Oppenheimer & Co Inc | 10,614 | 7.64 | 531 | 7.51 | ||||
| 2025-08-13 | 13F | Trustmark National Bank Trust Department | 12,903 | 0.00 | 645 | 0.00 | ||||
| 2025-05-09 | 13F | Northern Oak Wealth Management Inc | 0 | -100.00 | 0 | |||||
| 2025-08-13 | 13F | Quadrature Capital Ltd | 4,964 | 248 | ||||||
| 2025-08-19 | 13F | Wealth Group, Ltd. | 0 | -100.00 | 0 | |||||
| 2025-08-14 | 13F | Synovus Financial Corp | 136,026 | 41.26 | 6,801 | 41.23 | ||||
| 2025-07-09 | 13F | Dynamic Advisor Solutions LLC | 11,100 | 0.00 | 555 | -0.18 | ||||
| 2025-07-16 | 13F | Spinnaker Investment Group, LLC | 0 | -100.00 | 0 | |||||
| 2025-04-21 | 13F | Nelson, Van Denburg & Campbell Wealth Management Group, LLC | 0 | -100.00 | 0 | |||||
| 2025-08-12 | 13F | PSI Advisors, LLC | 0 | -100.00 | 0 | |||||
| 2025-05-16 | 13F | Coppell Advisory Solutions LLC | 0 | -100.00 | 0 | |||||
| 2025-08-07 | 13F | Encompass More Asset Management | 17,049 | 65.40 | 852 | 65.44 | ||||
| 2025-08-12 | 13F | Cornerstone Wealth Management, LLC | 9,798 | 78.05 | 490 | 77.82 | ||||
| 2025-05-09 | 13F | Delta Asset Management Llc/tn | 0 | -100.00 | 0 | |||||
| 2025-05-14 | 13F | Ameriprise Financial Inc | 0 | -100.00 | 0 | |||||
| 2025-07-30 | 13F | Forum Financial Management, LP | 103,059 | 0.19 | 5,152 | 0.16 | ||||
| 2025-08-11 | 13F | Retirement Capital Strategies | 217,068 | 982.74 | 10,852 | 983.03 | ||||
| 2025-07-30 | 13F/A | Divergent Planning, LLC | 137,848 | 81.37 | 6,868 | 81.28 | ||||
| 2025-07-29 | 13F | Koshinski Asset Management, Inc. | 62,867 | 51.94 | 3,143 | 51.91 | ||||
| 2025-05-14 | 13F | Andina Capital Management, LLC | 0 | -100.00 | 0 | |||||
| 2025-08-15 | 13F | Ewing Morris & Co. Investment Partners Ltd. | 0 | -100.00 | 0 | |||||
| 2025-07-15 | 13F | Clarus Group, Inc. | 29,076 | -8.14 | 1,454 | -8.21 | ||||
| 2025-08-14 | 13F | Integrity Wealth Advisors, Inc. | 0 | -100.00 | 0 | |||||
| 2025-04-28 | 13F | Pinnacle Financial Partners Inc | 51,602 | -0.62 | 2,581 | -0.31 | ||||
| 2025-04-16 | 13F/A | Western Wealth Management, LLC | 0 | -100.00 | 0 | |||||
| 2025-07-25 | 13F | Sovereign Financial Group, Inc. | 111,571 | 32.36 | 5,578 | 32.31 | ||||
| 2025-07-14 | 13F | S.A. Mason LLC | 2,300 | 115 | ||||||
| 2025-07-15 | 13F | SJS Investment Consulting Inc. | 0 | -100.00 | 0 | |||||
| 2025-07-31 | 13F | B & T Capital Management DBA Alpha Capital Management | 116,669 | -10.35 | 5,833 | -10.39 | ||||
| 2025-08-07 | 13F | Kestra Private Wealth Services, Llc | 231,062 | 17.21 | 11,552 | 17.17 | ||||
| 2025-07-23 | 13F | Vontobel Holding Ltd. | 0 | -100.00 | 0 | |||||
| 2025-07-30 | 13F | BlueChip Wealth Advisors LLC | 21,985 | 0.00 | 1,099 | 0.00 | ||||
| 2025-08-12 | 13F | Marshall & Sterling Wealth Advisors Inc. | 28,323 | 4.21 | 1,416 | 4.12 | ||||
| 2025-07-16 | 13F | ORG Wealth Partners, LLC | 0 | -100.00 | 0 | |||||
| 2025-07-24 | 13F | IFP Advisors, Inc | 31,247 | 26.23 | 1,562 | 26.27 | ||||
| 2025-08-14 | 13F | Principia Wealth Advisory, LLC | 2 | 0 | ||||||
| 2025-08-11 | 13F | Tidemark, LLC | 13,758 | 2.21 | 688 | 2.08 | ||||
| 2025-08-15 | 13F | CI Private Wealth, LLC | 34,218 | 10.50 | 1,711 | 10.47 | ||||
| 2025-08-05 | 13F | Simplex Trading, Llc | 2 | 0 | ||||||
| 2025-08-08 | 13F | Avantax Advisory Services, Inc. | 28,928 | -8.25 | 1,446 | -8.25 | ||||
| 2025-08-12 | 13F | Steward Partners Investment Advisory, Llc | 295,257 | -22.96 | 14,761 | -22.98 | ||||
| 2025-08-14 | 13F | Fmr Llc | 624 | -82.12 | 31 | -82.18 | ||||
| 2025-08-13 | 13F | F/M Investments LLC | 1,021,520 | 30.82 | 51,070 | 30.79 | ||||
| 2025-07-28 | 13F | Elmwood Wealth Management, Inc. | 10,315 | 0.00 | 516 | 0.00 | ||||
| 2025-07-28 | 13F | Revolve Wealth Partners, LLC | 486,487 | 0.04 | 24,322 | 0.00 | ||||
| 2025-07-29 | 13F | Private Trust Co Na | 18,016 | 10.88 | 901 | 10.84 | ||||
| 2025-07-25 | 13F | Transcendent Capital Group LLC | 23,160 | -48.77 | 1,158 | -48.83 | ||||
| 2025-08-04 | 13F | Savvy Advisors, Inc. | 4,446 | 222 | ||||||
| 2025-08-11 | 13F | Core Wealth Partners LLC | 18,533 | -3.32 | 927 | -3.34 | ||||
| 2025-07-18 | 13F | Marino, Stram & Associates Llc | 0 | -100.00 | 0 | |||||
| 2025-07-18 | 13F | PFG Investments, LLC | 4,611 | 231 | ||||||
| 2025-08-04 | 13F | Silver Coast Investments LLC | 22,642 | 5.00 | 1,132 | 4.92 | ||||
| 2025-08-14 | 13F | EP Wealth Advisors, Inc. | 13,509 | 9.95 | 675 | 9.93 | ||||
| 2025-07-07 | 13F | Park Edge Advisors, LLC | 7,687 | -53.38 | 384 | -53.40 | ||||
| 2025-08-08 | 13F | Meridian Wealth Management, LLC | 25,003 | -10.34 | 1,250 | -10.33 | ||||
| 2025-04-22 | 13F | Castleview Partners, Llc | 0 | -100.00 | 0 | |||||
| 2025-08-14 | 13F | Toroso Investments, LLC | 174,778 | 23.21 | 8,707 | 22.75 | ||||
| 2025-04-10 | 13F | SMI Advisory Services, LLC | 0 | -100.00 | 0 | |||||
| 2025-08-01 | 13F | Vision Financial Markets Llc | 109,288 | 3.79 | 5,464 | 3.78 | ||||
| 2025-08-14 | 13F | Betterment LLC | 26,705 | 4.18 | 1 | 0.00 | ||||
| 2025-08-06 | 13F | Commonwealth Equity Services, Llc | 913,760 | -4.38 | 46 | -4.26 | ||||
| 2025-07-31 | 13F | Sage Mountain Advisors LLC | 32,203 | -11.30 | 1,610 | -11.35 | ||||
| 2025-08-13 | 13F | Townsquare Capital Llc | 0 | -100.00 | 0 | |||||
| 2025-07-29 | 13F | Financial Guidance Group, Inc. | 8,900 | -2.20 | 445 | -2.42 | ||||
| 2025-08-14 | 13F | Raymond James Financial Inc | 2,012,446 | -1.18 | 100,612 | -1.21 | ||||
| 2025-08-12 | 13F | Putnam Fl Investment Management Co | 187,515 | -11.21 | 9,375 | -11.24 | ||||
| 2025-08-13 | 13F | Luminist Capital LLC | 7,315 | -1.20 | 364 | -1.36 | ||||
| 2025-08-06 | 13F | Rps Advisory Solutions Llc | 0 | -100.00 | 0 | |||||
| 2025-08-13 | 13F | Wealthquest Corp | 228,988 | -6.71 | 11,448 | -6.74 | ||||
| 2025-08-14 | 13F | Ancora Advisors, LLC | 53 | -51.82 | 3 | -60.00 | ||||
| 2025-08-29 | 13F | Total Investment Management Inc | 1,023,870 | 51,188 | ||||||
| 2025-07-16 | 13F | Crown Wealth Group, LLC | 34,541 | 110.24 | 1,727 | 110.23 | ||||
| 2025-07-18 | 13F | Truist Financial Corp | 84,137 | -4.51 | 4,206 | -4.54 | ||||
| 2025-08-04 | 13F | Flagship Harbor Advisors, Llc | 47,612 | 294.50 | 2,380 | 294.69 | ||||
| 2025-08-11 | 13F | Banque Cantonale Vaudoise | 2,868 | 6.18 | 0 | |||||
| 2025-07-23 | 13F | Gentry Private Wealth, Llc | 6,141 | -33.90 | 307 | -33.84 | ||||
| 2025-07-09 | 13F | Heritage Wealth Architects, Inc. | 115,747 | 5,787 | ||||||
| 2025-07-09 | 13F | Fiduciary Alliance LLC | 80,800 | -5.39 | 4,040 | -5.41 | ||||
| 2025-08-14 | 13F | Mariner, LLC | 358,151 | 16.17 | 17,906 | 16.14 | ||||
| 2025-07-22 | 13F | Coastal Investment Advisors, Inc. | 2,500 | 0.00 | 125 | -0.80 | ||||
| 2025-07-23 | 13F | Castle Rock Wealth Management, LLC | 6,556 | 21.68 | 327 | 22.01 | ||||
| 2025-07-16 | 13F | Formidable Asset Management, LLC | 104,240 | 1.96 | 5,213 | 1.96 | ||||
| 2025-07-23 | 13F | Clear Creek Financial Management, LLC | 23,190 | 1,159 | ||||||
| 2025-07-25 | 13F | Atria Wealth Solutions, Inc. | 21,257 | 69.23 | 1,063 | 69.11 | ||||
| 2025-08-13 | 13F | Generation Capital Management LLC | 268,531 | 8.10 | 13,425 | 8.07 | ||||
| 2025-08-14 | 13F | Benjamin Edwards Inc | 797,860 | 14.18 | 39,889 | 14.15 | ||||
| 2025-05-19 | 13F | Heck Capital Advisors, LLC | 0 | 0 | ||||||
| 2025-08-14 | 13F | GWM Advisors LLC | 33,467 | -60.80 | 1,673 | -60.81 | ||||
| 2025-07-21 | 13F | DHJJ Financial Advisors, Ltd. | 2 | 0.00 | 0 | |||||
| 2025-04-29 | 13F | Brookstone Capital Management | 0 | -100.00 | 0 | |||||
| 2025-08-07 | 13F | 49 Wealth Management, Llc | 222,297 | -16.80 | 11,114 | -16.83 | ||||
| 2025-08-14 | 13F | Susquehanna International Group, Llp | 54,708 | 70.63 | 2,735 | 70.62 | ||||
| 2025-07-03 | 13F | TrueWealth Advisors, LLC | 16,631 | -13.25 | 831 | -13.26 | ||||
| 2025-08-05 | 13F | Rareview Capital LLC | 53,821 | 0.00 | 2,691 | -0.04 | ||||
| 2025-07-28 | 13F | Harbour Investments, Inc. | 13,133 | -9.71 | 657 | -9.77 | ||||
| 2025-07-28 | 13F | RFG Advisory, LLC | 125,954 | 28.62 | 6,297 | 28.59 | ||||
| 2025-07-23 | 13F | RiverTree Advisors, LLC | 0 | -100.00 | 0 | |||||
| 2025-08-06 | 13F | AE Wealth Management LLC | 24,580 | 2,229.86 | 1,229 | 2,261.54 | ||||
| 2025-08-05 | 13F | Ceera Investments, Llc | 27,965 | -33.01 | 1,398 | -33.01 | ||||
| 2025-08-01 | 13F | Envestnet Asset Management Inc | 887,973 | 5.09 | 44,394 | 5.06 | ||||
| 2025-08-19 | 13F/A | Pitcairn Co | 25,450 | 0.00 | 1,272 | 0.00 | ||||
| 2025-08-14 | 13F | Family Office Research LLC | 235,946 | -37.96 | 11,796 | -37.98 | ||||
| 2025-08-05 | 13F | Bank Of Montreal /can/ | 54,561 | 14,646.22 | 2,728 | 15,050.00 | ||||
| 2025-08-08 | 13F | Pnc Financial Services Group, Inc. | 0 | -100.00 | 0 | |||||
| 2025-08-14 | 13F | Integrated Wealth Concepts LLC | 474,058 | 5.59 | 23,701 | 5.56 | ||||
| 2025-08-14 | 13F | Comerica Bank | 47,568 | 70.07 | 2,378 | 70.10 | ||||
| 2025-07-14 | 13F | Sterling Group Wealth Management, LLC | 23,533 | 1,177 | ||||||
| 2025-08-07 | 13F | Traynor Capital Management, Inc. | 7,074 | 352 | ||||||
| 2025-08-14 | 13F | Citadel Advisors Llc | 160,665 | 8,032 | ||||||
| 2025-07-31 | 13F | Stegent Equity Advisors, Inc. | 36,526 | -14.82 | 1,826 | -14.83 | ||||
| 2025-08-13 | 13F | EverSource Wealth Advisors, LLC | 4,748 | 31.31 | 237 | 31.67 | ||||
| 2025-07-23 | 13F | Kingswood Wealth Advisors, Llc | 0 | -100.00 | 0 | -100.00 | ||||
| 2025-07-30 | 13F | Red Crane Wealth Management, Llc | 15,945 | -17.07 | 797 | -17.07 | ||||
| 2025-08-29 | 13F | Centaurus Financial, Inc. | 11,776 | 38.98 | 1 |