Mga Batayang Estadistika
| Saham Institusional (Jangka Panjang) | 7,344,299 - 24.38% (ex 13D/G) - change of 0.87MM shares 13.39% MRQ |
| Nilai Institusional (Jangka Panjang) | $ 135,520 USD ($1000) |
Kepemilikan Institusional dan Pemegang Saham
Tsakos Energy Navigation Limited (US:TNP) memiliki 85 pemilik institusional dan pemegang saham yang telah mengajukan formulir 13D/G atau 13F kepada Komisi Bursa Efek (Securities Exchange Commission/SEC). Lembaga-lembaga ini memegang total 7,344,299 saham. Pemegang saham terbesar meliputi Arrowstreet Capital, Limited Partnership, MIRAE ASSET GLOBAL ETFS HOLDINGS Ltd., CastleKnight Management LP, Renaissance Technologies Llc, Morgan Stanley, Main Street Financial Solutions, LLC, Pale Fire Capital SE, Foundation Resource Management Inc, BlackRock, Inc., and Susquehanna International Group, Llp .
Struktur kepemilikan institusional Tsakos Energy Navigation Limited (NYSE:TNP) menunjukkan posisi terkini di perusahaan oleh institusi dan dana, serta perubahan terbaru dalam ukuran posisi. Pemegang saham utama dapat mencakup investor individu, reksa dana, dana lindung nilai, atau institusi. Jadwal 13D menunjukkan bahwa investor memegang (atau pernah memegang) lebih dari 5% saham perusahaan dan bermaksud (atau pernah bermaksud) untuk secara aktif mengejar perubahan strategi bisnis. Jadwal 13G menunjukkan investasi pasif lebih dari 5%.

Skor Sentimen Dana
Skor Sentimen Dana (sebelumnya dikenal sebagai Skor Akumulasi Kepemilikan) menemukan saham-saham yang paling banyak dibeli oleh dana. Ini adalah hasil dari model kuantitatif multi-faktor yang canggih yang mengidentifikasi perusahaan dengan tingkat akumulasi institusional tertinggi. Model penilaian menggunakan kombinasi dari total peningkatan pemilik yang diungkapkan, perubahan dalam alokasi portofolio pada pemilik tersebut, dan metrik lainnya. Angka berkisar dari 0 hingga 100, dengan angka yang lebih tinggi menunjukkan tingkat akumulasi yang lebih tinggi dibandingkan dengan perusahaan sejenisnya, dan 50 adalah rata-ratanya.
Frekuensi Pembaruan: Setiap Hari
Lihat Ownership Explorer, yang menyediakan daftar perusahaan dengan peringkat tertinggi.
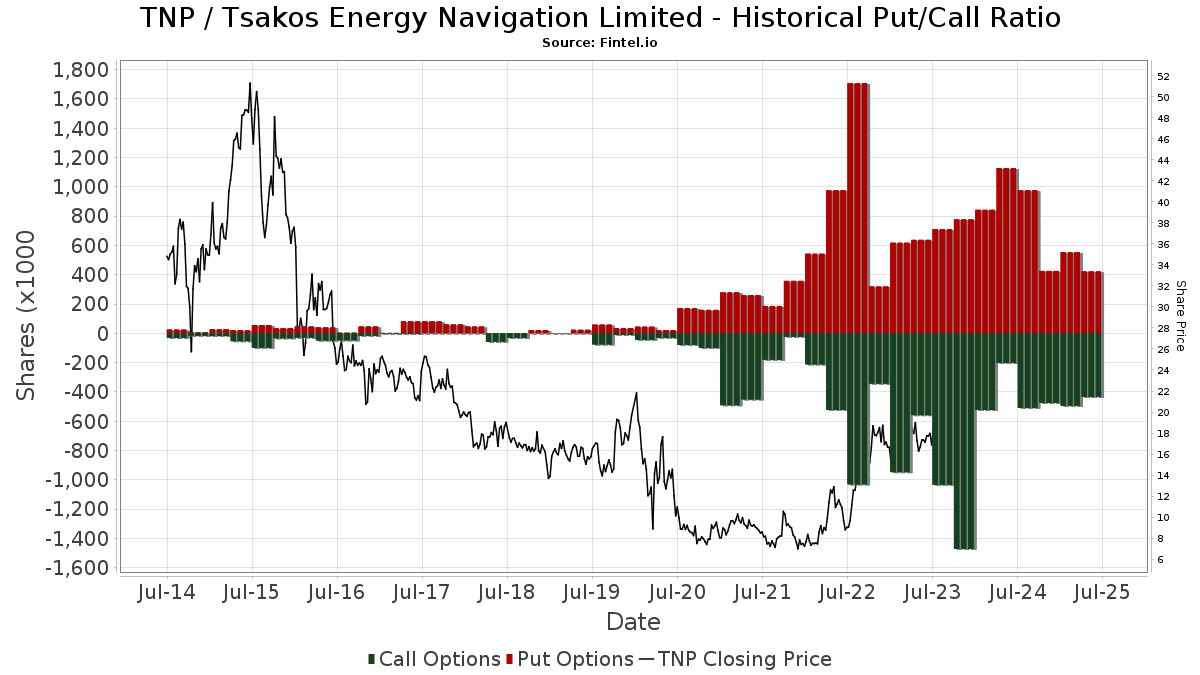
Rasio Put/Call Institusional
Selain melaporkan isu ekuitas dan utang standar, institusi dengan aset di bawah manajemen lebih dari 100 juta dolar AS juga harus mengungkapkan kepemilikan opsi put dan call mereka. Karena opsi put umumnya menunjukkan sentimen negatif, dan opsi call menunjukkan sentimen positif, kita dapat mengetahui sentimen institusional secara keseluruhan dengan memplot rasio put terhadap call. Grafik di sebelah kanan memplot rasio put/call historis untuk instrumen ini.
Menggunakan Rasio Put/Call sebagai indikator sentimen investor mengatasi salah satu kekurangan utama dari penggunaan total kepemilikan institusional, yaitu sejumlah besar aset yang dikelola diinvestasikan secara pasif untuk melacak indeks. Dana yang dikelola secara pasif biasanya tidak membeli opsi, sehingga indikator rasio put/call lebih akurat dalam melacak sentimen dana yang dikelola secara aktif.
Pengajuan 13F dan NPORT
Detail pada pengajuan 13F tersedia gratis. Detail pada pengajuan NP memerlukan keanggotaan premium. Baris berwarna hijau menunjukkan posisi baru. Baris berwarna merah menunjukkan posisi yang sudah ditutup. Klik tautan ini ikon untuk melihat riwayat transaksi selengkapnya.
Tingkatkan
untuk membuka data premium dan mengekspor ke Excel ![]() .
.
| Tanggal File | Sumber | Investor | Ketik | Presyo ng Avg (Silangan) |
Saham | Δ Saham (%) |
Dilaporkan Nilai ($1000) |
Nilai Δ (%) |
Alokasi Port (%) |
|
|---|---|---|---|---|---|---|---|---|---|---|
| 2025-06-30 | NP | GREK - Global X MSCI Greece ETF This fund is a listed as child fund of Mirae Asset Global Investments Co., Ltd. and if that institution has disclosed ownership in this security, then these positions will not be double counted when calculating total shares and total value | 122,038 | 4.53 | 2,040 | -2.25 | ||||
| 2025-08-11 | 13F | Hexagon Capital Partners LLC | 0 | -100.00 | 0 | |||||
| 2025-07-16 | 13F | ORG Partners LLC | 100 | 0.00 | 2 | 0.00 | ||||
| 2025-08-14 | 13F | Millennium Management Llc | 64,218 | 1,232 | ||||||
| 2025-08-14 | 13F | UBS Group AG | 113,411 | -17.46 | 2,176 | -7.13 | ||||
| 2025-08-28 | NP | CPAEX - Counterpoint Tactical Equity Fund Class A Shares | 20,034 | 159.98 | 384 | 70.67 | ||||
| 2025-08-14 | 13F | Stifel Financial Corp | 67,851 | 3.28 | 1,302 | 16.25 | ||||
| 2025-08-14 | 13F | Condire Management, LP | 190,977 | 0.00 | 3,665 | 12.46 | ||||
| 2025-07-21 | 13F | Ameritas Advisory Services, LLC | 1,000 | 19 | ||||||
| 2025-08-06 | 13F | Commonwealth Equity Services, Llc | 77,959 | -9.21 | 1 | 0.00 | ||||
| 2025-08-14 | 13F | Jane Street Group, Llc | Put | 25,400 | 487 | |||||
| 2025-07-31 | 13F | Caitong International Asset Management Co., Ltd | 3 | -97.46 | 0 | -100.00 | ||||
| 2025-08-12 | 13F | Proequities, Inc. | Put | 0 | 0 | |||||
| 2025-08-14 | 13F | Tudor Investment Corp Et Al | 51,013 | 979 | ||||||
| 2025-08-14 | 13F | MIRAE ASSET GLOBAL ETFS HOLDINGS Ltd. | 829,437 | 602.17 | 15,917 | 689.88 | ||||
| 2025-08-12 | 13F | Proequities, Inc. | Call | 0 | 0 | |||||
| 2025-08-14 | 13F | Jane Street Group, Llc | 102,437 | 44.00 | 1,966 | 62.00 | ||||
| 2025-08-12 | 13F | Proequities, Inc. | 0 | 0 | ||||||
| 2025-05-15 | 13F | Cubist Systematic Strategies, LLC | 0 | -100.00 | 0 | |||||
| 2025-08-14 | 13F | Jane Street Group, Llc | Call | 12,000 | 230 | |||||
| 2025-07-14 | 13F | Foundation Resource Management Inc | 349,581 | -0.81 | 6,708 | 11.58 | ||||
| 2025-05-15 | 13F | Engineers Gate Manager LP | 0 | -100.00 | 0 | -100.00 | ||||
| 2025-08-14 | 13F | Tudor Investment Corp Et Al | Call | 0 | -100.00 | 0 | -100.00 | |||
| 2025-07-22 | 13F | IMC-Chicago, LLC | Call | 0 | -100.00 | 0 | -100.00 | |||
| 2025-05-14 | 13F | Aristides Capital LLC | 0 | -100.00 | 0 | |||||
| 2025-03-26 | NP | SFSNX - Schwab Fundamental US Small Company Index Fund Institutional Shares | 8,177 | -50.99 | 146 | -59.78 | ||||
| 2025-08-12 | 13F | LPL Financial LLC | 11,725 | 9.50 | 225 | 23.63 | ||||
| 2025-08-19 | NP | GARTX - Goldman Sachs Absolute Return Tracker Fund Class A | 3,479 | -39.82 | 67 | -32.65 | ||||
| 2025-08-14 | 13F | Balyasny Asset Management Llc | 33,606 | 42.59 | 645 | 60.20 | ||||
| 2025-08-14 | 13F | Raymond James Financial Inc | 3,027 | 58 | ||||||
| 2025-08-14 | 13F | Wells Fargo & Company/mn | 21,556 | 27.41 | 414 | 43.40 | ||||
| 2025-08-14 | 13F | Federation des caisses Desjardins du Quebec | 250 | 0.00 | 5 | 0.00 | ||||
| 2025-08-05 | 13F | Huntington National Bank | 1 | 0.00 | 0 | |||||
| 2025-05-15 | 13F | Altshuler Shaham Ltd | 0 | -100.00 | 0 | -100.00 | ||||
| 2025-08-11 | 13F | Sprott Inc. | 17,700 | 340 | ||||||
| 2025-08-14 | 13F | Verition Fund Management LLC | 43,703 | 148.06 | 839 | 179.33 | ||||
| 2025-08-14 | 13F | CastleKnight Management LP | Call | 100,000 | 0.00 | 1,919 | 12.49 | |||
| 2025-08-14 | 13F | CastleKnight Management LP | 682,037 | 205.93 | 13,088 | 244.15 | ||||
| 2025-07-25 | 13F | Cwm, Llc | 180 | 0.00 | 0 | |||||
| 2025-08-14 | 13F/A | Barclays Plc | 4,378 | -65.19 | 0 | |||||
| 2025-08-14 | 13F | Citadel Advisors Llc | Call | 53,500 | -48.21 | 1,027 | -41.77 | |||
| 2025-08-14 | 13F | Citadel Advisors Llc | 84,362 | 49.55 | 1,619 | 68.19 | ||||
| 2025-08-14 | 13F | Citadel Advisors Llc | Put | 101,300 | 38.20 | 1,944 | 55.44 | |||
| 2025-08-13 | 13F | New York State Common Retirement Fund | 39,681 | 1 | ||||||
| 2025-08-13 | 13F | De Lisle Partners LLP | 16,338 | 0.00 | 313 | 12.59 | ||||
| 2025-08-12 | 13F | Jpmorgan Chase & Co | 35,000 | 672 | ||||||
| 2025-08-14 | 13F | Glenorchy Capital Ltd | 109,646 | -1.13 | 2,104 | 11.21 | ||||
| 2025-05-15 | 13F | Aquatic Capital Management LLC | 0 | -100.00 | 0 | |||||
| 2025-08-14 | 13F | Quarry LP | 1,503 | 29 | ||||||
| 2025-08-15 | 13F | Tower Research Capital LLC (TRC) | 0 | -100.00 | 0 | |||||
| 2025-08-13 | 13F | Russell Investments Group, Ltd. | 0 | -100.00 | 0 | |||||
| 2025-05-08 | 13F | Gsa Capital Partners Llp | 0 | -100.00 | 0 | |||||
| 2025-04-24 | NP | FNDA - Schwab Fundamental U.S. Small Company Index ETF This fund is a listed as child fund of Charles Schwab Investment Management Inc and if that institution has disclosed ownership in this security, then these positions will not be double counted when calculating total shares and total value | 43,418 | -49.48 | 690 | -55.80 | ||||
| 2025-06-27 | NP | EAEMX - Parametric Emerging Markets Fund Investor Class | 3,420 | 0.00 | 57 | -6.56 | ||||
| 2025-07-22 | 13F | IMC-Chicago, LLC | 16,228 | 311 | ||||||
| 2025-07-22 | 13F | IMC-Chicago, LLC | Put | 22,100 | 424 | |||||
| 2025-06-30 | NP | PRFZ - Invesco FTSE RAFI US 1500 Small-Mid ETF This fund is a listed as child fund of Invesco Ltd. and if that institution has disclosed ownership in this security, then these positions will not be double counted when calculating total shares and total value | 54,551 | -27.01 | 912 | -31.74 | ||||
| 2025-05-12 | 13F | Fmr Llc | 0 | -100.00 | 0 | |||||
| 2025-08-27 | 13F/A | Squarepoint Ops LLC | 13,654 | 10.13 | 262 | 24.17 | ||||
| 2025-08-13 | 13F | Hsbc Holdings Plc | 29,880 | 91.07 | 573 | 115.41 | ||||
| 2025-08-07 | 13F | Acadian Asset Management Llc | 101,410 | 2 | ||||||
| 2025-08-13 | 13F | EverSource Wealth Advisors, LLC | 1,311 | 312.26 | 25 | 400.00 | ||||
| 2025-08-14 | 13F | State Street Corp | 58,837 | 1.66 | 1,129 | 14.39 | ||||
| 2025-08-13 | 13F | Jump Financial, LLC | 124,223 | 693.15 | 2,384 | 792.51 | ||||
| 2025-08-14 | 13F | Susquehanna International Group, Llp | Put | 222,100 | -48.14 | 4,262 | -41.66 | |||
| 2025-08-18 | 13F/A | National Bank Of Canada /fi/ | 72 | 1 | ||||||
| 2025-08-14 | 13F | Susquehanna International Group, Llp | 106,993 | -68.34 | 2,053 | -64.39 | ||||
| 2025-08-14 | 13F | Bank Of America Corp /de/ | 142,998 | -62.43 | 2,744 | -57.73 | ||||
| 2025-08-14 | 13F | Susquehanna International Group, Llp | Call | 202,900 | 80.84 | 3,894 | 103.40 | |||
| 2025-08-14 | 13F | Main Street Financial Solutions, LLC | 394,464 | -14.16 | 7,570 | -3.44 | ||||
| 2025-08-06 | 13F | Moors & Cabot, Inc. | 18,770 | -82.00 | 360 | -79.76 | ||||
| 2025-08-13 | 13F | Invesco Ltd. | 36,517 | -36.36 | 701 | -28.43 | ||||
| 2025-08-14 | 13F | Wexford Capital Lp | 0 | -100.00 | 0 | |||||
| 2025-04-24 | NP | FNDB - Schwab Fundamental U.S. Broad Market Index ETF This fund is a listed as child fund of Charles Schwab Investment Management Inc and if that institution has disclosed ownership in this security, then these positions will not be double counted when calculating total shares and total value | 273 | -48.78 | 4 | -55.56 | ||||
| 2025-08-12 | 13F | MAI Capital Management | 1,580 | 0.00 | 30 | 15.38 | ||||
| 2025-08-07 | 13F | Allworth Financial LP | 94 | 176.47 | 2 | |||||
| 2025-08-05 | 13F | Simplex Trading, Llc | 0 | -100.00 | 0 | |||||
| 2025-07-29 | 13F | Commons Capital, Llc | 10,000 | 0.00 | 192 | 12.35 | ||||
| 2025-08-14 | 13F | Goldman Sachs Group Inc | 99,410 | -21.46 | 1,908 | -11.67 | ||||
| 2025-08-11 | 13F | Citigroup Inc | 1 | 0 | ||||||
| 2025-08-13 | 13F | Arrowstreet Capital, Limited Partnership | 858,986 | -5.05 | 16,484 | 6.80 | ||||
| 2025-08-14 | 13F | GWM Advisors LLC | 43 | 0.00 | 1 | |||||
| 2025-08-15 | 13F | Morgan Stanley | 416,551 | 31.78 | 7,994 | 48.24 | ||||
| 2025-05-09 | 13F | Charles Schwab Investment Management Inc | 0 | -100.00 | 0 | |||||
| 2025-08-14 | 13F | Group One Trading, L.p. | 60,582 | -26.86 | 1,163 | -17.76 | ||||
| 2025-09-04 | 13F/A | Advisor Group Holdings, Inc. | 7,821 | 9.58 | 150 | 23.97 | ||||
| 2025-08-14 | 13F | Smartleaf Asset Management LLC | 850 | 0.00 | 17 | 14.29 | ||||
| 2025-08-14 | 13F | Bnp Paribas Arbitrage, Sa | 0 | -100.00 | 0 | |||||
| 2025-08-14 | 13F | Group One Trading, L.p. | Put | 20,200 | 11.60 | 388 | 25.65 | |||
| 2025-08-14 | 13F | Nebula Research & Development LLC | 21,584 | -6.80 | 414 | 4.81 | ||||
| 2025-08-14 | 13F | Group One Trading, L.p. | Call | 28,600 | -66.39 | 549 | -62.23 | |||
| 2025-08-14 | 13F | Gratia Capital, Llc | 145,228 | 0.00 | 2,787 | 12.47 | ||||
| 2025-08-18 | 13F | Wolverine Trading, Llc | Call | 0 | -100.00 | 0 | ||||
| 2025-08-28 | NP | EWX - SPDR(R) S&P(R) EMERGING MARKETS SMALL CAP ETF | 16,875 | 0.00 | 324 | 12.54 | ||||
| 2025-08-08 | 13F | Larson Financial Group LLC | 63 | 0.00 | 1 | 0.00 | ||||
| 2025-08-14 | 13F | Royal Bank Of Canada | 19,871 | 382 | ||||||
| 2025-08-13 | 13F | Renaissance Technologies Llc | 560,045 | 56.88 | 10,747 | 76.47 | ||||
| 2025-08-26 | NP | BOAT - SonicShares Global Shipping ETF | 12,733 | 13.17 | 244 | 27.75 | ||||
| 2025-08-13 | 13F | Walleye Capital LLC | 15,408 | 296 | ||||||
| 2025-08-14 | 13F | Toroso Investments, LLC | 12,733 | 13.17 | 244 | 27.75 | ||||
| 2025-08-28 | NP | XCNY - SPDR S&P Emerging Markets ex-China ETF | 100 | 0.00 | 2 | 0.00 | ||||
| 2025-08-13 | 13F | Pale Fire Capital SE | 360,433 | 2.09 | 6,917 | 14.83 | ||||
| 2025-08-14 | 13F | Two Sigma Investments, Lp | 73,865 | -41.22 | 1,417 | -33.88 | ||||
| 2025-05-08 | 13F | XTX Topco Ltd | 0 | -100.00 | 0 | |||||
| 2025-07-15 | 13F | Public Employees Retirement System Of Ohio | 1,268 | 16.54 | 24 | 33.33 | ||||
| 2025-08-05 | 13F | Simplex Trading, Llc | Put | 31,400 | -8.99 | 1 | ||||
| 2025-08-05 | 13F | Simplex Trading, Llc | Call | 37,000 | -8.64 | 1 | ||||
| 2025-08-14 | 13F/A | Skopos Labs, Inc. | 73 | 1 | ||||||
| 2025-08-28 | NP | SPEM - SPDR(R) Portfolio Emerging Markets ETF | 39,366 | 1.98 | 755 | 14.74 | ||||
| 2025-05-09 | 13F | New Age Alpha Advisors, LLC | 0 | -100.00 | 0 | |||||
| 2025-05-15 | 13F | Vident Advisory, LLC | 0 | -100.00 | 0 | -100.00 | ||||
| 2025-05-28 | NP | VQNPX - Vanguard Growth and Income Fund Investor Shares This fund is a listed as child fund of Vanguard Group Inc and if that institution has disclosed ownership in this security, then these positions will not be double counted when calculating total shares and total value | 0 | -100.00 | 0 | -100.00 | ||||
| 2025-07-24 | 13F | Ronald Blue Trust, Inc. | 23 | 0.00 | 0 | |||||
| 2025-05-09 | 13F | R Squared Ltd | 0 | -100.00 | 0 | |||||
| 2025-07-14 | 13F | Counterpoint Mutual Funds LLC | 20,034 | 384 | ||||||
| 2025-08-12 | 13F | Steward Partners Investment Advisory, Llc | 2,000 | 0.00 | 38 | 11.76 | ||||
| 2025-05-15 | 13F | Marshall Wace, Llp | 0 | -100.00 | 0 | |||||
| 2025-05-15 | 13F | Voloridge Investment Management, Llc | 0 | -100.00 | 0 | |||||
| 2025-07-11 | 13F | Farther Finance Advisors, LLC | 114 | 0.00 | 2 | 100.00 | ||||
| 2025-08-08 | 13F | SBI Securities Co., Ltd. | 1,028 | 13.72 | 20 | 26.67 | ||||
| 2025-08-12 | 13F | BlackRock, Inc. | 324,906 | 58.04 | 6,235 | 77.76 | ||||
| 2025-08-14 | 13F | Two Sigma Advisers, Lp | 129,005 | -54.32 | 2,476 | -48.62 | ||||
| 2025-08-14 | 13F | Hrt Financial Lp | 40,859 | -28.51 | 1 |