Mga Batayang Estadistika
| Pemilik Institusional | 379 total, 379 long only, 0 short only, 0 long/short - change of 7.34% MRQ |
| Alokasi Portofolio Rata-rata | 0.3100 % - change of -1.22% MRQ |
| Saham Institusional (Jangka Panjang) | 19,810,091 (ex 13D/G) - change of 1.49MM shares 8.14% MRQ |
| Nilai Institusional (Jangka Panjang) | $ 1,227,375 USD ($1000) |
Kepemilikan Institusional dan Pemegang Saham
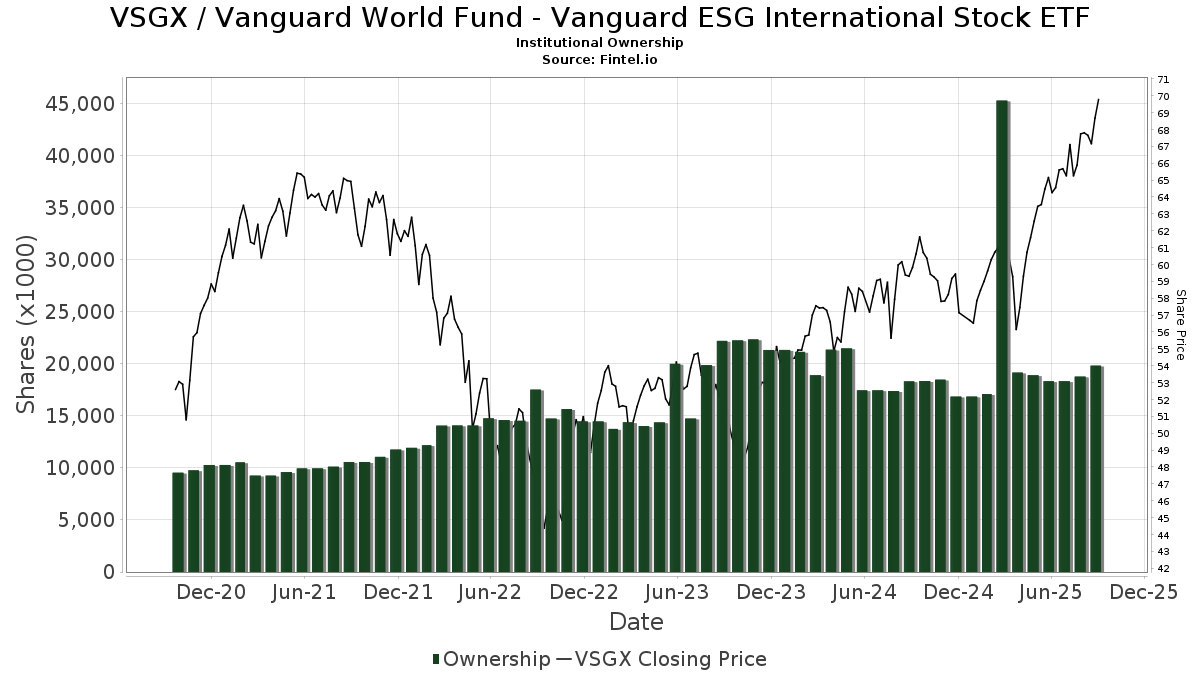
Vanguard World Fund - Vanguard ESG International Stock ETF (US:VSGX) memiliki 379 pemilik institusional dan pemegang saham yang telah mengajukan formulir 13D/G atau 13F kepada Komisi Bursa Efek (Securities Exchange Commission/SEC). Lembaga-lembaga ini memegang total 19,810,091 saham. Pemegang saham terbesar meliputi Vanguard Group Inc, Morgan Stanley, Creative Planning, Leo Wealth, LLC, Royal Bank Of Canada, SCS Capital Management LLC, Raymond James Financial Inc, Angeles Investment Advisors, LLC, Facet Wealth, Inc., and Sellwood Investment Partners LLC .
Struktur kepemilikan institusional Vanguard World Fund - Vanguard ESG International Stock ETF (BATS:VSGX) menunjukkan posisi terkini di perusahaan oleh institusi dan dana, serta perubahan terbaru dalam ukuran posisi. Pemegang saham utama dapat mencakup investor individu, reksa dana, dana lindung nilai, atau institusi. Jadwal 13D menunjukkan bahwa investor memegang (atau pernah memegang) lebih dari 5% saham perusahaan dan bermaksud (atau pernah bermaksud) untuk secara aktif mengejar perubahan strategi bisnis. Jadwal 13G menunjukkan investasi pasif lebih dari 5%.
The share price as of September 5, 2025 is 68.00 / share. Previously, on September 6, 2024, the share price was 58.54 / share. This represents an increase of 16.16% over that period.
Skor Sentimen Dana
Skor Sentimen Dana (sebelumnya dikenal sebagai Skor Akumulasi Kepemilikan) menemukan saham-saham yang paling banyak dibeli oleh dana. Ini adalah hasil dari model kuantitatif multi-faktor yang canggih yang mengidentifikasi perusahaan dengan tingkat akumulasi institusional tertinggi. Model penilaian menggunakan kombinasi dari total peningkatan pemilik yang diungkapkan, perubahan dalam alokasi portofolio pada pemilik tersebut, dan metrik lainnya. Angka berkisar dari 0 hingga 100, dengan angka yang lebih tinggi menunjukkan tingkat akumulasi yang lebih tinggi dibandingkan dengan perusahaan sejenisnya, dan 50 adalah rata-ratanya.
Frekuensi Pembaruan: Setiap Hari
Lihat Ownership Explorer, yang menyediakan daftar perusahaan dengan peringkat tertinggi.
Rasio Put/Call Institusional
Selain melaporkan isu ekuitas dan utang standar, institusi dengan aset di bawah manajemen lebih dari 100 juta dolar AS juga harus mengungkapkan kepemilikan opsi put dan call mereka. Karena opsi put umumnya menunjukkan sentimen negatif, dan opsi call menunjukkan sentimen positif, kita dapat mengetahui sentimen institusional secara keseluruhan dengan memplot rasio put terhadap call. Grafik di sebelah kanan memplot rasio put/call historis untuk instrumen ini.
Menggunakan Rasio Put/Call sebagai indikator sentimen investor mengatasi salah satu kekurangan utama dari penggunaan total kepemilikan institusional, yaitu sejumlah besar aset yang dikelola diinvestasikan secara pasif untuk melacak indeks. Dana yang dikelola secara pasif biasanya tidak membeli opsi, sehingga indikator rasio put/call lebih akurat dalam melacak sentimen dana yang dikelola secara aktif.

Pengajuan 13F dan NPORT
Detail pada pengajuan 13F tersedia gratis. Detail pada pengajuan NP memerlukan keanggotaan premium. Baris berwarna hijau menunjukkan posisi baru. Baris berwarna merah menunjukkan posisi yang sudah ditutup. Klik tautan ini ikon untuk melihat riwayat transaksi selengkapnya.
Tingkatkan
untuk membuka data premium dan mengekspor ke Excel ![]() .
.
| Tanggal File | Sumber | Investor | Ketik | Presyo ng Avg (Silangan) |
Saham | Δ Saham (%) |
Dilaporkan Nilai ($1000) |
Nilai Δ (%) |
Alokasi Port (%) |
|
|---|---|---|---|---|---|---|---|---|---|---|
| 2025-07-31 | 13F | Silver Oak Advisory Group, Inc. | 44,986 | 3.42 | 3 | 0.00 | ||||
| 2025-08-14 | 13F | Atomi Financial Group, Inc. | 8,731 | 0.00 | 572 | 11.09 | ||||
| 2025-07-15 | 13F | Bfsg, Llc | 41,322 | 4.29 | 2,707 | 15.84 | ||||
| 2025-08-07 | 13F | Davis R M Inc | 36,122 | 1.44 | 2,366 | 12.62 | ||||
| 2025-05-06 | 13F | Atria Investments Llc | 0 | -100.00 | 0 | |||||
| 2025-07-29 | 13F | Northeast Investment Management | 3,481 | 228 | ||||||
| 2025-08-05 | 13F | Marshall Financial Group Inc /adv | 28,519 | 1.36 | 1,868 | 12.54 | ||||
| 2025-07-23 | 13F | Equitable Trust Co | 4,517 | -2.19 | 296 | 8.46 | ||||
| 2025-08-06 | 13F | Round Rock Advisors, LLC | 9,405 | 0.00 | 616 | 11.19 | ||||
| 2025-08-13 | 13F | Argyle Capital Partners, LLC | 0 | -100.00 | 0 | |||||
| 2025-07-03 | 13F | Fiduciary Financial Group, Llc | 4,395 | -1.46 | 288 | 16.67 | ||||
| 2025-08-04 | 13F | One Day In July LLC | 8,779 | -7.84 | 575 | 2.50 | ||||
| 2025-08-07 | 13F | Pinnacle Wealth Management Advisory Group, LLC | 6,478 | -1.97 | 424 | 9.00 | ||||
| 2025-07-30 | 13F | Fingerlakes Wealth Management, Inc. | 3,336 | -3.83 | 218 | 6.86 | ||||
| 2025-08-08 | 13F | Ogorek Anthony Joseph /ny/ /adv | 153,683 | 185.78 | 10 | 233.33 | ||||
| 2025-08-08 | 13F | Firestone Capital Management | 3,713 | 243 | ||||||
| 2025-08-07 | 13F | Flagship Wealth Advisors, Llc | 370 | 0.00 | 24 | 14.29 | ||||
| 2025-07-23 | 13F | Bear Mountain Capital, Inc. | 43,107 | 2.81 | 2,819 | 10.85 | ||||
| 2025-08-13 | 13F | Jones Financial Companies Lllp | 101,409 | 10.69 | 6,620 | 21.94 | ||||
| 2025-05-12 | 13F | Independent Advisor Alliance | 0 | -100.00 | 0 | |||||
| 2025-08-14 | 13F | Raymond James Financial Inc | 365,833 | 7.24 | 23,962 | 19.10 | ||||
| 2025-07-01 | 13F | Harbor Investment Advisory, Llc | 1,275 | 0.00 | 84 | 10.67 | ||||
| 2025-07-16 | 13F | Newton One Investments LLC | 269 | 1.13 | 18 | 13.33 | ||||
| 2025-07-03 | 13F | Garde Capital, Inc. | 112,972 | 4.39 | 7,400 | 15.92 | ||||
| 2025-07-09 | 13F | Orser Capital Management, Llc | 36,470 | 2,389 | ||||||
| 2025-08-04 | 13F | Linscomb & Williams, Inc. | 7,186 | 10.78 | 471 | 23.04 | ||||
| 2025-08-14 | 13F | Integrated Wealth Concepts LLC | 13,632 | 120.33 | 893 | 145.05 | ||||
| 2025-07-29 | 13F | Chicago Partners Investment Group LLC | 17,883 | 0.57 | 1,200 | 9.50 | ||||
| 2025-08-01 | 13F | Clark Asset Management, LLC | 4,926 | 0.00 | 323 | 11.03 | ||||
| 2025-08-14 | 13F | Mariner, LLC | 144,380 | 8.18 | 9,457 | 20.14 | ||||
| 2025-09-04 | 13F/A | Advisor Group Holdings, Inc. | 36,072 | -27.87 | 2,363 | -19.90 | ||||
| 2025-08-12 | 13F | Martin Worley Group | 38,239 | -22.31 | 2,505 | -13.71 | ||||
| 2025-08-14 | 13F | Dagco, Inc. | 428 | 0.94 | 28 | 12.00 | ||||
| 2025-07-30 | 13F | Rehmann Capital Advisory Group | 3,283 | 215 | ||||||
| 2025-08-11 | 13F | Pinnacle Financial Group, LLC / IL | 4,417 | -2.58 | 289 | 8.24 | ||||
| 2025-07-28 | 13F | Harbour Investments, Inc. | 17,860 | 2.18 | 1,170 | 13.50 | ||||
| 2025-08-05 | 13F | Bank Of Montreal /can/ | 7,044 | 15.53 | 461 | 28.41 | ||||
| 2025-07-17 | 13F | Alpine Bank Wealth Management | 1,262 | 0.00 | 83 | 10.81 | ||||
| 2025-08-14 | 13F | Oxford Financial Group Ltd | 1,635 | 1.36 | 107 | 12.63 | ||||
| 2025-08-20 | 13F/A | Thompson Davis & Co., Inc. | 9,236 | 6.95 | 605 | 18.66 | ||||
| 2025-07-25 | 13F | Wells Financial Advisors INC | 500 | 0.00 | 33 | 10.34 | ||||
| 2025-07-15 | 13F | Patriot Investment Management Inc. | 6,936 | 5.68 | 454 | 17.31 | ||||
| 2025-08-12 | 13F | Archer Investment Corp | 872 | 0.00 | 57 | 11.76 | ||||
| 2025-07-28 | 13F | Cutler Investment Counsel Llc | 6,723 | -3.94 | 440 | 6.80 | ||||
| 2025-07-22 | 13F | Wealthcare Capital Management Llc | 11,635 | -7.76 | 762 | 2.56 | ||||
| 2025-08-14 | 13F | Cardiff Park Advisors, Llc | 2,074 | 1.82 | 136 | 12.50 | ||||
| 2025-08-14 | 13F | Mercer Global Advisors Inc /adv | 22,636 | 101.69 | 1,483 | 124.21 | ||||
| 2025-08-07 | 13F | McClarren Financial Advisors, Inc. | 14,473 | 12.56 | 948 | |||||
| 2025-08-15 | 13F | North Ridge Wealth Advisors, Inc. | 118 | 8 | ||||||
| 2025-07-17 | 13F | Nelson, Van Denburg & Campbell Wealth Management Group, LLC | 0 | -100.00 | 0 | |||||
| 2025-08-14 | 13F | Cambridge Associates Llc /ma/ /adv | 20,232 | -73.44 | 1,325 | -70.51 | ||||
| 2025-07-21 | 13F | Sageworth Trust Co | 26,008 | -3.75 | 1,704 | 6.91 | ||||
| 2025-07-31 | 13F | Curio Wealth, Llc | 25 | 2,400.00 | 2 | 0.00 | ||||
| 2025-05-13 | 13F | Heck Capital Advisors, LLC | 0 | -100.00 | 0 | -100.00 | ||||
| 2025-08-13 | 13F | SageView Advisory Group, LLC | 119,042 | 4.75 | 7,840 | 16.98 | ||||
| 2025-08-13 | 13F | Northern Trust Corp | 34,974 | 0.00 | 2,291 | 11.06 | ||||
| 2025-07-11 | 13F | Westfuller Advisors, LLC | 127,552 | 0.38 | 8,355 | 11.48 | ||||
| 2025-07-15 | 13F | Charter Capital Management, LLC\DE | 3,280 | 215 | ||||||
| 2025-07-25 | 13F | NorthRock Partners, LLC | 41 | 2.50 | 3 | 0.00 | ||||
| 2025-08-04 | 13F | Roble, Belko & Company, Inc | 499 | -1.96 | 0 | |||||
| 2025-08-11 | 13F | Diversified Portfolios, Inc. | 127,112 | -0.57 | 8,326 | 10.43 | ||||
| 2025-07-31 | 13F | Fiduciary Wealth Partners, LLC | 16,820 | 1,102 | ||||||
| 2025-08-05 | 13F | American Capital Advisory, LLC | 308 | 0.33 | 20 | 11.11 | ||||
| 2025-07-24 | 13F | JNBA Financial Advisors | 18,335 | -16.12 | 1,201 | -6.90 | ||||
| 2025-05-15 | 13F | Wealth Management Strategies, Inc. | 3,800 | 4.54 | 224 | 11,100.00 | ||||
| 2025-08-01 | 13F | Liberty Wealth Management Llc | 5,677 | 372 | ||||||
| 2025-08-11 | 13F | Copperleaf Capital, LLC | 5,758 | 0.00 | 377 | 11.21 | ||||
| 2025-08-04 | 13F | Simon Quick Advisors, Llc | 7,928 | 519 | ||||||
| 2025-08-15 | 13F | WealthCollab, LLC | 16,539 | 0.00 | 1,083 | 11.08 | ||||
| 2025-08-01 | 13F | Ferguson Shapiro LLC | 5,951 | 0.00 | 390 | 11.14 | ||||
| 2025-08-04 | 13F | Spinnaker Trust | 182,548 | -2.72 | 11,957 | 8.03 | ||||
| 2025-07-30 | 13F | Nottingham Advisors, Inc. | 6,350 | -37.75 | 416 | -30.95 | ||||
| 2025-07-10 | 13F | Wedmont Private Capital | 15,634 | 1.65 | 1,027 | 17.26 | ||||
| 2025-08-11 | 13F | Anb Bank | 10,467 | 1.61 | 686 | 12.85 | ||||
| 2025-08-01 | 13F | Rossby Financial, LCC | 0 | -100.00 | 0 | |||||
| 2025-07-25 | 13F | Pathway Financial Advisors LLC | 8,043 | 0.00 | 527 | 10.97 | ||||
| 2025-08-11 | 13F | VSM Wealth Advisory, LLC | 2,956 | 0.96 | 194 | 12.21 | ||||
| 2025-07-11 | 13F | Pinnacle Bancorp, Inc. | 2,864 | 0.99 | 188 | 11.98 | ||||
| 2025-08-11 | 13F | CBIZ Investment Advisory Services, LLC | 68 | -8.11 | 4 | 0.00 | ||||
| 2025-08-14 | 13F | Mml Investors Services, Llc | 91,378 | -2.51 | 6 | 0.00 | ||||
| 2025-08-06 | 13F | Adviser Investments LLC | 4,097 | 0.00 | 268 | 11.20 | ||||
| 2025-08-11 | 13F | Amara Financial, Llc. | 15,866 | -0.94 | 1,039 | 10.06 | ||||
| 2025-08-05 | 13F | Dunhill Financial, LLC | 1,661 | 51.83 | 109 | 68.75 | ||||
| 2025-08-08 | 13F | Financial Gravity Companies, Inc. | 2,159 | -0.42 | 141 | 15.57 | ||||
| 2025-08-14 | 13F | Partners Capital Investment Group, Llp | 0 | -100.00 | 0 | |||||
| 2025-08-12 | 13F | CIBC Private Wealth Group, LLC | 230 | 0.00 | 15 | 25.00 | ||||
| 2025-08-13 | 13F | Russell Investments Group, Ltd. | 163 | 0.00 | 11 | 11.11 | ||||
| 2025-07-08 | 13F | Nbc Securities, Inc. | 193 | 0.00 | 0 | |||||
| 2025-07-17 | 13F | Janney Montgomery Scott LLC | 7,651 | 78.39 | 1 | |||||
| 2025-07-25 | 13F | Northwest Capital Management Inc | 0 | -100.00 | 0 | |||||
| 2025-08-14 | 13F | Ameriprise Financial Inc | 214,922 | -0.84 | 14,048 | 9.90 | ||||
| 2025-08-15 | 13F | Koesten, Hirschmann & Crabtree, INC. | 0 | -100.00 | 0 | |||||
| 2025-07-09 | 13F | Affinity Capital Advisors, LLC | 4,357 | -3.61 | 285 | 10.89 | ||||
| 2025-08-07 | 13F | Allworth Financial LP | 29,295 | -5.89 | 1,919 | 2.62 | ||||
| 2025-05-15 | 13F | Minot DeBlois Advisors LLC | 0 | -100.00 | 0 | |||||
| 2025-07-14 | 13F | Abound Wealth Management | 2,026 | 0.35 | 133 | 10.92 | ||||
| 2025-07-29 | 13F | BKD Wealth Advisors, LLC | 4,300 | 0.00 | 282 | 11.07 | ||||
| 2025-04-22 | 13F | Synergy Financial Management, LLC | 0 | -100.00 | 0 | |||||
| 2025-08-01 | 13F | Zhang Financial LLC | 3,352 | 220 | ||||||
| 2025-08-11 | 13F | Strategic Wealth Partners, Ltd. | 822 | 54 | ||||||
| 2025-08-14 | 13F | Peapack Gladstone Financial Corp | 10,950 | 9.50 | 1 | |||||
| 2025-08-01 | 13F | Red Lighthouse Investment Management, Llc | 1,590 | 0.00 | 104 | 14.29 | ||||
| 2025-07-24 | 13F | PDS Planning, Inc | 2,717 | -0.59 | 178 | 9.94 | ||||
| 2025-07-23 | 13F | Dohj, Llc | 0 | -100.00 | 0 | |||||
| 2025-08-06 | 13F | Financial Alternatives, Inc | 0 | -100.00 | 0 | |||||
| 2025-08-12 | 13F | Ameritas Investment Partners, Inc. | 9,823 | -0.43 | 643 | 10.67 | ||||
| 2025-08-15 | 13F | WFA of San Diego, LLC | 1,047 | 0.00 | 69 | 6.25 | ||||
| 2025-05-08 | 13F | Essential Planning, LLC. | 0 | -100.00 | 0 | |||||
| 2025-08-08 | 13F | Hartland & Co., LLC | 5,190 | 0.00 | 340 | 10.78 | ||||
| 2025-08-12 | 13F | Twin Focus Capital Partners, Llc | 70,807 | 34.83 | 4,638 | 49.73 | ||||
| 2025-08-13 | 13F | Cresset Asset Management, LLC | 35,753 | 0.81 | 2,342 | 11.96 | ||||
| 2025-08-14 | 13F | Sunbelt Securities, Inc. | 0 | -100.00 | 0 | |||||
| 2025-08-18 | 13F/A | National Bank Of Canada /fi/ | 4,535 | 10.96 | 297 | 23.24 | ||||
| 2025-08-05 | 13F | Mission Wealth Management, Lp | 150,935 | 25.38 | 9,886 | 39.24 | ||||
| 2025-07-30 | 13F | White Lighthouse Investment Management Inc. | 81,185 | -2.47 | 5,318 | 8.31 | ||||
| 2025-08-13 | 13F | Parkworth Wealth Management, Inc. | 4,873 | 170.57 | 319 | 200.94 | ||||
| 2025-07-17 | 13F | Symmetry Partners, LLC | 6,629 | -17.99 | 434 | -8.82 | ||||
| 2025-08-05 | 13F | Gilbert & Cook, Inc. | 7,081 | 0.00 | 464 | 11.03 | ||||
| 2025-07-17 | 13F | Elwood & Goetz Wealth Advisory Group, LLC | 5,969 | -25.78 | 391 | -17.72 | ||||
| 2025-07-25 | 13F | Envestnet Portfolio Solutions, Inc. | 3,352 | 220 | ||||||
| 2025-07-15 | 13F | Farrell Financial LLC | 81,715 | 1.19 | 5,352 | 12.39 | ||||
| 2025-07-18 | 13F | First United Bank Trust/ | 2,791 | -20.55 | 183 | -12.08 | ||||
| 2025-08-14 | 13F | Goldman Sachs Group Inc | 112,664 | 0.14 | 7,379 | 11.21 | ||||
| 2025-08-13 | 13F | KilterHowling LLC | 5,406 | 0.73 | 354 | 7.93 | ||||
| 2025-08-14 | 13F | Jane Street Group, Llc | 30,136 | -81.96 | 1,974 | -79.97 | ||||
| 2025-08-12 | 13F | YANKCOM Partnership | 1,284 | 0.00 | 84 | 12.00 | ||||
| 2025-08-14 | 13F | DHK Financial Advisors, Inc. | 8,827 | 0.98 | 578 | 12.23 | ||||
| 2025-07-31 | 13F | Sentinel Trust Co Lba | 28,227 | -2.47 | 2 | 0.00 | ||||
| 2025-07-29 | 13F | Private Trust Co Na | 350 | 0.00 | 23 | 10.00 | ||||
| 2025-07-02 | 13F | Boston Standard Wealth Management, LLC | 39,331 | 8.75 | 2,576 | 24.38 | ||||
| 2025-07-21 | 13F | Financial Council Asset Management Inc | 17,941 | -0.33 | 1,175 | 10.74 | ||||
| 2025-07-25 | 13F | Stonehage Fleming Financial Services Holdings Ltd | 3,113 | 2.20 | 204 | 13.41 | ||||
| 2025-07-09 | 13F | Pallas Capital Advisors LLC | 0 | -100.00 | 0 | |||||
| 2025-07-16 | 13F | Paragon Capital Management Ltd | 17,174 | 1,125 | ||||||
| 2025-08-14 | 13F | Destination Wealth Management | 10,322 | 0.00 | 676 | 11.18 | ||||
| 2025-08-05 | 13F | Gould Asset Management Llc /ca/ | 32,606 | -1.42 | 2,136 | 9.49 | ||||
| 2025-08-13 | 13F/A | StoneX Group Inc. | 0 | -100.00 | 0 | -100.00 | ||||
| 2025-08-14 | 13F | Stifel Financial Corp | 11,973 | 73.20 | 784 | 92.63 | ||||
| 2025-07-09 | 13F | O'Brien Wealth Partners LLC | 91,966 | 6,024 | ||||||
| 2025-07-22 | 13F | Ervin Investment Management, LLC | 3,668 | 240 | ||||||
| 2025-08-14 | 13F | Freedom Financial Partners LLC | 4,683 | 34.57 | 307 | 49.27 | ||||
| 2025-07-14 | 13F | Northland Capital Management LLC | 21,551 | 8.63 | 1,412 | 20.60 | ||||
| 2025-08-12 | 13F | Choate Investment Advisors | 151 | 10 | ||||||
| 2025-04-24 | 13F | Wingate Wealth Advisors, Inc. | 0 | -100.00 | 0 | |||||
| 2025-07-16 | 13F | Perigon Wealth Management, LLC | 21,093 | 0.00 | 1,382 | 11.01 | ||||
| 2025-08-14 | 13F | Fiduciary Trust Co | 139,283 | -0.75 | 9,123 | 10.22 | ||||
| 2025-08-08 | 13F | Advyzon Investment Management, LLC | 5,222 | 7.01 | 342 | 19.16 | ||||
| 2025-08-12 | 13F | MAI Capital Management | 209 | 40.27 | 14 | 62.50 | ||||
| 2025-08-11 | 13F | Aptus Capital Advisors, LLC | 1,877 | 2.79 | 123 | 14.02 | ||||
| 2025-04-15 | 13F | Corrigan Financial, Inc. | 16,239 | -2.03 | 958 | 1.92 | ||||
| 2025-07-21 | 13F | Quent Capital, LLC | 81,304 | 1.13 | 5,325 | 12.32 | ||||
| 2025-07-23 | 13F | Values Added Financial LLC | 11,790 | -20.57 | 772 | -11.77 | ||||
| 2025-07-17 | 13F | Halbert Hargrove Global Advisors, Llc | 3,375 | -3.10 | 221 | 7.80 | ||||
| 2025-07-14 | 13F | Cherrydale Wealth Management, Llc | 6,188 | 0.08 | 405 | 11.26 | ||||
| 2025-07-24 | 13F | Us Bancorp \de\ | 43,609 | 334.05 | 2,856 | 382.43 | ||||
| 2025-07-18 | 13F | Pure Financial Advisors, Inc. | 9,914 | -4.20 | 649 | 6.39 | ||||
| 2025-07-10 | 13F | Focus Financial Network, Inc. | 3,638 | -1.91 | 238 | 9.17 | ||||
| 2025-07-25 | 13F | Quantum Financial Planning Services, Inc. | 4,322 | -6.19 | 283 | 4.43 | ||||
| 2025-07-15 | 13F | Ballentine Partners, LLC | 19,108 | 0.00 | 1,252 | 11.10 | ||||
| 2025-08-07 | 13F | Meridian Financial Partners LLC | 9,070 | 15.23 | 1 | |||||
| 2025-08-12 | 13F | Passive Capital Management, LLC. | 6,271 | -0.48 | 411 | 10.51 | ||||
| 2025-08-26 | 13F/A | Thrivent Financial For Lutherans | 8,397 | 1 | ||||||
| 2025-08-06 | 13F | Csenge Advisory Group | 3,234 | 206 | ||||||
| 2025-04-09 | 13F | Quantum Financial Advisors, LLC | 0 | -100.00 | 0 | |||||
| 2025-07-28 | 13F | BRYN MAWR TRUST Co | 11,092 | 0.00 | 727 | 11.01 | ||||
| 2025-08-14 | 13F | Qube Research & Technologies Ltd | 0 | -100.00 | 0 | |||||
| 2025-08-11 | 13F | NewEdge Wealth, LLC | 10,987 | 7.80 | 730 | 21.30 | ||||
| 2025-07-18 | 13F | First Pacific Financial | 5,948 | 390 | ||||||
| 2025-08-01 | 13F | Facet Wealth, Inc. | 301,167 | 2.59 | 19,513 | 6.76 | ||||
| 2025-05-05 | 13F | Lindbrook Capital, Llc | 5,472 | 0.00 | 323 | 3.87 | ||||
| 2025-08-04 | 13F | AMG National Trust Bank | 54,139 | -7.36 | 3,546 | 2.90 | ||||
| 2025-07-21 | 13F | Sageworth Trust Co of South Dakota | 12,710 | 0.00 | 833 | 11.08 | ||||
| 2025-08-14 | 13F | Glen Eagle Advisors, LLC | 2,793 | -1.79 | 183 | 8.98 | ||||
| 2025-08-12 | 13F | BlackRock, Inc. | 1,497 | 954.23 | 98 | 1,125.00 | ||||
| 2025-08-14 | 13F | Colony Group, LLC | 73,791 | -1.84 | 4,833 | 9.02 | ||||
| 2025-08-15 | 13F | Cornerstone Financial Group, LLC /NE/ | 12,541 | 0.99 | 821 | 5.94 | ||||
| 2025-07-25 | 13F | Cwm, Llc | 11,706 | 0.61 | 1 | |||||
| 2025-08-14 | 13F | Fmr Llc | 17,356 | -3.90 | 1,137 | 6.67 | ||||
| 2025-07-28 | 13F | Capital Management Corp /va | 3,437 | 0.00 | 225 | 11.39 | ||||
| 2025-08-15 | 13F | Equitable Holdings, Inc. | 4,366 | 16.77 | 286 | 29.55 | ||||
| 2025-08-12 | 13F | Coldstream Capital Management Inc | 0 | -100.00 | 0 | |||||
| 2025-07-25 | 13F | Joel Adams & Associates, Inc. | 142,037 | -8.20 | 9,303 | 1.95 | ||||
| 2025-08-14 | 13F | Royal Bank Of Canada | 555,459 | 4.93 | 36,383 | 16.53 | ||||
| 2025-08-05 | 13F | Huntington National Bank | 0 | |||||||
| 2025-08-04 | 13F | HBK Sorce Advisory LLC | 5,688 | 8.28 | 373 | 20.39 | ||||
| 2025-08-15 | 13F | CI Private Wealth, LLC | 102,660 | 152.34 | 6,724 | 180.28 | ||||
| 2025-08-13 | 13F | VestGen Advisors, LLC | 15,862 | -5.13 | 1,038 | 5.17 | ||||
| 2025-07-17 | 13F | LexAurum Advisors, LLC | 0 | -100.00 | 0 | |||||
| 2025-08-11 | 13F | Private Advisor Group, LLC | 7,726 | -1.88 | 506 | 9.05 | ||||
| 2025-08-07 | 13F | Topel & Distasi Wealth Management, LLC | 23,692 | 4.45 | 1,552 | 16.01 | ||||
| 2025-08-12 | 13F | Cornerstone Wealth Management, LLC | 8,019 | -15.62 | 525 | -6.25 | ||||
| 2025-08-14 | 13F | Betterment LLC | 19,427 | -35.97 | 1 | 0.00 | ||||
| 2025-08-14 | 13F | Federation des caisses Desjardins du Quebec | 1,504 | 0.00 | 99 | 11.36 | ||||
| 2025-08-14 | 13F | Hurley Capital, LLC | 950 | 0.21 | 62 | 12.73 | ||||
| 2025-05-15 | 13F | CAPROCK Group, Inc. | 18,204 | 1.89 | 1,074 | 5.92 | ||||
| 2025-08-06 | 13F | AE Wealth Management LLC | 65 | 0.00 | 4 | 33.33 | ||||
| 2025-04-30 | 13F | Sofos Investments, Inc. | 2,162 | -52.40 | 128 | -51.15 | ||||
| 2025-07-24 | 13F | Robertson Stephens Wealth Management, LLC | 6,315 | 0.00 | 414 | 11.02 | ||||
| 2025-07-11 | 13F/A | Umb Bank N A/mo | 20,420 | 0.00 | 1,338 | 11.05 | ||||
| 2025-07-08 | 13F | Apella Capital, LLC | 92,933 | -8.41 | 6,036 | 5.95 | ||||
| 2025-08-13 | 13F | Rsm Us Wealth Management Llc | 17,079 | -14.64 | 1,119 | -5.25 | ||||
| 2025-04-22 | 13F | MBE Wealth Management, LLC | 0 | -100.00 | 0 | -100.00 | ||||
| 2025-07-21 | 13F | Empirical Financial Services, LLC d.b.a. Empirical Wealth Management | 75,283 | 3.79 | 4,931 | 15.26 | ||||
| 2025-08-14 | 13F | Bragg Financial Advisors, Inc | 6,835 | 4.91 | 448 | 16.41 | ||||
| 2025-08-14 | 13F | Fairview Capital Investment Management, Llc | 4,550 | 2.25 | 298 | 13.74 | ||||
| 2025-08-13 | 13F | Transce3nd, LLC | 161 | 11 | ||||||
| 2025-08-14 | 13F | Wiley Bros.-aintree Capital, Llc | 12,482 | 22.41 | 818 | 35.26 | ||||
| 2025-08-14 | 13F | McIlrath & Eck, LLC | 110 | 0.00 | 7 | 16.67 | ||||
| 2025-07-30 | 13F | Fairway Wealth LLC | 213 | 0.95 | 14 | 8.33 | ||||
| 2025-07-31 | 13F | Resonant Capital Advisors, LLC | 5,151 | 0.00 | 337 | 11.22 | ||||
| 2025-07-24 | 13F | Jfs Wealth Advisors, Llc | 867 | 0.00 | 57 | 9.80 | ||||
| 2025-08-14 | 13F | Glenmede Investment Management, LP | 7,719 | 506 | ||||||
| 2025-07-18 | 13F | Martel Wealth Advisors Inc | 4,354 | 0.00 | 285 | 11.33 | ||||
| 2025-05-14 | 13F | Oarsman Capital, Inc. | 0 | -100.00 | 0 | |||||
| 2025-07-08 | 13F | Parallel Advisors, LLC | 12,775 | -2.48 | 837 | 8.29 | ||||
| 2025-08-07 | 13F | Evoke Wealth, Llc | 86,334 | 0.12 | 5,655 | 11.19 | ||||
| 2025-07-15 | 13F | Mather Group, Llc. | 11,996 | -1.15 | 786 | 9.79 | ||||
| 2025-08-11 | 13F | Morling Financial Advisors, LLC | 0 | -100.00 | 0 | -100.00 | ||||
| 2025-08-05 | 13F | Carson Advisory Inc. | 3,700 | -7.50 | 242 | 2.98 | ||||
| 2025-08-08 | 13F | Fortis Group Advisors, LLC | 644 | 0.00 | 42 | 13.51 | ||||
| 2025-08-18 | 13F | Geneos Wealth Management Inc. | 17,630 | 52.35 | 1,155 | 69.21 | ||||
| 2025-07-24 | 13F | Rice Partnership, LLC | 20 | 5.26 | 1 | 0.00 | ||||
| 2025-05-14 | 13F | Van Hulzen Asset Management, LLC | 0 | -100.00 | 0 | -100.00 | ||||
| 2025-08-12 | 13F | LPL Financial LLC | 118,257 | 1.32 | 7,746 | 12.52 | ||||
| 2025-08-04 | 13F | Savvy Advisors, Inc. | 7,756 | -13.49 | 508 | -3.79 | ||||
| 2025-07-09 | 13F | Dynamic Advisor Solutions LLC | 8,921 | 0.00 | 584 | 11.03 | ||||
| 2025-08-13 | 13F | Beacon Pointe Advisors, LLC | 105,749 | -1.02 | 6,927 | 9.92 | ||||
| 2025-04-17 | 13F | Rs Crum Inc. | 6,325 | 0.00 | 373 | 4.19 | ||||
| 2025-08-08 | 13F | Truepoint, Inc. | 12,485 | 0.00 | 818 | 11.01 | ||||
| 2025-08-06 | 13F | Zevin Asset Management Llc | 3,098 | 0 | ||||||
| 2025-08-08 | 13F | Laurel Wealth Planning LLC | 3,744 | -4.12 | 245 | 6.52 | ||||
| 2025-05-09 | 13F | Atria Wealth Solutions, Inc. | 0 | -100.00 | 0 | |||||
| 2025-07-15 | 13F | Level Financial Advisors, Inc. | 4,612 | 0.00 | 302 | 11.44 | ||||
| 2025-07-31 | 13F | Wealthfront Advisers Llc | 31,308 | 4.21 | 2,051 | 15.75 | ||||
| 2025-07-30 | 13F | D.a. Davidson & Co. | 6,769 | 7.98 | 443 | 20.05 | ||||
| 2025-07-24 | 13F | Financial Connections Group, Inc. | 100,429 | 0.50 | 7 | 20.00 | ||||
| 2025-08-13 | 13F | Allegheny Financial Group LTD | 3,244 | -7.92 | 213 | 2.42 | ||||
| 2025-08-06 | 13F | Modera Wealth Management, LLC | 10,237 | -1.41 | 671 | 9.48 | ||||
| 2025-08-11 | 13F | Citigroup Inc | 900 | 78.93 | 59 | 100.00 | ||||
| 2025-08-07 | 13F | Fund Evaluation Group, LLC | 72,073 | 23.29 | 4,721 | 36.93 | ||||
| 2025-07-10 | 13F | Stewardship Advisors, LLC | 158,314 | -2.40 | 10,370 | 8.38 | ||||
| 2025-08-06 | 13F | Longview Financial Advisors LLC | 1,419 | -0.49 | 93 | 9.52 | ||||
| 2025-07-28 | 13F | IFG Advisors, LLC | 6,424 | -4.89 | 421 | 5.53 | ||||
| 2025-07-14 | 13F | Painted Porch Advisors LLC | 1,430 | -10.06 | 94 | 0.00 | ||||
| 2025-08-08 | 13F | Brickley Wealth Management | 7,584 | -0.01 | 497 | 10.96 | ||||
| 2025-07-14 | 13F | CJM Wealth Advisers, Ltd. | 6,305 | 59.38 | 413 | 76.82 | ||||
| 2025-08-12 | 13F | Steward Partners Investment Advisory, Llc | 3,423 | 0.26 | 224 | 11.44 | ||||
| 2025-08-07 | 13F | Midwest Trust Co | 7,050 | 462 | ||||||
| 2025-07-10 | 13F | Orgel Wealth Management, LLC | 82,556 | -9.55 | 5,407 | 0.45 | ||||
| 2025-07-31 | 13F | Buckingham Strategic Partners | 5,564 | 18.36 | 364 | 31.41 | ||||
| 2025-07-11 | 13F | Farther Finance Advisors, LLC | 6,224 | 14.86 | 408 | 27.19 | ||||
| 2025-08-07 | 13F | Brio Consultants, LLC | 3,331 | -32.91 | 218 | -25.34 | ||||
| 2025-07-17 | 13F | Hanson & Doremus Investment Management | 234,285 | 1.39 | 15 | 15.38 | ||||
| 2025-08-14 | 13F | Rock Point Advisors, LLC | 10,700 | 0.00 | 701 | 10.94 | ||||
| 2025-07-21 | 13F | 25 Llc | 4,077 | 267 | ||||||
| 2025-08-15 | 13F | Morgan Stanley | 1,506,060 | 273.55 | 98,647 | 314.85 | ||||
| 2025-04-29 | 13F | Financial Network Wealth Management LLC | 35,191 | -0.31 | 2 | 0.00 | ||||
| 2025-07-11 | 13F | Capital Advantage, Inc. | 11,545 | 5.25 | 756 | 21.74 | ||||
| 2025-07-18 | 13F | Trust Co Of Vermont | 641 | 42 | ||||||
| 2025-07-28 | 13F | Boston Trust Walden Corp | 262,144 | 11.14 | 17,170 | 23.42 | ||||
| 2025-08-07 | 13F | Addison Advisors LLC | 20,227 | -23.82 | 1,325 | -15.40 | ||||
| 2025-08-08 | 13F | Empower Advisory Group, LLC | 7,640 | -1.98 | 500 | 8.93 | ||||
| 2025-08-05 | 13F | GPS Wealth Strategies Group, LLC | 539 | 0.75 | 35 | 12.90 | ||||
| 2025-07-10 | 13F | Wealth Enhancement Advisory Services, Llc | 43,486 | -11.57 | 2,865 | -1.24 | ||||
| 2025-08-01 | 13F | Financial Counselors Inc | 0 | -100.00 | 0 | |||||
| 2025-08-11 | 13F | Angeles Investment Advisors, LLC | 302,740 | 32.54 | 19,829 | 47.20 | ||||
| 2025-07-17 | 13F | LifeGuide Financial Advisors, LLC | 190,339 | 1.34 | 12,467 | 12.54 | ||||
| 2025-08-05 | 13F | Cherry Tree Wealth Management, LLC | 5,136 | 0.00 | 336 | 11.26 | ||||
| 2025-07-17 | 13F | Keystone Global Partners, LLC | 903 | 11.34 | 59 | 25.53 | ||||
| 2025-08-15 | 13F | Urban Financial Advisory Corp | 1,719 | 1.06 | 113 | 12.00 | ||||
| 2025-07-23 | 13F | Optas, LLC | 14,189 | 0.00 | 929 | 11.12 | ||||
| 2025-08-14 | 13F | Balanced Rock Investment Advisor | 47,413 | -3.83 | 3,106 | 6.81 | ||||
| 2025-08-04 | 13F | Human Investing LLC | 78,660 | -0.51 | 5,144 | 10.32 | ||||
| 2025-08-06 | 13F | Savant Capital, LLC | 16,432 | 1,076 | ||||||
| 2025-07-25 | 13F | Gordian Advisors LLC | 4,160 | 6.39 | 272 | 18.26 | ||||
| 2025-08-13 | 13F | Farnam Financial LLC | 8,157 | 114.66 | 534 | 138.39 | ||||
| 2025-08-19 | 13F | Asset Dedication, LLC | 5,055 | 5.60 | 331 | 17.38 | ||||
| 2025-07-23 | 13F | Sax Wealth Advisors, Llc | 7,111 | 0.00 | 466 | 10.98 | ||||
| 2025-08-14 | 13F | GWM Advisors LLC | 16,899 | 2.00 | 1,107 | 13.20 | ||||
| 2025-07-15 | 13F | Garrett Investment Advisors LLC | 30,136 | -26.49 | 1,974 | -18.37 | ||||
| 2025-08-01 | 13F | Envestnet Asset Management Inc | 161,553 | 0.42 | 10,582 | 11.52 | ||||
| 2025-08-18 | 13F | N.E.W. Advisory Services LLC | 466 | -79.54 | 31 | -77.61 | ||||
| 2025-08-05 | 13F | Bank of New York Mellon Corp | 54,022 | 38.29 | 3,538 | 53.63 | ||||
| 2025-05-13 | 13F | EverSource Wealth Advisors, LLC | 0 | -100.00 | 0 | |||||
| 2025-07-22 | 13F | Global Strategic Investment Solutions, LLC | 22,824 | 0.25 | 1,495 | 11.33 | ||||
| 2025-08-14 | 13F | Wells Fargo & Company/mn | 10,107 | 1,210.89 | 662 | 1,371.11 | ||||
| 2025-05-16 | 13F | Stance Capital Llc | 0 | -100.00 | 0 | |||||
| 2025-08-12 | 13F | Wood Tarver Financial Group, LLC | 1,718 | 0.00 | 0 | -100.00 | ||||
| 2025-07-15 | 13F | Well Done, LLC | 15,029 | 13.00 | 984 | 30.50 | ||||
| 2025-07-09 | 13F | Sapient Capital Llc | 18,531 | 0.00 | 1,214 | 11.08 | ||||
| 2025-08-05 | 13F | Ellevest, Inc. | 3,804 | 3.29 | 249 | 14.75 | ||||
| 2025-08-06 | 13F | Commonwealth Equity Services, Llc | 51,914 | -30.70 | 3 | -25.00 | ||||
| 2025-08-14 | 13F | Wetherby Asset Management Inc | 3,392 | -15.96 | 222 | -2.63 | ||||
| 2025-08-04 | 13F | Bristlecone Advisors, LLC | 1,499 | 0.00 | 98 | 11.36 | ||||
| 2025-05-13 | 13F | Dundas Partners LLP | 0 | -100.00 | 0 | |||||
| 2025-08-12 | 13F | Pathstone Holdings, LLC | 94,441 | 5.43 | 6,186 | 17.07 | ||||
| 2025-08-18 | 13F | Front Row Advisors LLC | 444 | 0.00 | 29 | 11.54 | ||||
| 2025-08-07 | 13F | Mayport, Llc | 37,124 | -6.00 | 2,432 | 4.38 | ||||
| 2025-08-12 | 13F | Coston, McIsaac & Partners | 3,661 | 9.45 | 0 | |||||
| 2025-08-14 | 13F | TCG Advisory Services, LLC | 4,589 | -18.95 | 301 | -9.91 | ||||
| 2025-07-22 | 13F | Confluence Wealth Services, Inc. | 5,513 | 0.07 | 361 | 10.74 | ||||
| 2025-07-15 | 13F | Beacon Investment Advisory Services, Inc. | 9,200 | 603 | ||||||
| 2025-08-14 | 13F | EP Wealth Advisors, Inc. | 6,410 | 0.00 | 420 | 10.85 | ||||
| 2025-08-12 | 13F | Tradition Wealth Management, LLC | 10,885 | -1.07 | 713 | 9.88 | ||||
| 2025-08-15 | 13F | Captrust Financial Advisors | 38,907 | 9.55 | 2,548 | 21.68 | ||||
| 2025-07-11 | 13F | Mallini Complete Financial Planning LLC | 15,200 | 9.36 | 996 | 21.49 | ||||
| 2025-07-17 | 13F | New Covenant Trust Company, N.A. | 52,301 | -0.02 | 3,414 | 10.16 | ||||
| 2025-07-10 | 13F | Brooklyn FI, LLC | 40,663 | 26.15 | 2,663 | 40.08 | ||||
| 2025-07-25 | 13F | Lodestar Private Asset Management Llc | 7,038 | 0.59 | 461 | 11.65 | ||||
| 2025-08-08 | 13F | Smithfield Trust Co | 11,265 | 0.36 | 1 | |||||
| 2025-08-13 | 13F | Milestone Investment Advisors LLC | 2,659 | 0.04 | 174 | 11.54 | ||||
| 2025-08-14 | 13F | Graney & King, LLC | 621 | 0.32 | 41 | 11.11 | ||||
| 2025-07-17 | 13F | Refined Wealth Management | 243,425 | 0.73 | 15,944 | 11.87 | ||||
| 2025-08-12 | 13F | Global Retirement Partners, LLC | 382 | 0.26 | 25 | 19.05 | ||||
| 2025-07-23 | 13F | Bluestem Financial Advisors, Llc | 59,155 | -6.45 | 3,875 | 3.89 | ||||
| 2025-08-07 | 13F | Prime Buchholz LLC | 260,500 | 20.31 | 17,063 | 33.61 | ||||
| 2025-05-15 | 13F | Glenmede Trust Co Na | 9,926 | 14.92 | 585 | 19.63 | ||||
| 2025-08-07 | 13F | Winthrop Capital Management, LLC | 496 | 0.00 | 0 | |||||
| 2025-07-22 | 13F | Wealthcare Advisory Partners LLC | 4,795 | 18.89 | 314 | 32.49 | ||||
| 2025-08-14 | 13F | Warren Averett Asset Management, LLC | 4,266 | -1.02 | 279 | 9.84 | ||||
| 2025-08-11 | 13F | HighTower Advisors, LLC | 81,913 | -1.87 | 5,365 | 8.98 | ||||
| 2025-08-11 | 13F | Bell Investment Advisors, Inc | 24,581 | -4.02 | 1,610 | 6.62 | ||||
| 2025-08-14 | 13F | Great Valley Advisor Group, Inc. | 6,628 | 78.89 | 434 | 99.08 | ||||
| 2025-08-11 | 13F | Beta Wealth Group, Inc. | 26,110 | 1,710 | ||||||
| 2025-07-22 | 13F | Gemmer Asset Management LLC | 8,937 | 585 | ||||||
| 2025-07-22 | 13F | DT Investment Partners, LLC | 739 | 46.63 | 48 | 65.52 | ||||
| 2025-07-03 | 13F | McLean Asset Management Corp | 5,262 | 0.00 | 345 | 24.10 | ||||
| 2025-07-24 | 13F | Ramirez Asset Management, Inc. | 14,800 | -8.36 | 969 | 1.79 | ||||
| 2025-08-14 | 13F | AllSquare Wealth Management LLC | 1,655 | 0.00 | 108 | 11.34 | ||||
| 2025-07-30 | 13F | Evermay Wealth Management Llc | 0 | -100.00 | 0 | |||||
| 2025-08-13 | 13F | Northwestern Mutual Wealth Management Co | 85,016 | -12.10 | 5,569 | -2.38 | ||||
| 2025-08-14 | 13F | Moneta Group Investment Advisors Llc | 6,317 | 414 | ||||||
| 2025-07-21 | 13F | Family CFO Inc | 17,585 | 0.01 | 1,152 | 10.99 | ||||
| 2025-07-22 | 13F | Miracle Mile Advisors, LLC | 72,330 | 4,738 | ||||||
| 2025-07-25 | 13F | Strategic Point Investment Advisors, LLC | 13,643 | 42.63 | 894 | 58.33 | ||||
| 2025-08-13 | 13F | Cerity Partners LLC | 261,155 | -6.22 | 17,106 | 4.15 | ||||
| 2025-08-07 | 13F | Aegis Wealth Management LLC | 6,565 | 0.00 | 387 | 0.00 | ||||
| 2025-07-21 | 13F | West Financial Advisors, LLC | 32,301 | 0.09 | 2,116 | 11.14 | ||||
| 2025-07-10 | 13F | Charter Oak Capital Management, LLC | 148,797 | 5.19 | 9,746 | 16.83 | ||||
| 2025-07-24 | 13F | Leo Wealth, LLC | 816,012 | 32.18 | 53,518 | 46.98 | ||||
| 2025-08-08 | 13F | Cetera Investment Advisers | 73,695 | 9.66 | 4,827 | 21.80 | ||||
| 2025-07-30 | 13F | Crewe Advisors LLC | 148,434 | -0.56 | 9,722 | 10.44 | ||||
| 2025-07-21 | 13F | Keystone Financial Group, Inc. | 600 | 0.00 | 39 | 5.41 | ||||
| 2025-07-15 | 13F | Carr Financial Group Corp | 35,941 | 0.98 | 2,354 | 12.15 | ||||
| 2025-08-14 | 13F | Operose Advisors LLC | 9,335 | -11.98 | 611 | -2.24 | ||||
| 2025-07-14 | 13F | Foster Group, Inc. | 6,250 | -2.54 | 409 | 8.20 | ||||
| 2025-08-08 | 13F | POM Investment Strategies, LLC | 0 | -100.00 | 0 | |||||
| 2025-08-13 | 13F | Flow Traders U.s. Llc | 167,839 | -32.72 | 11 | -28.57 | ||||
| 2025-07-31 | 13F | Longview Financial Advisors, Inc. | 0 | -100.00 | 0 | |||||
| 2025-08-19 | 13F | Advisory Services Network, LLC | 80,170 | -4.72 | 5,194 | 4.68 | ||||
| 2025-07-25 | 13F | LRI Investments, LLC | 19,192 | 0.00 | 1,257 | 11.14 | ||||
| 2025-08-12 | 13F | Proequities, Inc. | 0 | 0 | ||||||
| 2025-08-11 | 13F | Vanguard Group Inc | 3,624,957 | 2.22 | 237,435 | 13.52 | ||||
| 2025-05-14 | 13F | Monterey Private Wealth, Inc. | 26,453 | -6.96 | 1,560 | -3.23 | ||||
| 2025-08-01 | 13F | Fort Vancouver Investment Management, LLC | 78 | 0.00 | 5 | 25.00 | ||||
| 2025-08-01 | 13F | Koss-Olinger Consulting, LLC | 57,700 | -7.46 | 3,779 | 2.77 | ||||
| 2025-07-14 | 13F | Armstrong Advisory Group, Inc | 1,040 | 68 | ||||||
| 2025-07-18 | 13F | Benchmark Wealth Management, LLC | 4,090 | 0.00 | 268 | 10.79 | ||||
| 2025-08-14 | 13F | Susquehanna International Group, Llp | 70,549 | 4,621 | ||||||
| 2025-08-14 | 13F | Pine Harbor Wealth Management, LLC | 3,710 | 0.22 | 243 | 11.47 | ||||
| 2025-08-14 | 13F | NCM Capital Management, LLC | 3,604 | 0.00 | 236 | 11.32 | ||||
| 2025-07-25 | 13F | Natural Investments, Llc | 4,153 | -2.72 | 0 | |||||
| 2025-07-25 | 13F | Libra Wealth Llc | 20,261 | -11.65 | 1,327 | -1.85 | ||||
| 2025-05-12 | 13F | Financial Engines Advisors L.L.C. | 0 | -100.00 | 0 | |||||
| 2025-07-09 | 13F | Archer Investment Management, LLC | 4,046 | -14.82 | 265 | -5.36 | ||||
| 2025-07-23 | 13F | Valmark Advisers, Inc. | 14,153 | 191.57 | 927 | 224.13 | ||||
| 2025-07-29 | 13F | DeDora Capital, Inc. | 48,943 | -0.49 | 3,206 | 10.52 | ||||
| 2025-05-09 | 13F | Tidemark, LLC | 0 | -100.00 | 0 | |||||
| 2025-07-16 | 13F | St Germain D J Co Inc | 140 | 0.00 | 9 | 12.50 | ||||
| 2025-07-31 | 13F | Opes Wealth Management LLC | 10,476 | -25.93 | 686 | -17.75 | ||||
| 2025-08-04 | 13F | Ledyard National Bank | 49,030 | -1.82 | 3,211 | 9.03 | ||||
| 2025-08-14 | 13F | UBS Group AG | 239,397 | -7.03 | 15,681 | 3.25 | ||||
| 2025-07-22 | 13F | Valeo Financial Advisors, LLC | 4,292 | 2.41 | 281 | 13.77 | ||||
| 2025-08-11 | 13F | United Capital Financial Advisers, Llc | 5,072 | 332 | ||||||
| 2025-07-31 | 13F | Cambridge Investment Research Advisors, Inc. | 26,661 | -7.05 | 2 | 0.00 | ||||
| 2025-08-06 | 13F | Summit Wealth Group, LLC | 23,085 | 0.00 | 2 | 0.00 | ||||
| 2025-07-18 | 13F | Truist Financial Corp | 8,562 | -2.45 | 561 | 8.32 | ||||
| 2025-07-18 | 13F | Bartlett & Co. Wealth Management Llc | 13,005 | 0.00 | 852 | 10.95 | ||||
| 2025-08-08 | 13F | Creative Planning | 1,316,871 | 0.33 | 86,255 | 11.42 | ||||
| 2025-05-15 | 13F | Gts Securities Llc | 0 | -100.00 | 0 | |||||
| 2025-08-12 | 13F | Jpmorgan Chase & Co | 16,264 | 26.92 | 1,065 | 41.06 | ||||
| 2025-07-29 | 13F | Tradewinds Capital Management, LLC | 606 | 5.76 | 40 | 18.18 | ||||
| 2025-07-11 | 13F | Myecfo, Llc | 3,700 | 242 | ||||||
| 2025-07-17 | 13F | Johnson Bixby & Associates, LLC | 14,475 | -0.65 | 948 | 10.36 | ||||
| 2025-08-13 | 13F | Twin Peaks Wealth Advisors, LLC | 105 | 7 | ||||||
| 2025-08-14 | 13F | Comerica Bank | 3,805 | 0.00 | 249 | 11.16 | ||||
| 2025-07-21 | 13F | Ameritas Advisory Services, LLC | 17 | 1 | ||||||
| 2025-08-13 | 13F | Haverford Trust Co | 41,571 | 18.93 | 2,723 | 32.07 | ||||
| 2025-05-02 | 13F | Whittier Trust Co | 0 | -100.00 | 0 | |||||
| 2025-07-08 | 13F | Webster Bank, N. A. | 7,625 | 0.00 | 499 | 11.14 | ||||
| 2025-08-08 | 13F | Larson Financial Group LLC | 9,633 | -1.37 | 631 | 9.38 | ||||
| 2025-08-14 | 13F | Headinvest, Llc | 18,214 | 33.49 | 1,193 | 48.38 | ||||
| 2025-08-15 | 13F | Fft Wealth Management Llc | 22,742 | 25.49 | 1,511 | 41.39 | ||||
| 2025-08-14 | 13F | Bank Of America Corp /de/ | 266,038 | -6.14 | 17,426 | 4.24 | ||||
| 2025-08-08 | 13F | Pnc Financial Services Group, Inc. | 4,168 | 0.00 | 273 | 11.43 | ||||
| 2025-08-11 | 13F | Heritage Wealth Advisors | 150 | 10 | ||||||
| 2025-07-23 | 13F | Hardy Reed LLC | 20,182 | 3.89 | 1,322 | 15.37 | ||||
| 2025-08-12 | 13F | Franklin Resources Inc | 15,937 | 12.15 | 1,044 | 24.46 | ||||
| 2025-08-01 | 13F | McCarthy Grittinger Financial Group, LLC | 7,077 | -4.97 | 464 | 5.47 | ||||
| 2025-07-07 | 13F | Bangor Savings Bank | 1,140 | 0.00 | 75 | 10.45 | ||||
| 2025-08-13 | 13F | SCS Capital Management LLC | 456,580 | 6.56 | 29,906 | 18.34 | ||||
| 2025-08-13 | 13F | Baird Financial Group, Inc. | 166,471 | -0.25 | 10,904 | 10.78 | ||||
| 2025-05-09 | 13F | Avalon Trust Co | 0 | -100.00 | 0 | |||||
| 2025-07-14 | 13F | AdvisorNet Financial, Inc | 5,155 | -3.30 | 338 | 7.32 | ||||
| 2025-08-08 | 13F | Tortoise Investment Management, LLC | 5,992 | -3.37 | 392 | 7.40 | ||||
| 2025-08-27 | 13F | Tribridge Partners Financial LLC | 7,138 | 0 | ||||||
| 2025-07-10 | 13F | Piscataqua Savings Bank | 390 | 0.00 | 26 | 13.64 | ||||
| 2025-07-14 | 13F | Sellwood Investment Partners LLC | 271,542 | 0.49 | 17,786 | 11.60 | ||||
| 2025-08-07 | 13F | Bradley & Co. Private Wealth Management, LLC | 334 | 0.00 | 22 | 10.53 | ||||
| 2025-07-17 | 13F | Sound Income Strategies, LLC | 635 | 42 | ||||||
| 2025-07-15 | 13F | Five Pine Wealth Management | 4,259 | 0.97 | 279 | 12.10 | ||||
| 2025-07-15 | 13F | Fifth Third Bancorp | 361 | 0.00 | 24 | 9.52 | ||||
| 2025-07-14 | 13F | Sterling Group Wealth Management, LLC | 6,006 | 6.49 | 393 | 18.37 | ||||
| 2025-08-14 | 13F | Vista Capital Partners, Inc. | 25,060 | -2.97 | 1,641 | 7.75 | ||||
| 2025-07-11 | 13F | Skyline Advisors, Inc. | 17,875 | -4.17 | 1,171 | 6.36 | ||||
| 2025-08-07 | 13F | Kestra Private Wealth Services, Llc | 4,280 | -19.65 | 280 | -10.83 | ||||
| 2025-08-04 | 13F | Pinnacle Associates Ltd | 7,139 | -5.90 | 468 | 4.47 | ||||
| 2025-07-29 | 13F | Sincerus Advisory, LLC | 3,951 | -4.93 | 263 | 7.35 | ||||
| 2025-08-07 | 13F | Tfo-tdc, Llc | 11,604 | 0.98 | 760 | 12.26 | ||||
| 2025-08-14 | 13F | FC Advisory LLC | 3,509 | 230 |
Other Listings
| MX:VSGX |