Mga Batayang Estadistika
| Pemilik Institusional | 159 total, 141 long only, 1 short only, 17 long/short - change of 6.71% MRQ |
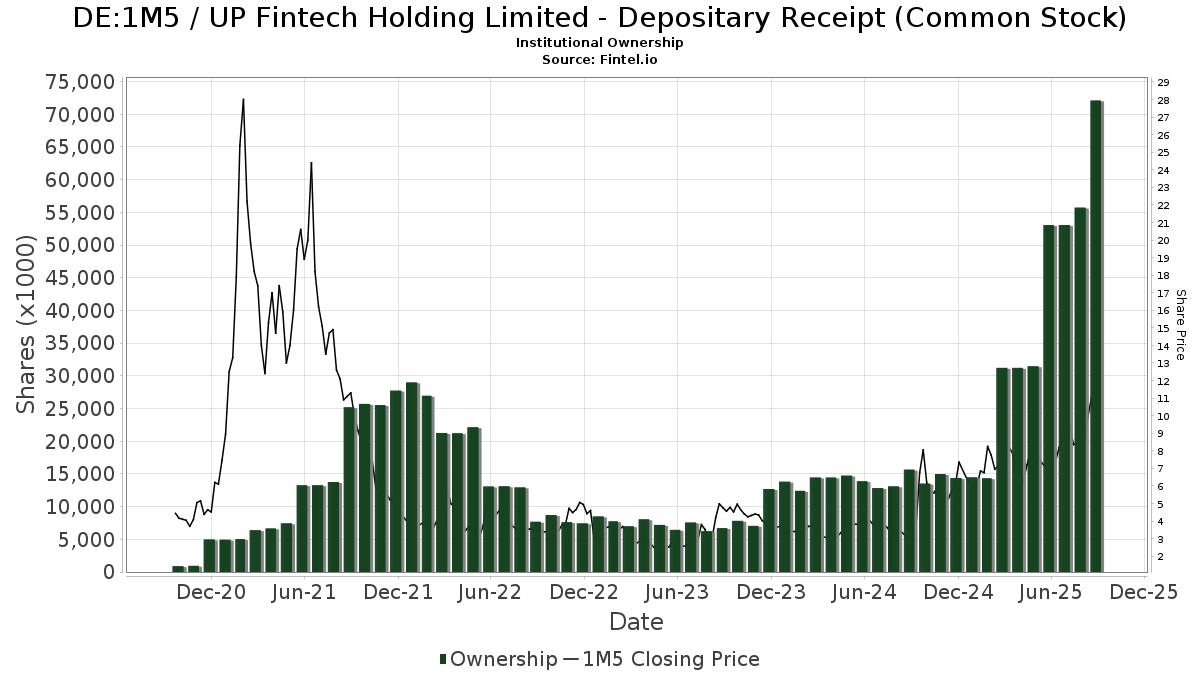
| Harga Saham | 11.10 |
| Alokasi Portofolio Rata-rata | 0.4073 % - change of 42.85% MRQ |
| Saham Institusional (Jangka Panjang) | 72,097,479 (ex 13D/G) - change of 19.13MM shares 36.11% MRQ |
| Nilai Institusional (Jangka Panjang) | $ 681,890 USD ($1000) |
Kepemilikan Institusional dan Pemegang Saham
UP Fintech Holding Limited - Depositary Receipt (Common Stock) (DE:1M5) memiliki 159 pemilik institusional dan pemegang saham yang telah mengajukan formulir 13D/G atau 13F kepada Komisi Bursa Efek (Securities Exchange Commission/SEC). Lembaga-lembaga ini memegang total 72,097,479 saham. Pemegang saham terbesar meliputi Avenir Tech Ltd, Susquehanna International Group, Llp, Susquehanna International Group, Llp, Sparta 24 Ltd., Jane Street Group, Llc, Jane Street Group, Llc, Group One Trading, L.p., Group One Trading, L.p., Morgan Stanley, and Walleye Trading LLC .
Struktur kepemilikan institusional UP Fintech Holding Limited - Depositary Receipt (Common Stock) (DB:1M5) menunjukkan posisi terkini di perusahaan oleh institusi dan dana, serta perubahan terbaru dalam ukuran posisi. Pemegang saham utama dapat mencakup investor individu, reksa dana, dana lindung nilai, atau institusi. Jadwal 13D menunjukkan bahwa investor memegang (atau pernah memegang) lebih dari 5% saham perusahaan dan bermaksud (atau pernah bermaksud) untuk secara aktif mengejar perubahan strategi bisnis. Jadwal 13G menunjukkan investasi pasif lebih dari 5%.
The share price as of September 5, 2025 is 11.10 / share. Previously, on September 6, 2024, the share price was 3.06 / share. This represents an increase of 262.75% over that period.
Skor Sentimen Dana
Skor Sentimen Dana (sebelumnya dikenal sebagai Skor Akumulasi Kepemilikan) menemukan saham-saham yang paling banyak dibeli oleh dana. Ini adalah hasil dari model kuantitatif multi-faktor yang canggih yang mengidentifikasi perusahaan dengan tingkat akumulasi institusional tertinggi. Model penilaian menggunakan kombinasi dari total peningkatan pemilik yang diungkapkan, perubahan dalam alokasi portofolio pada pemilik tersebut, dan metrik lainnya. Angka berkisar dari 0 hingga 100, dengan angka yang lebih tinggi menunjukkan tingkat akumulasi yang lebih tinggi dibandingkan dengan perusahaan sejenisnya, dan 50 adalah rata-ratanya.
Frekuensi Pembaruan: Setiap Hari
Lihat Ownership Explorer, yang menyediakan daftar perusahaan dengan peringkat tertinggi.
Pengajuan 13F dan NPORT
Detail pada pengajuan 13F tersedia gratis. Detail pada pengajuan NP memerlukan keanggotaan premium. Baris berwarna hijau menunjukkan posisi baru. Baris berwarna merah menunjukkan posisi yang sudah ditutup. Klik tautan ini ikon untuk melihat riwayat transaksi selengkapnya.
Tingkatkan
untuk membuka data premium dan mengekspor ke Excel ![]() .
.
| Tanggal File | Sumber | Investor | Ketik | Presyo ng Avg (Silangan) |
Saham | Δ Saham (%) |
Dilaporkan Nilai ($1000) |
Nilai Δ (%) |
Alokasi Port (%) |
|
|---|---|---|---|---|---|---|---|---|---|---|
| 2025-08-13 | 13F | Renaissance Technologies Llc | 1,279,100 | 44.74 | 12,343 | 62.62 | ||||
| 2025-08-05 | 13F | Simplex Trading, Llc | Put | 1,366,700 | -26.17 | 13 | -13.33 | |||
| 2025-07-22 | 13F | Gsa Capital Partners Llp | 298,009 | 70.00 | 3 | 100.00 | ||||
| 2025-08-05 | 13F | Simplex Trading, Llc | 504,169 | -35.01 | 5 | -33.33 | ||||
| 2025-08-14 | 13F | Garden State Investment Advisory Services LLC | 0 | -100.00 | 0 | -100.00 | ||||
| 2025-08-05 | 13F | Simplex Trading, Llc | Call | 1,179,200 | -8.45 | 11 | 0.00 | |||
| 2025-08-14 | 13F | D. E. Shaw & Co., Inc. | 1,309,001 | -49.09 | 12,632 | -42.81 | ||||
| 2025-08-14 | 13F | D. E. Shaw & Co., Inc. | Put | 42,400 | 409 | |||||
| 2025-05-15 | 13F | Oasis Management Co Ltd. | Call | 0 | -100.00 | 0 | -100.00 | |||
| 2025-07-30 | 13F | Wallace Advisory Group, LLC | 13,506 | -1.21 | 116 | 31.82 | ||||
| 2025-07-23 | 13F | Bingham Private Wealth, Llc | 12,752 | 21.07 | 123 | 36.67 | ||||
| 2025-08-13 | 13F | CMT Capital Markets Trading GmbH | 0 | -100.00 | 0 | -100.00 | ||||
| 2025-05-13 | 13F | HighTower Advisors, LLC | Call | 0 | -100.00 | 0 | -100.00 | |||
| 2025-07-30 | 13F | D.a. Davidson & Co. | 19,500 | 188 | ||||||
| 2025-08-14 | 13F | Wellington Management Group Llp | 15,235 | 147 | ||||||
| 2025-08-11 | 13F | Citigroup Inc | 40,182 | 116.65 | 388 | 143.40 | ||||
| 2025-05-07 | 13F | Nkcfo Llc | 0 | -100.00 | 0 | |||||
| 2025-08-14 | 13F | Eschler Asset Management LLP | 41,147 | -65.71 | 397 | -61.46 | ||||
| 2025-08-13 | 13F | Pictet Asset Management Holding SA | 39,600 | -40.18 | 382 | -32.75 | ||||
| 2025-08-14 | 13F | Mml Investors Services, Llc | 19,709 | 0 | ||||||
| 2025-06-27 | NP | PGJ - Invesco Golden Dragon China ETF This fund is a listed as child fund of Invesco Ltd. and if that institution has disclosed ownership in this security, then these positions will not be double counted when calculating total shares and total value | 113,120 | 9.88 | 933 | 28.69 | ||||
| 2025-08-08 | 13F | Alberta Investment Management Corp | 10,500 | 0.00 | 101 | 12.22 | ||||
| 2025-05-15 | 13F | Dymon Asia Capital (singapore) Pte. Ltd. | 0 | -100.00 | 0 | -100.00 | ||||
| 2025-08-14 | 13F | Avenir Tech Ltd | Put | 610,400 | 5,890 | |||||
| 2025-08-12 | 13F | Rhumbline Advisers | 4,202 | -28.92 | 41 | -20.00 | ||||
| 2025-08-14 | 13F | Avenir Tech Ltd | 10,667,581 | 296.58 | 102,942 | 345.52 | ||||
| 2025-08-27 | 13F/A | Squarepoint Ops LLC | Put | 168,900 | 1,630 | |||||
| 2025-07-11 | 13F | Farther Finance Advisors, LLC | 17 | 0.00 | 0 | |||||
| 2025-08-27 | 13F/A | Squarepoint Ops LLC | 68,674 | 17.95 | 663 | 32.40 | ||||
| 2025-08-14 | 13F | Parallax Volatility Advisers, L.P. | Put | 157,100 | 1,046.72 | 1,516 | 1,195.73 | |||
| 2025-08-14 | 13F | Parallax Volatility Advisers, L.P. | Call | 7,500 | -73.21 | 72 | -70.00 | |||
| 2025-08-14 | 13F | Parallax Volatility Advisers, L.P. | 347,213 | 25.22 | 3,351 | 40.70 | ||||
| 2025-06-23 | NP | UGPIX - UltraChina ProFund Investor Class | 4,347 | -34.91 | 36 | -25.53 | ||||
| 2025-08-01 | 13F | Envestnet Asset Management Inc | 218,480 | 21.15 | 2,108 | 36.09 | ||||
| 2025-07-24 | NP | ONEQ - Fidelity Nasdaq Composite Index Tracking Stock This fund is a listed as child fund of Fmr Llc and if that institution has disclosed ownership in this security, then these positions will not be double counted when calculating total shares and total value | 41,806 | -33.93 | 339 | 33.46 | ||||
| 2025-08-14 | 13F | Ionic Capital Management LLC | Call | 0 | -100.00 | 0 | ||||
| 2025-08-14 | 13F | Susquehanna International Group, Llp | 1,982,850 | 9.45 | 19,135 | 22.95 | ||||
| 2025-08-28 | NP | SPEM - SPDR(R) Portfolio Emerging Markets ETF | 121,262 | 1.93 | 1,170 | 14.59 | ||||
| 2025-08-14 | 13F | Susquehanna International Group, Llp | Call | 7,540,500 | 26.87 | 72,766 | 42.52 | |||
| 2025-08-14 | 13F | Susquehanna International Group, Llp | Put | 7,587,600 | 184.55 | 73,220 | 219.67 | |||
| 2025-08-14 | 13F | CoreCap Advisors, LLC | 1 | 0.00 | 0 | |||||
| 2025-07-11 | 13F | Harbour Capital Advisors, LLC | 67,525 | -2.58 | 646 | 12.35 | ||||
| 2025-09-04 | 13F/A | Advisor Group Holdings, Inc. | 63,279 | 638.38 | 611 | 735.62 | ||||
| 2025-05-05 | 13F | Creekmur Asset Management LLC | 0 | -100.00 | 0 | |||||
| 2025-08-14 | 13F | Ubs Asset Management Americas Inc | 110,200 | -15.30 | 1,063 | -4.83 | ||||
| 2025-08-04 | 13F | Quaker Wealth Management, LLC | Put | 0 | -100.00 | 0 | -100.00 | |||
| 2025-08-11 | 13F | Principal Securities, Inc. | 0 | -100.00 | 0 | |||||
| 2025-08-14 | 13F | Bnp Paribas Arbitrage, Sa | 161,179 | -16.20 | 1,555 | -5.87 | ||||
| 2025-07-28 | NP | HROAX - FinTrust Income and Opportunity Fund Class A Shares | 75,000 | -11.76 | 608 | -1.14 | ||||
| 2025-08-05 | 13F | Claro Advisors LLC | 0 | -100.00 | 0 | |||||
| 2025-08-14 | 13F | Caption Management, LLC | Call | 80,000 | 0.00 | 772 | 12.37 | |||
| 2025-08-14 | 13F | Alliancebernstein L.p. | 24,710 | 238 | ||||||
| 2025-08-25 | NP | AADR - AdvisorShares Dorsey Wright ADR ETF | 154,066 | 27.32 | 1,487 | 43.02 | ||||
| 2025-08-13 | 13F | Jones Financial Companies Lllp | 11,542 | 46,068.00 | 109 | |||||
| 2025-08-14 | 13F | Royal Bank Of Canada | 6,548 | -57.08 | 63 | -51.91 | ||||
| 2025-08-14 | 13F | D. E. Shaw & Co., Inc. | Call | 520,000 | 147.62 | 5,018 | 178.31 | |||
| 2025-08-14 | 13F | Goldman Sachs Group Inc | 2,544,456 | 19.24 | 24,554 | 33.96 | ||||
| 2025-08-14 | 13F | Canada Pension Plan Investment Board | 1,274,250 | 15.63 | 12,297 | 29.90 | ||||
| 2025-07-28 | NP | AVSE - Avantis Responsible Emerging Markets Equity ETF | 126 | 0.00 | 1 | |||||
| 2025-08-13 | 13F | Walleye Trading LLC | 1,131,801 | -12.59 | 10,922 | -1.81 | ||||
| 2025-08-13 | 13F | Walleye Trading LLC | Put | 3,514,100 | 0.85 | 33,911 | 13.30 | |||
| 2025-07-28 | NP | AVEE - Avantis Emerging Markets Small Cap Equity ETF | 5,362 | 42.04 | 43 | 59.26 | ||||
| 2025-08-14 | 13F | Verition Fund Management LLC | 313,660 | 98.36 | 3,027 | 122.83 | ||||
| 2025-08-13 | 13F | Walleye Trading LLC | Call | 536,300 | -27.96 | 5,175 | -19.06 | |||
| 2025-08-12 | 13F | Deutsche Bank Ag\ | 8,902 | 49.71 | 86 | 66.67 | ||||
| 2025-08-14 | 13F | Bank Of America Corp /de/ | 2,282,337 | 122.65 | 22,025 | 150.13 | ||||
| 2025-07-25 | 13F | JustInvest LLC | 13,517 | 14.15 | 130 | 28.71 | ||||
| 2025-08-14 | 13F/A | Barclays Plc | 122,435 | 10.52 | 1 | |||||
| 2025-08-14 | 13F | Banque Transatlantique SA | 0 | -100.00 | 0 | |||||
| 2025-08-14 | 13F | Prelude Capital Management, Llc | 20,000 | 193 | ||||||
| 2025-07-15 | 13F | Burns Matteson Capital Management, LLC | 26,119 | 42.57 | 252 | 60.51 | ||||
| 2025-08-14 | 13F | Lighthouse Investment Partners, LLC | 0 | -100.00 | 0 | |||||
| 2025-08-12 | 13F | Handelsbanken Fonder AB | 27,000 | 33.00 | 0 | |||||
| 2025-08-08 | 13F | Wrapmanager Inc | 16,149 | -3.23 | 156 | 8.39 | ||||
| 2025-08-12 | 13F | Virtu Financial LLC | 59,864 | -12.36 | 1 | |||||
| 2025-07-24 | NP | FNCMX - Fidelity Nasdaq Composite Index Fund This fund is a listed as child fund of Fmr Llc and if that institution has disclosed ownership in this security, then these positions will not be double counted when calculating total shares and total value | 80,177 | 0.00 | 650 | 12.07 | ||||
| 2025-08-11 | 13F | HighTower Advisors, LLC | 60,555 | 114.36 | 584 | 141.32 | ||||
| 2025-08-14 | 13F | Van Eck Associates Corp | 74,181 | 0.00 | 1 | |||||
| 2025-05-09 | 13F | Headlands Technologies LLC | 0 | -100.00 | 0 | |||||
| 2025-07-29 | 13F | Beverly Hills Private Wealth, LLC | 25,799 | -4.88 | 249 | 6.90 | ||||
| 2025-08-13 | 13F | Healthcare Of Ontario Pension Plan Trust Fund | 354,100 | 3,417 | ||||||
| 2025-08-28 | NP | QCSTRX - Stock Account Class R1 | 95,400 | 0.00 | 921 | 12.33 | ||||
| 2025-08-12 | 13F | Pathstone Holdings, LLC | 12,562 | 0.00 | 121 | 13.08 | ||||
| 2025-08-14 | 13F | Lazard Asset Management Llc | 686 | 26.10 | 0 | |||||
| 2025-07-24 | 13F | Ronald Blue Trust, Inc. | 280 | -84.03 | 3 | -86.67 | ||||
| 2025-08-13 | 13F | Invesco Ltd. | 106,017 | -5.88 | 1,023 | 5.79 | ||||
| 2025-08-14 | 13F | UBS Group AG | 378,458 | -38.70 | 3,652 | -31.13 | ||||
| 2025-08-13 | 13F | Arrowstreet Capital, Limited Partnership | 3,247,099 | 282.08 | 31,335 | 329.23 | ||||
| 2025-08-12 | 13F | Personal Cfo Solutions, Llc | 30,668 | 6.97 | 296 | 19.92 | ||||
| 2025-08-01 | 13F | Shilanski & Associates, Inc. | 29,546 | 0.33 | 285 | 13.10 | ||||
| 2025-08-12 | 13F | Jpmorgan Chase & Co | Put | 160,600 | -42.56 | 1,550 | -35.49 | |||
| 2025-07-25 | NP | ECNS - iShares MSCI China Small-Cap ETF | 54,346 | 22.93 | 441 | 37.50 | ||||
| 2025-08-14 | 13F | Symmetry Peak Management Llc | Call | 48,900 | 472 | |||||
| 2025-07-28 | 13F | Allianz Asset Management GmbH | 0 | -100.00 | 0 | |||||
| 2025-08-12 | 13F | Legal & General Group Plc | 11,594 | 0.00 | 112 | 12.12 | ||||
| 2025-08-04 | 13F | Atria Investments Llc | 52,461 | -0.15 | 506 | 12.20 | ||||
| 2025-08-12 | 13F | Jpmorgan Chase & Co | 2,656,227 | 78.09 | 25,633 | 100.08 | ||||
| 2025-08-15 | 13F | Tower Research Capital LLC (TRC) | 32,918 | 96.21 | 318 | 120.14 | ||||
| 2025-08-13 | 13F | Russell Investments Group, Ltd. | 309 | 0.00 | 3 | 0.00 | ||||
| 2025-08-08 | 13F | Cetera Investment Advisers | 50,173 | 2.84 | 484 | 15.51 | ||||
| 2025-08-14 | 13F | Schonfeld Strategic Advisors LLC | 24,337 | 235 | ||||||
| 2025-05-09 | 13F | Belvedere Trading LLC | Put | 0 | -100.00 | 0 | ||||
| 2025-08-14 | 13F | Tudor Investment Corp Et Al | 72,517 | 700 | ||||||
| 2025-05-15 | 13F | Nomura Holdings Inc | 0 | -100.00 | 0 | -100.00 | ||||
| 2025-08-12 | 13F | Nuveen, LLC | 77,100 | -19.18 | 744 | -9.16 | ||||
| 2025-08-14 | 13F | Vident Advisory, LLC | 53,104 | -40.66 | 512 | -33.33 | ||||
| 2025-05-14 | 13F | HAP Trading, LLC | Call | 0 | -100.00 | 0 | -100.00 | |||
| 2025-09-04 | 13F | Abn Amro Investment Solutions | 0 | -100.00 | 0 | -100.00 | ||||
| 2025-08-13 | 13F | EverSource Wealth Advisors, LLC | 2,411 | -18.24 | 23 | -8.00 | ||||
| 2025-08-11 | 13F | Dorsey Wright & Associates | 221,433 | -38.40 | 2,137 | -30.80 | ||||
| 2025-08-28 | NP | GXC - SPDR(R) S&P(R) CHINA ETF | 14,446 | -10.17 | 139 | 0.72 | ||||
| 2025-08-14 | 13F | Millennium Management Llc | 39,195 | -98.37 | 378 | -98.17 | ||||
| 2025-08-18 | 13F/A | National Bank Of Canada /fi/ | 359,120 | 299,166.67 | 3,466 | 346,400.00 | ||||
| 2025-08-01 | 13F | Y-Intercept (Hong Kong) Ltd | 546,479 | 492.32 | 5,274 | 565.78 | ||||
| 2025-07-22 | 13F | IMC-Chicago, LLC | 0 | -100.00 | 0 | -100.00 | ||||
| 2025-08-18 | 13F | Wolverine Trading, Llc | 133,499 | 176.68 | 1,258 | 200.72 | ||||
| 2025-08-13 | 13F | Marshall Wace, Llp | 937,037 | -58.64 | 9,042 | -53.54 | ||||
| 2025-07-30 | NP | APIE - ActivePassive International Equity ETF | 0 | -100.00 | 0 | -100.00 | ||||
| 2025-08-18 | 13F | Wolverine Trading, Llc | Call | 351,800 | -18.77 | 3,314 | -11.75 | |||
| 2025-08-18 | 13F | Wolverine Trading, Llc | Put | 235,200 | 35.64 | 2,216 | 47.37 | |||
| 2025-08-07 | 13F | Connor, Clark & Lunn Investment Management Ltd. | 0 | -100.00 | 0 | |||||
| 2025-08-14 | 13F | Numerai GP LLC | 0 | -100.00 | 0 | |||||
| 2025-08-13 | 13F | Jump Financial, LLC | 1,346,435 | 12,993 | ||||||
| 2025-06-26 | NP | FTIHX - Fidelity Total International Index Fund This fund is a listed as child fund of Fmr Llc and if that institution has disclosed ownership in this security, then these positions will not be double counted when calculating total shares and total value | 52,505 | 32.89 | 433 | 55.76 | ||||
| 2025-08-12 | 13F | BlackRock, Inc. | 2,244,778 | -7.73 | 21,662 | 3.66 | ||||
| 2025-08-14 | 13F | Stifel Financial Corp | 77,314 | 2.30 | 746 | 14.95 | ||||
| 2025-08-14 | 13F | Cubist Systematic Strategies, LLC | Call | 1,013,500 | 71.00 | 9,780 | 92.10 | |||
| 2025-08-13 | 13F | Townsquare Capital Llc | 0 | -100.00 | 0 | |||||
| 2025-08-14 | 13F | Cubist Systematic Strategies, LLC | Put | 19,000 | 183 | |||||
| 2025-08-12 | 13F | Contrarius Group Holdings Ltd | 698,431 | -40.01 | 6,740 | -32.61 | ||||
| 2025-07-15 | 13F | SJS Investment Consulting Inc. | 190 | -25.20 | 2 | -50.00 | ||||
| 2025-07-28 | 13F | BRYN MAWR TRUST Co | 10,000 | 96 | ||||||
| 2025-07-21 | 13F | Mirae Asset Global Investments Co., Ltd. | 3,556 | -0.64 | 34 | 9.68 | ||||
| 2025-07-25 | NP | IEMG - iShares Core MSCI Emerging Markets ETF | 1,043,812 | 15.12 | 8,465 | 28.96 | ||||
| 2025-08-14 | 13F | Federation des caisses Desjardins du Quebec | 205 | 0.00 | 2 | 0.00 | ||||
| 2025-07-25 | NP | EEMS - iShares MSCI Emerging Markets Small-Cap ETF | 31,034 | 14.86 | 252 | 28.72 | ||||
| 2025-08-14 | 13F | Group One Trading, L.p. | Call | 4,185,600 | 45.42 | 40,391 | 63.37 | |||
| 2025-08-14 | 13F | Voloridge Investment Management, Llc | 0 | -100.00 | 0 | |||||
| 2025-08-14 | 13F | Citadel Advisors Llc | Put | 1,988,700 | 9.92 | 19,191 | 23.48 | |||
| 2025-08-14 | 13F | Citadel Advisors Llc | 1,961,751 | 125.89 | 18,931 | 153.75 | ||||
| 2025-08-14 | 13F | Group One Trading, L.p. | 4,390,892 | 80.47 | 42,372 | 102.74 | ||||
| 2025-07-25 | 13F | Cwm, Llc | 256 | 0.00 | 0 | |||||
| 2025-08-19 | 13F | Advisory Services Network, LLC | 12,937 | 127 | ||||||
| 2025-08-28 | NP | SSGVX - State Street Global Equity ex-U.S. Index Portfolio State Street Global All Cap Equity ex-U.S. Index Portfolio This fund is a listed as child fund of State Street Corp and if that institution has disclosed ownership in this security, then these positions will not be double counted when calculating total shares and total value | 42,900 | 0.00 | 414 | 12.23 | ||||
| 2025-08-14 | 13F | Citadel Advisors Llc | Call | 2,157,100 | -7.70 | 20,816 | 3.70 | |||
| 2025-08-12 | 13F | LPL Financial LLC | 91,196 | 10.00 | 880 | 23.60 | ||||
| 2025-08-14 | 13F | Group One Trading, L.p. | Put | 3,491,500 | 64.05 | 33,693 | 84.29 | |||
| 2025-07-29 | 13F | Commons Capital, Llc | 23,000 | 222 | ||||||
| 2025-08-14 | 13F | Mangrove Partners | 79,771 | 770 | ||||||
| 2025-08-14 | 13F | Man Group plc | 748,503 | 532.56 | 7,223 | 610.93 | ||||
| 2025-08-28 | NP | SPGM - SPDR(R) Portfolio MSCI Global Stock Market ETF | 8,502 | 2.94 | 82 | 17.14 | ||||
| 2025-05-13 | 13F | Clear Street Markets Llc | 0 | -100.00 | 0 | -100.00 | ||||
| 2025-08-04 | 13F | AdvisorShares Investments LLC | 154,066 | 27.32 | 1,487 | 41.52 | ||||
| 2025-08-14 | 13F | Scientech Research LLC | 19,319 | 186 | ||||||
| 2025-07-31 | 13F | Caitong International Asset Management Co., Ltd | 5,094 | 205.58 | 49 | 250.00 | ||||
| 2025-08-08 | 13F | Geode Capital Management, Llc | 179,005 | -0.95 | 1,727 | 11.28 | ||||
| 2025-08-15 | 13F | Morgan Stanley | 3,696,042 | 39.23 | 35,667 | 56.42 | ||||
| 2025-08-26 | NP | Profunds - Profund Vp Asia 30 | 54,999 | -7.23 | 531 | 4.13 | ||||
| 2025-05-13 | 13F | Central Asset Investments & Management Holdings (HK) Ltd | 0 | -100.00 | 0 | |||||
| 2025-08-08 | 13F | Police & Firemen's Retirement System of New Jersey | 43,162 | 0.00 | 417 | 12.43 | ||||
| 2025-07-16 | 13F | ORG Wealth Partners, LLC | 606 | 0.00 | 6 | 0.00 | ||||
| 2025-07-18 | 13F | Truist Financial Corp | 16,403 | 0.64 | 158 | 12.86 | ||||
| 2025-05-15 | 13F | Tairen Capital Ltd | 0 | -100.00 | 0 | |||||
| 2025-05-15 | 13F | Two Sigma Securities, Llc | 0 | -100.00 | 0 | |||||
| 2025-08-14 | 13F | Raymond James Financial Inc | 3,400 | 33 | ||||||
| 2025-05-08 | 13F | XTX Topco Ltd | 0 | -100.00 | 0 | |||||
| 2025-08-13 | 13F | Icapital Wealth Llc | 13,049 | 0.00 | 126 | 11.61 | ||||
| 2025-08-08 | 13F | Jupiter Asset Management Ltd | 2,534,300 | 24,456 | ||||||
| 2025-08-13 | 13F | Centiva Capital, LP | 123,383 | 13.41 | 1,191 | 27.41 | ||||
| 2025-08-14 | 13F | Integrated Wealth Concepts LLC | 37,582 | 363 | ||||||
| 2025-07-14 | 13F | GAMMA Investing LLC | 13,168 | 22.74 | 127 | 38.04 | ||||
| 2025-08-14 | 13F | Engineers Gate Manager LP | 0 | -100.00 | 0 | |||||
| 2025-08-13 | 13F | Quadrature Capital Ltd | 57,252 | -20.13 | 553 | -10.24 | ||||
| 2025-08-06 | 13F | Fox Run Management, L.l.c. | 10,662 | 103 | ||||||
| 2025-08-13 | 13F | Walleye Capital LLC | Call | 24,100 | -17.75 | 233 | -7.57 | |||
| 2025-08-14 | 13F | Wells Fargo & Company/mn | 24,824 | 123.22 | 240 | 151.58 | ||||
| 2025-08-14 | 13F | Two Sigma Investments, Lp | 239,480 | -89.17 | 2,311 | -87.84 | ||||
| 2025-07-21 | 13F/A | Point72 Asset Management, L.P. | 0 | -100.00 | 0 | -100.00 | ||||
| 2025-07-31 | 13F | Asset Management One Co., Ltd. | 13,749 | 15.31 | 133 | 29.41 | ||||
| 2025-08-13 | 13F | Walleye Capital LLC | Put | 11,800 | -70.20 | 114 | -66.76 | |||
| 2025-08-13 | 13F | Walleye Capital LLC | 871,831 | -6.29 | 8,413 | 5.28 | ||||
| 2025-08-08 | 13F | Larson Financial Group LLC | 137 | -12.18 | 1 | 0.00 | ||||
| 2025-08-14 | 13F | Alliance Wealth Advisors, LLC /UT | 14,604 | 1.40 | 141 | 13.82 | ||||
| 2025-08-14 | 13F | Ieq Capital, Llc | 12,701 | 0.00 | 123 | 11.93 | ||||
| 2025-07-31 | 13F | Cambridge Investment Research Advisors, Inc. | 65,993 | 1 | ||||||
| 2025-08-28 | NP | GMF - SPDR(R) S&P(R) EMERGING ASIA PACIFIC ETF | 10,261 | -6.52 | 99 | 5.32 | ||||
| 2025-08-01 | 13F | Belvedere Trading LLC | 0 | -100.00 | 0 | |||||
| 2025-08-12 | 13F | Trexquant Investment LP | 675,679 | 6,520 | ||||||
| 2025-05-14 | 13F | Peak6 Llc | 0 | -100.00 | 0 | -100.00 | ||||
| 2025-07-23 | 13F | Shell Asset Management Co | 6,828 | 0.00 | 0 | |||||
| 2025-08-12 | 13F | Proequities, Inc. | Put | 0 | 0 | |||||
| 2025-08-14 | 13F | Two Sigma Advisers, Lp | 166,900 | -80.96 | 1,611 | -78.61 | ||||
| 2025-08-12 | 13F | Proequities, Inc. | Call | 0 | 0 | |||||
| 2025-08-14 | 13F | Wiley Bros.-aintree Capital, Llc | 18,936 | 183 | ||||||
| 2025-08-12 | 13F | Proequities, Inc. | 0 | 0 | ||||||
| 2025-08-14 | 13F | Oasis Management Co Ltd. | 0 | -100.00 | 0 | |||||
| 2025-07-22 | NP | GINN - Goldman Sachs Innovate Equity ETF | 17,869 | -64.31 | 145 | -41.22 | ||||
| 2025-08-07 | 13F | Acadian Asset Management Llc | 32,298 | -74.49 | 0 | -100.00 | ||||
| 2025-08-14 | 13F | Diversify Wealth Management, Llc | 177,706 | 29.08 | 1,795 | 58.20 | ||||
| 2025-07-18 | 13F | Precision Wealth Strategies, LLC | 17,926 | 173 | ||||||
| 2025-08-13 | 13F | Northern Trust Corp | 182,543 | -12.13 | 1,762 | -1.29 | ||||
| 2025-08-14 | 13F | Peak6 Llc | Put | 2,054,300 | 220.58 | 19,824 | 260.16 | |||
| 2025-08-14 | 13F | Peak6 Llc | Call | 1,500,700 | -1.51 | 14,482 | 10.64 | |||
| 2025-08-14 | 13F | State Street Corp | 829,348 | -1.02 | 8,003 | 11.20 | ||||
| 2025-08-14 | 13F | Jane Street Group, Llc | Call | 2,950,900 | 75.21 | 28,476 | 96.83 | |||
| 2025-08-14 | 13F | Goldman Sachs Group Inc | Call | 0 | -100.00 | 0 | -100.00 | |||
| 2025-08-14 | 13F | Jane Street Group, Llc | 5,857,764 | 25.25 | 56,527 | 40.70 | ||||
| 2025-08-14 | 13F | Jane Street Group, Llc | Put | 5,980,000 | 111.02 | 57,707 | 137.07 | |||
| 2025-08-14 | 13F | Qube Research & Technologies Ltd | 460,203 | 4,441 | ||||||
| 2025-07-31 | 13F | Sparta 24 Ltd. | 6,260,946 | 71.20 | 60,418 | 92.33 | ||||
| 2025-08-28 | NP | EWX - SPDR(R) S&P(R) EMERGING MARKETS SMALL CAP ETF | 72,529 | -4.60 | 700 | 7.04 | ||||
| 2025-08-08 | 13F | SBI Securities Co., Ltd. | 6,382 | 22.66 | 62 | 38.64 | ||||
| 2025-08-14 | 13F | Optiver Holding B.V. | 0 | -100.00 | 0 | |||||
| 2025-05-15 | 13F | Barclays Plc | Put | 0 | -100.00 | 0 | -100.00 | |||
| 2025-08-08 | 13F | Quinn Opportunity Partners LLC | 628,921 | 9.28 | 6,069 | 22.78 | ||||
| 2025-08-13 | 13F | CMT Capital Markets Trading GmbH | Call | 60,000 | -34.64 | 1 | ||||
| 2025-08-13 | 13F | CMT Capital Markets Trading GmbH | Put | 12,200 | -97.94 | 0 | -100.00 | |||
| 2025-08-07 | 13F | Profund Advisors Llc | 60,455 | -7.57 | 583 | 3.92 | ||||
| 2025-08-14 | 13F | Diversify Advisory Services, LLC | 54,651 | 42.39 | 552 | 74.37 | ||||
| 2025-08-14 | 13F | Balyasny Asset Management Llc | 245,929 | 2,373 | ||||||
| 2025-07-15 | 13F | Public Employees Retirement System Of Ohio | 19,000 | -11.21 | 183 | 0.00 | ||||
| 2025-08-01 | 13F | Belvedere Trading LLC | Call | 0 | -100.00 | 0 | ||||
| 2025-06-27 | 13F/A | Goldman Sachs Group Inc | Put | 0 | -100.00 | 0 | -100.00 | |||
| 2025-08-06 | 13F | First Horizon Advisors, Inc. | 5,433 | 52 | ||||||
| 2025-07-22 | 13F | IMC-Chicago, LLC | Put | 969,700 | 33.04 | 9,358 | 49.45 | |||
| 2025-07-22 | 13F | IMC-Chicago, LLC | Call | 3,169,300 | 375.94 | 30,584 | 434.67 | |||
| 2025-08-13 | 13F | Quantbot Technologies LP | 72,680 | -29.68 | 701 | -20.97 | ||||
| 2025-08-14 | 13F | CIBC World Markets Inc. | 0 | -100.00 | 0 | |||||
| 2025-08-11 | 13F | Cornerstone Planning Group LLC | 309 | 0.00 | 3 | 50.00 | ||||
| 2025-05-05 | 13F | Hollencrest Capital Management | 0 | -100.00 | 0 | |||||
| 2025-08-13 | 13F | HAP Trading, LLC | Put | 10,200 | 1 |