Mga Batayang Estadistika
| Pemilik Institusional | 167 total, 164 long only, 0 short only, 3 long/short - change of 23.70% MRQ |
| Alokasi Portofolio Rata-rata | 0.1421 % - change of 7.82% MRQ |
| Saham Institusional (Jangka Panjang) | 28,671,717 (ex 13D/G) - change of 8.72MM shares 43.69% MRQ |
| Nilai Institusional (Jangka Panjang) | $ 346,216 USD ($1000) |
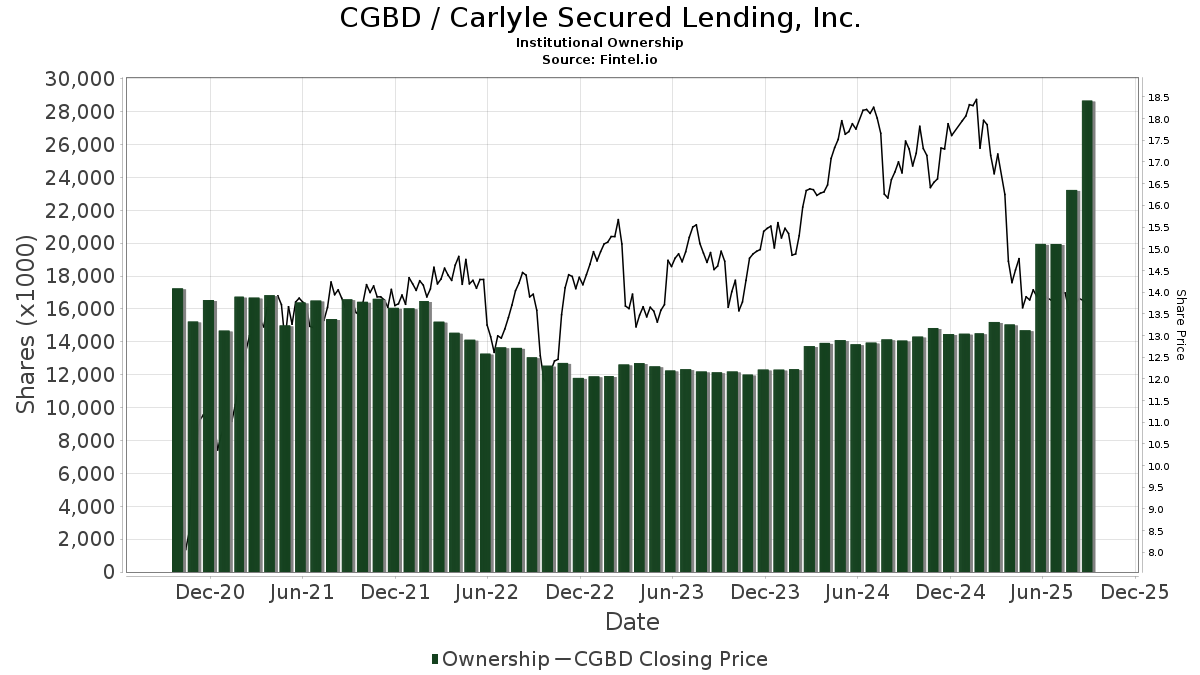
Kepemilikan Institusional dan Pemegang Saham
Carlyle Secured Lending, Inc. (US:CGBD) memiliki 167 pemilik institusional dan pemegang saham yang telah mengajukan formulir 13D/G atau 13F kepada Komisi Bursa Efek (Securities Exchange Commission/SEC). Lembaga-lembaga ini memegang total 28,671,717 saham. Pemegang saham terbesar meliputi Creative Planning, Morgan Stanley, Prime Capital Investment Advisors, LLC, Van Eck Associates Corp, BIZD - VanEck Vectors BDC Income ETF, Rsm Us Wealth Management Llc, Lsv Asset Management, Bank Of America Corp /de/, Invesco Ltd., and KBWD - Invesco KBW High Dividend Yield Financial ETF .
Struktur kepemilikan institusional Carlyle Secured Lending, Inc. (NasdaqGS:CGBD) menunjukkan posisi terkini di perusahaan oleh institusi dan dana, serta perubahan terbaru dalam ukuran posisi. Pemegang saham utama dapat mencakup investor individu, reksa dana, dana lindung nilai, atau institusi. Jadwal 13D menunjukkan bahwa investor memegang (atau pernah memegang) lebih dari 5% saham perusahaan dan bermaksud (atau pernah bermaksud) untuk secara aktif mengejar perubahan strategi bisnis. Jadwal 13G menunjukkan investasi pasif lebih dari 5%.
The share price as of September 5, 2025 is 13.79 / share. Previously, on September 6, 2024, the share price was 16.66 / share. This represents a decline of 17.23% over that period.
Skor Sentimen Dana
Skor Sentimen Dana (sebelumnya dikenal sebagai Skor Akumulasi Kepemilikan) menemukan saham-saham yang paling banyak dibeli oleh dana. Ini adalah hasil dari model kuantitatif multi-faktor yang canggih yang mengidentifikasi perusahaan dengan tingkat akumulasi institusional tertinggi. Model penilaian menggunakan kombinasi dari total peningkatan pemilik yang diungkapkan, perubahan dalam alokasi portofolio pada pemilik tersebut, dan metrik lainnya. Angka berkisar dari 0 hingga 100, dengan angka yang lebih tinggi menunjukkan tingkat akumulasi yang lebih tinggi dibandingkan dengan perusahaan sejenisnya, dan 50 adalah rata-ratanya.
Frekuensi Pembaruan: Setiap Hari
Lihat Ownership Explorer, yang menyediakan daftar perusahaan dengan peringkat tertinggi.
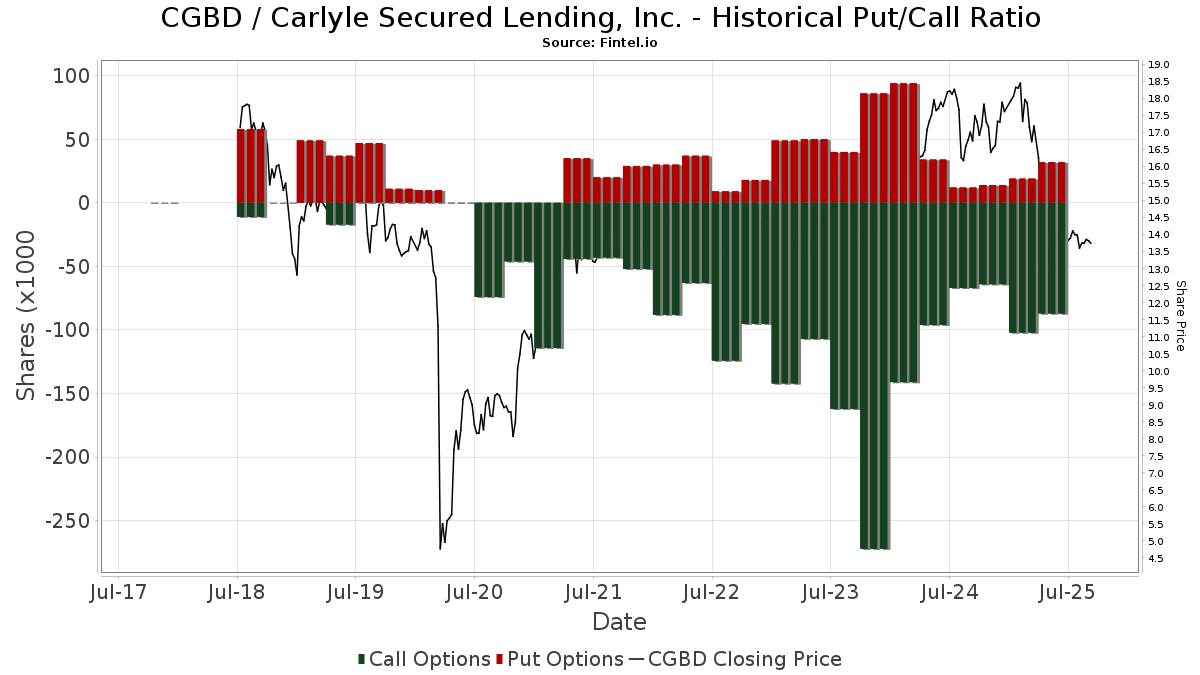
Rasio Put/Call Institusional
Selain melaporkan isu ekuitas dan utang standar, institusi dengan aset di bawah manajemen lebih dari 100 juta dolar AS juga harus mengungkapkan kepemilikan opsi put dan call mereka. Karena opsi put umumnya menunjukkan sentimen negatif, dan opsi call menunjukkan sentimen positif, kita dapat mengetahui sentimen institusional secara keseluruhan dengan memplot rasio put terhadap call. Grafik di sebelah kanan memplot rasio put/call historis untuk instrumen ini.
Menggunakan Rasio Put/Call sebagai indikator sentimen investor mengatasi salah satu kekurangan utama dari penggunaan total kepemilikan institusional, yaitu sejumlah besar aset yang dikelola diinvestasikan secara pasif untuk melacak indeks. Dana yang dikelola secara pasif biasanya tidak membeli opsi, sehingga indikator rasio put/call lebih akurat dalam melacak sentimen dana yang dikelola secara aktif.
Pengajuan 13F dan NPORT
Detail pada pengajuan 13F tersedia gratis. Detail pada pengajuan NP memerlukan keanggotaan premium. Baris berwarna hijau menunjukkan posisi baru. Baris berwarna merah menunjukkan posisi yang sudah ditutup. Klik tautan ini ikon untuk melihat riwayat transaksi selengkapnya.
Tingkatkan
untuk membuka data premium dan mengekspor ke Excel ![]() .
.
| Tanggal File | Sumber | Investor | Ketik | Presyo ng Avg (Silangan) |
Saham | Δ Saham (%) |
Dilaporkan Nilai ($1000) |
Nilai Δ (%) |
Alokasi Port (%) |
|
|---|---|---|---|---|---|---|---|---|---|---|
| 2025-08-14 | 13F | Brevan Howard Capital Management LP | 10,592 | 145 | ||||||
| 2025-08-06 | 13F | Smh Capital Advisors Inc | 21,925 | 300 | ||||||
| 2025-05-14 | 13F | Virtus ETF Advisers LLC | 0 | -100.00 | 0 | |||||
| 2025-07-08 | 13F | Nbc Securities, Inc. | 400 | 0.00 | 0 | |||||
| 2025-08-11 | 13F | United Advisor Group, LLC | 26,115 | 9.18 | 357 | -7.75 | ||||
| 2025-08-12 | 13F | Pathstone Holdings, LLC | 76,065 | 2.19 | 1,041 | -13.62 | ||||
| 2025-08-11 | 13F | Heritage Wealth Advisors | 2,100 | 0.00 | 29 | -15.15 | ||||
| 2025-08-14 | 13F | Sunbelt Securities, Inc. | 8,797 | -14.57 | 158 | -5.42 | ||||
| 2025-07-17 | 13F | Janney Montgomery Scott LLC | 35,804 | -0.78 | 0 | |||||
| 2025-07-25 | 13F | GFS Advisors, LLC | 49,700 | 680 | ||||||
| 2025-08-13 | 13F | Cerity Partners LLC | 10,698 | 1.84 | 146 | -13.61 | ||||
| 2025-07-09 | 13F | Triumph Capital Management | 49,845 | 19.73 | 682 | 1.19 | ||||
| 2025-08-15 | 13F | Tower Research Capital LLC (TRC) | 4,313 | 1,011.60 | 59 | 883.33 | ||||
| 2025-08-06 | 13F | Round Rock Advisors, LLC | 46,562 | 1.66 | 637 | -14.17 | ||||
| 2025-06-10 | 13F | Birchbrook, Inc. | 0 | -100.00 | 0 | -100.00 | ||||
| 2025-08-12 | 13F | Jpmorgan Chase & Co | 22,216 | -31.70 | 304 | -42.40 | ||||
| 2025-08-14 | 13F | Tudor Investment Corp Et Al | 219,146 | 376.09 | 2,998 | 302.82 | ||||
| 2025-05-14 | 13F | Group One Trading, L.p. | 0 | -100.00 | 0 | -100.00 | ||||
| 2025-08-14 | 13F | Macquarie Group Ltd | 12,900 | -80.03 | 176 | -83.16 | ||||
| 2025-07-10 | 13F | Wealth Enhancement Advisory Services, Llc | 15,341 | -19.89 | 214 | -34.26 | ||||
| 2025-07-31 | 13F | Caitong International Asset Management Co., Ltd | 227 | 440.48 | 3 | |||||
| 2025-08-04 | 13F | Muzinich & Co., Inc. | 352,617 | 81.09 | 4,824 | 53.11 | ||||
| 2025-07-30 | 13F | Denali Advisors Llc | 132,433 | -2.65 | 1,812 | -17.72 | ||||
| 2025-07-23 | 13F | Prime Capital Investment Advisors, LLC | 2,204,508 | 30,158 | ||||||
| 2025-08-08 | 13F | Creative Planning | 4,916,335 | 0.90 | 67,255 | -14.69 | ||||
| 2025-08-15 | 13F | WealthCollab, LLC | 0 | -100.00 | 0 | |||||
| 2025-08-13 | 13F | Advisory Research Inc | 10,387 | 142 | ||||||
| 2025-08-14 | 13F | Group One Trading, L.p. | Put | 2,200 | 120.00 | 30 | 87.50 | |||
| 2025-08-14 | 13F | Group One Trading, L.p. | Call | 18,700 | 46.09 | 256 | 23.19 | |||
| 2025-08-14 | 13F | Ieq Capital, Llc | 45,745 | 26.54 | 626 | 7.02 | ||||
| 2025-08-28 | NP | Cliffwater Corporate Lending Fund | 548,617 | 7,505 | ||||||
| 2025-08-14 | 13F | UBS Group AG | 567,546 | 37.89 | 7,764 | 16.59 | ||||
| 2025-08-14 | 13F | Keebeck Wealth Management, LLC | 31,000 | 0.00 | 436 | -12.97 | ||||
| 2025-07-17 | 13F | Patton Albertson Miller Group, Llc | 25,114 | 344 | ||||||
| 2025-07-18 | 13F | Trust Co Of Vermont | 1,080 | 0.00 | 15 | -17.65 | ||||
| 2025-07-10 | 13F | Redhawk Wealth Advisors, Inc. | 0 | -100.00 | 0 | |||||
| 2025-08-05 | 13F | Simplex Trading, Llc | 1,199 | 184.80 | 0 | |||||
| 2025-08-05 | 13F | Simplex Trading, Llc | Call | 7,300 | -26.26 | 0 | ||||
| 2025-07-29 | 13F | International Assets Investment Management, Llc | 18,125 | 0.00 | 248 | -15.70 | ||||
| 2025-08-05 | 13F | Simplex Trading, Llc | Put | 6,000 | 25.00 | 0 | ||||
| 2025-08-28 | NP | TRIFX - Catalyst/SMH Total Return Income Fund Class A | 7,087 | 97 | ||||||
| 2025-08-14 | 13F | Ameriprise Financial Inc | 190,921 | 2.48 | 2,612 | -13.37 | ||||
| 2025-05-02 | 13F | BluePointe Capital Management, LLC | 61,517 | 4.86 | 1,024 | -5.01 | ||||
| 2025-07-28 | 13F | Naviter Wealth, LLC | 90,991 | 1,277 | ||||||
| 2025-07-14 | 13F | Gries Financial Llc | 197,240 | 0.00 | 2,698 | -15.45 | ||||
| 2025-08-11 | 13F | FineMark National Bank & Trust | 40,381 | -2.99 | 552 | -17.98 | ||||
| 2025-04-22 | 13F | Bright Futures Wealth Management, LLC. | 57,064 | -6.92 | 805 | -28.28 | ||||
| 2025-08-13 | 13F | Mackenzie Financial Corp | 25,898 | 3.22 | 354 | -12.59 | ||||
| 2025-07-11 | 13F | Kingstone Capital Partners Texas, LLC | 410,472 | 6 | ||||||
| 2025-08-18 | 13F/A | National Bank Of Canada /fi/ | 12,424 | 3,608.66 | 170 | 3,280.00 | ||||
| 2025-08-13 | 13F | PharVision Advisers, LLC | 14,041 | 192 | ||||||
| 2025-08-14 | 13F | GWM Advisors LLC | 161 | 0.00 | 2 | 0.00 | ||||
| 2025-08-14 | 13F | Great Valley Advisor Group, Inc. | 11,100 | -4.84 | 152 | -19.68 | ||||
| 2025-08-12 | 13F | Proequities, Inc. | Put | 0 | 0 | |||||
| 2025-08-12 | 13F | Proequities, Inc. | Call | 0 | 0 | |||||
| 2025-08-12 | 13F | Proequities, Inc. | 0 | 0 | ||||||
| 2025-08-13 | 13F | Quantbot Technologies LP | 10,664 | 146 | ||||||
| 2025-08-13 | 13F | Virtus Investment Advisers, Inc. | 63,217 | 21.59 | 865 | 2.73 | ||||
| 2025-05-15 | 13F | Talon Private Wealth, LLC | 0 | -100.00 | 0 | -100.00 | ||||
| 2025-08-07 | 13F | Acadian Asset Management Llc | 11 | 0.00 | 0 | |||||
| 2025-08-11 | 13F | Lsv Asset Management | 860,563 | -31.49 | 12 | -45.00 | ||||
| 2025-08-14 | 13F | BI Asset Management Fondsmaeglerselskab A/S | 219,176 | 9,270.50 | 3 | |||||
| 2025-08-12 | 13F | Virtu Financial LLC | 33,023 | 74.11 | 0 | |||||
| 2025-07-24 | 13F | Us Bancorp \de\ | 50,000 | 0.00 | 684 | -15.45 | ||||
| 2025-08-14 | 13F | Goldman Sachs Group Inc | 22,529 | 308 | ||||||
| 2025-08-13 | 13F | Jump Financial, LLC | 13,100 | 179 | ||||||
| 2025-08-13 | 13F | Fisher Asset Management, LLC | 22,461 | 0.89 | 307 | -14.72 | ||||
| 2025-08-04 | 13F | Arkadios Wealth Advisors | 32,410 | 0.00 | 443 | -15.46 | ||||
| 2025-08-05 | 13F | Dunhill Financial, LLC | 498 | 0.00 | 7 | -25.00 | ||||
| 2025-08-08 | 13F | Cetera Investment Advisers | 67,124 | 15.34 | 918 | -2.44 | ||||
| 2025-04-29 | 13F | Raleigh Capital Management Inc. | 0 | -100.00 | 0 | |||||
| 2025-08-13 | 13F | ExodusPoint Capital Management, LP | 0 | -100.00 | 0 | |||||
| 2025-08-14 | 13F | Aquatic Capital Management LLC | 34,407 | 33.84 | 471 | 13.25 | ||||
| 2025-08-12 | 13F | Putnam Fl Investment Management Co | 34,483 | 472 | ||||||
| 2025-08-14 | 13F | Royal Bank Of Canada | 266,213 | -3.41 | 3,642 | -18.34 | ||||
| 2025-08-12 | 13F | SRS Capital Advisors, Inc. | 716 | 0.00 | 10 | -18.18 | ||||
| 2025-05-30 | NP | SMVIX - Simt Small Cap Value Fund Class I | 17,503 | -8.56 | 283 | -17.49 | ||||
| 2025-08-27 | NP | OASVX - Optimum Small-mid Cap Value Fund Class A | 13,100 | -79.72 | 179 | -82.87 | ||||
| 2025-08-14 | 13F | MGB Wealth Management, LLC | 0 | -100.00 | 0 | |||||
| 2025-08-14 | 13F | Van Eck Associates Corp | 1,785,996 | 48.36 | 24 | 26.32 | ||||
| 2025-07-21 | 13F | Ameritas Advisory Services, LLC | 750 | 10 | ||||||
| 2025-08-13 | 13F | Cliffwater LLC | 548,617 | 7,505 | ||||||
| 2025-08-13 | 13F | Quadrature Capital Ltd | 0 | -100.00 | 0 | |||||
| 2025-08-14 | 13F | Summit Trail Advisors, Llc | 146,027 | 2,056 | ||||||
| 2025-08-14 | 13F | Mariner, LLC | 543,376 | 7,433 | ||||||
| 2025-07-23 | 13F | Hager Investment Management Services, Llc | 236,263 | 4.46 | 3,232 | -11.67 | ||||
| 2025-08-14 | 13F | Raymond James Financial Inc | 177,462 | -3.63 | 2,428 | -18.53 | ||||
| 2025-08-14 | 13F | Stifel Financial Corp | 30,820 | -32.36 | 422 | -42.88 | ||||
| 2025-07-25 | 13F | Cwm, Llc | 6,836 | 0.50 | 0 | |||||
| 2025-08-14 | 13F | Rivernorth Capital Management, Llc | 357,013 | 4,884 | ||||||
| 2025-05-12 | 13F | Eagle Global Advisors Llc | 0 | -100.00 | 0 | |||||
| 2025-08-13 | 13F | Northern Trust Corp | 19,401 | 265 | ||||||
| 2025-08-15 | 13F | Caxton Associates Llp | 29,445 | 0.00 | 403 | -15.55 | ||||
| 2025-07-28 | NP | KBWD - Invesco KBW High Dividend Yield Financial ETF This fund is a listed as child fund of Invesco Ltd. and if that institution has disclosed ownership in this security, then these positions will not be double counted when calculating total shares and total value | 615,591 | -1.86 | 8,649 | -22.40 | ||||
| 2025-08-11 | 13F | Citigroup Inc | 577 | -92.10 | 8 | -94.07 | ||||
| 2025-08-12 | 13F | XTX Topco Ltd | 0 | -100.00 | 0 | |||||
| 2025-04-02 | 13F | Marcum Wealth, LLC | 11,314 | 0.00 | 183 | -9.41 | ||||
| 2025-07-23 | 13F | Eagle Strategies LLC | 14,863 | 203 | ||||||
| 2025-08-12 | 13F | LPL Financial LLC | 90,409 | 9.64 | 1,237 | -7.35 | ||||
| 2025-08-14 | 13F | Bnp Paribas Arbitrage, Sa | 12,650 | 173 | ||||||
| 2025-08-12 | 13F | Aigen Investment Management, Lp | 14,436 | 197 | ||||||
| 2025-03-28 | NP | DVDN - Kingsbarn Dividend Opportunity ETF | 0 | -100.00 | 0 | -100.00 | ||||
| 2025-07-14 | 13F | Toth Financial Advisory Corp | 0 | -100.00 | 0 | |||||
| 2025-08-14 | 13F | Wells Fargo & Company/mn | 34,053 | -0.69 | 466 | -16.06 | ||||
| 2025-07-11 | 13F | Farther Finance Advisors, LLC | 1,050 | 14 | ||||||
| 2025-08-08 | 13F | Condor Capital Management | 175,506 | -36.27 | 2,401 | -46.14 | ||||
| 2025-06-26 | NP | LSVQX - LSV Small Cap Value Fund Institutional Class Shares | 95,900 | 6.20 | 1,416 | -15.46 | ||||
| 2025-06-26 | NP | LSVGX - LSV Global Value Fund Institutional Class Shares | 17,200 | 0.00 | 254 | -20.38 | ||||
| 2025-05-06 | 13F | Kovack Advisors, Inc. | 0 | -100.00 | 0 | |||||
| 2025-07-18 | 13F | Truist Financial Corp | 64,957 | 0.00 | 889 | -15.51 | ||||
| 2025-07-31 | 13F | Cambridge Investment Research Advisors, Inc. | 15,391 | 0.27 | 0 | |||||
| 2025-08-12 | 13F | Legal & General Group Plc | 459,870 | 38.44 | 6,291 | 17.13 | ||||
| 2025-07-29 | 13F | Novare Capital Management Llc | 194,680 | 10.64 | 2,663 | -6.43 | ||||
| 2025-08-07 | 13F | Cascade Financial Partners, LLC | 43,840 | 600 | ||||||
| 2025-07-14 | 13F | U.S. Capital Wealth Advisors, LLC | 13,850 | 34.34 | 189 | 13.86 | ||||
| 2025-07-25 | 13F | 1858 Wealth Management, Llc | 41,343 | 566 | ||||||
| 2025-08-07 | 13F | Allworth Financial LP | 2,528 | 0.00 | 35 | -5.56 | ||||
| 2025-08-14 | 13F | Oxford Asset Management Llp | 37,198 | 509 | ||||||
| 2025-08-06 | 13F | Savant Capital, LLC | 18,874 | 3.15 | 258 | -12.84 | ||||
| 2025-07-31 | 13F | Sumitomo Mitsui Trust Holdings, Inc. | 264,138 | 44.02 | 3,613 | 21.77 | ||||
| 2025-07-31 | 13F/A | Avion Wealth | 500 | 0.00 | 0 | |||||
| 2025-04-11 | 13F | Herbst Group, Llc | 0 | -100.00 | 0 | |||||
| 2025-07-17 | 13F | HB Wealth Management, LLC | 11,790 | 0.00 | 161 | -15.26 | ||||
| 2025-08-14 | 13F | Two Sigma Advisers, Lp | 334,700 | -35.24 | 4,579 | -45.25 | ||||
| 2025-08-13 | 13F | Rsm Us Wealth Management Llc | 1,458,028 | 20,529 | ||||||
| 2025-08-12 | 13F | MAI Capital Management | 20,797 | 285 | ||||||
| 2025-07-14 | 13F | AdvisorNet Financial, Inc | 11,163 | -57.17 | 153 | -63.90 | ||||
| 2025-08-07 | 13F | Hennion & Walsh Asset Management, Inc. | 116,342 | -0.25 | 1,592 | -15.69 | ||||
| 2025-08-14 | 13F | Quarry LP | 4,636 | 130.99 | 63 | 96.88 | ||||
| 2025-08-01 | 13F | Y-Intercept (Hong Kong) Ltd | 180,466 | 2,469 | ||||||
| 2025-08-04 | 13F | Canton Hathaway, LLC | 0 | -100.00 | 0 | |||||
| 2025-07-31 | 13F | MQS Management LLC | 38,917 | 532 | ||||||
| 2025-07-02 | 13F | Doliver Advisors, Lp | 122,581 | 1,677 | ||||||
| 2025-08-12 | 13F | BlackRock, Inc. | 264,185 | 33.88 | 3,614 | 13.22 | ||||
| 2025-06-27 | NP | LBO - WHITEWOLF Publicly Listed Private Equity ETF | 5,481 | 14.26 | 81 | -10.11 | ||||
| 2025-07-23 | 13F | PARK CIRCLE Co | 71,225 | 0.00 | 974 | -15.45 | ||||
| 2025-08-12 | 13F | Magnetar Financial LLC | 34,727 | 475 | ||||||
| 2025-08-11 | 13F | Greenland Capital Management LP | 0 | -100.00 | 0 | |||||
| 2025-08-14 | 13F | Mercer Global Advisors Inc /adv | 17,890 | 245 | ||||||
| 2025-08-13 | 13F | Lido Advisors, LLC | 52,234 | 735 | ||||||
| 2025-08-14 | 13F | Susquehanna International Group, Llp | Call | 10,700 | -75.40 | 146 | -79.23 | |||
| 2025-08-18 | 13F | Wolverine Trading, Llc | Call | 0 | -100.00 | 0 | ||||
| 2025-05-15 | 13F | Parvin Asset Management, LLC | 0 | -100.00 | 0 | |||||
| 2025-08-14 | 13F | Susquehanna International Group, Llp | 50,389 | 689 | ||||||
| 2025-07-29 | 13F | Arista Wealth Management, LLC | 17,573 | 240 | ||||||
| 2025-07-15 | 13F | Clarus Group, Inc. | 21,291 | 0.00 | 291 | -15.41 | ||||
| 2025-07-25 | 13F | Apollon Wealth Management, LLC | 32,590 | 36.46 | 446 | 15.28 | ||||
| 2025-08-11 | 13F | HighTower Advisors, LLC | 70,945 | 0.77 | 971 | -14.84 | ||||
| 2025-07-29 | 13F | Activest Wealth Management | 8,125 | -40.80 | 111 | -50.00 | ||||
| 2025-08-11 | 13F | EMC Capital Management | 6,521 | -49.92 | 0 | |||||
| 2025-07-21 | 13F | Catalina Capital Group, LLC | 19,239 | 263 | ||||||
| 2025-08-14 | 13F | Qube Research & Technologies Ltd | 152,607 | 376.17 | 2,088 | 302.90 | ||||
| 2025-08-12 | 13F | Trexquant Investment LP | 0 | -100.00 | 0 | |||||
| 2025-08-01 | 13F | Transcend Wealth Collective, Llc | 25,015 | 342 | ||||||
| 2025-08-12 | 13F | YANKCOM Partnership | 64 | 0.00 | 1 | -100.00 | ||||
| 2025-04-17 | 13F | Grimes & Company, Inc. | 0 | -100.00 | 0 | -100.00 | ||||
| 2025-08-04 | 13F | Assetmark, Inc | 0 | -100.00 | 0 | |||||
| 2025-08-14 | 13F | Two Sigma Investments, Lp | 242,989 | -29.73 | 3,324 | -40.59 | ||||
| 2025-08-13 | 13F | Invesco Ltd. | 779,586 | 18.50 | 10,665 | 0.19 | ||||
| 2025-08-21 | NP | BIZD - VanEck Vectors BDC Income ETF | 1,651,647 | 47.15 | 22,595 | 24.42 | ||||
| 2025-08-12 | 13F | Steward Partners Investment Advisory, Llc | 32,249 | 71.99 | 441 | 45.54 | ||||
| 2025-08-14 | 13F | AllSquare Wealth Management LLC | 1,400 | 0.00 | 19 | -13.64 | ||||
| 2025-07-17 | 13F | Sound Income Strategies, LLC | 1,191 | 0.00 | 16 | -15.79 | ||||
| 2025-08-12 | 13F | Dynamic Technology Lab Private Ltd | 37,061 | 507 | ||||||
| 2025-08-15 | 13F | Morgan Stanley | 2,295,522 | -2.29 | 31,403 | -17.38 | ||||
| 2025-08-13 | 13F | Northwestern Mutual Wealth Management Co | 2,630 | 71.90 | 36 | 45.83 | ||||
| 2025-05-15 | 13F | Glenmede Trust Co Na | 32,175 | -7.62 | 521 | -16.67 | ||||
| 2025-08-29 | 13F | Total Investment Management Inc | 1 | 0 | ||||||
| 2025-09-04 | 13F/A | Advisor Group Holdings, Inc. | 54,125 | -11.47 | 741 | -25.18 | ||||
| 2025-08-11 | 13F | Universal- Beteiligungs- und Servicegesellschaft mbH | 102,650 | -21.34 | 1,404 | -33.49 | ||||
| 2025-07-31 | 13F | Whipplewood Advisors, LLC | 34,802 | 476 | ||||||
| 2025-08-06 | 13F | Commonwealth Equity Services, Llc | 34,003 | 9.31 | 0 | |||||
| 2025-08-14 | 13F | Comerica Bank | 88,367 | 0.00 | 1,209 | -15.47 | ||||
| 2025-06-25 | NP | VPC - Virtus Private Credit Strategy ETF | 47,489 | -10.15 | 701 | -28.54 | ||||
| 2025-08-28 | NP | AOG Institutional Diversified Fund | 34,483 | 472 | ||||||
| 2025-05-13 | 13F | Aptus Capital Advisors, LLC | 0 | -100.00 | 0 | |||||
| 2025-08-28 | NP | RNCOX - RiverNorth Core Opportunity Fund Class R | 17,446 | 239 | ||||||
| 2025-08-13 | 13F | Truvestments Capital Llc | 487 | 0.00 | 7 | -14.29 | ||||
| 2025-08-12 | 13F | Global Retirement Partners, LLC | 81,453 | 62.60 | 1,114 | 24.05 | ||||
| 2025-07-01 | 13F | Harbor Investment Advisory, Llc | 450 | -89.31 | 6 | -91.18 | ||||
| 2025-08-14 | 13F | Glenmede Investment Management, LP | 32,175 | 440 | ||||||
| 2025-08-14 | 13F | Bank Of America Corp /de/ | 795,522 | -25.08 | 10,883 | -36.66 | ||||
| 2025-08-07 | 13F | Connor, Clark & Lunn Investment Management Ltd. | 0 | -100.00 | 0 | |||||
| 2025-08-28 | NP | Rivernorth Opportunities Fund, Inc. | 126,873 | 1,736 | ||||||
| 2025-08-14 | 13F/A | Rockefeller Capital Management L.P. | 68,681 | 43.17 | 940 | 21.01 | ||||
| 2025-08-15 | 13F | Great West Life Assurance Co /can/ | 45,932 | 4.65 | 1 | |||||
| 2025-08-06 | 13F | Ethos Financial Group, LLC | 174,172 | 1.34 | 2,383 | -14.32 | ||||
| 2025-08-15 | 13F | CI Private Wealth, LLC | 167,300 | 2,289 | ||||||
| 2025-08-12 | 13F | Advisors Asset Management, Inc. | 223,857 | -9.86 | 3,062 | -23.79 | ||||
| 2025-08-06 | 13F | Financial Alternatives, Inc | 17,591 | 0.00 | 241 | -15.49 | ||||
| 2025-08-14 | 13F | Harwood Advisory Group, LLC | 0 | -100.00 | 0 | -100.00 | ||||
| 2025-08-15 | 13F | Northeast Financial Consultants Inc | 102,219 | 139.00 | 1,398 | 102.02 | ||||
| 2025-08-13 | 13F | Jones Financial Companies Lllp | 180 | 3 | ||||||
| 2025-08-14 | 13F | Citadel Advisors Llc | Call | 50,800 | 98.44 | 695 | 67.63 | |||
| 2025-08-14 | 13F | Citadel Advisors Llc | 41,015 | -76.64 | 561 | -80.25 | ||||
| 2025-08-14 | 13F | Citadel Advisors Llc | Put | 24,300 | 80.00 | 332 | 52.29 | |||
| 2025-08-28 | NP | RNDLX - RiverNorth/DoubleLine Strategic Income Fund Class R | 172,931 | 2,366 | ||||||
| 2025-07-18 | 13F | Chelsea Counsel Co | 340 | 0.00 | 5 | -20.00 | ||||
| 2025-08-01 | 13F | Envestnet Asset Management Inc | 67,308 | 9.07 | 921 | -7.82 | ||||
| 2025-07-31 | 13F | Catalyst Capital Advisors LLC | 7,087 | 97 | ||||||
| 2025-08-13 | 13F | SCS Capital Management LLC | 11,314 | 0.00 | 159 | -15.43 | ||||
| 2025-07-25 | 13F | Verdence Capital Advisors LLC | 40,413 | -1.35 | 553 | -16.62 |