Mga Batayang Estadistika
| Saham Institusional (Jangka Panjang) | 57,623,358 - 79.07% (ex 13D/G) - change of -1.52MM shares -2.56% MRQ |
| Nilai Institusional (Jangka Panjang) | $ 500,643 USD ($1000) |
Kepemilikan Institusional dan Pemegang Saham
Cognyte Software Ltd. (US:CGNT) memiliki 151 pemilik institusional dan pemegang saham yang telah mengajukan formulir 13D/G atau 13F kepada Komisi Bursa Efek (Securities Exchange Commission/SEC). Lembaga-lembaga ini memegang total 57,623,358 saham. Pemegang saham terbesar meliputi Topline Capital Management, LLC, Edenbrook Capital, LLC, American Capital Management Inc, Value Base Ltd., Neuberger Berman Group LLC, Acadian Asset Management Llc, Y.D. More Investments Ltd, NINAX - Neuberger Berman Intrinsic Value Fund Class A, William Blair Investment Management, Llc, and Driehaus Capital Management Llc .
Struktur kepemilikan institusional Cognyte Software Ltd. (NasdaqGS:CGNT) menunjukkan posisi terkini di perusahaan oleh institusi dan dana, serta perubahan terbaru dalam ukuran posisi. Pemegang saham utama dapat mencakup investor individu, reksa dana, dana lindung nilai, atau institusi. Jadwal 13D menunjukkan bahwa investor memegang (atau pernah memegang) lebih dari 5% saham perusahaan dan bermaksud (atau pernah bermaksud) untuk secara aktif mengejar perubahan strategi bisnis. Jadwal 13G menunjukkan investasi pasif lebih dari 5%.
The share price as of September 5, 2025 is 9.00 / share. Previously, on September 9, 2024, the share price was 7.44 / share. This represents an increase of 21.03% over that period.

Skor Sentimen Dana
Skor Sentimen Dana (sebelumnya dikenal sebagai Skor Akumulasi Kepemilikan) menemukan saham-saham yang paling banyak dibeli oleh dana. Ini adalah hasil dari model kuantitatif multi-faktor yang canggih yang mengidentifikasi perusahaan dengan tingkat akumulasi institusional tertinggi. Model penilaian menggunakan kombinasi dari total peningkatan pemilik yang diungkapkan, perubahan dalam alokasi portofolio pada pemilik tersebut, dan metrik lainnya. Angka berkisar dari 0 hingga 100, dengan angka yang lebih tinggi menunjukkan tingkat akumulasi yang lebih tinggi dibandingkan dengan perusahaan sejenisnya, dan 50 adalah rata-ratanya.
Frekuensi Pembaruan: Setiap Hari
Lihat Ownership Explorer, yang menyediakan daftar perusahaan dengan peringkat tertinggi.
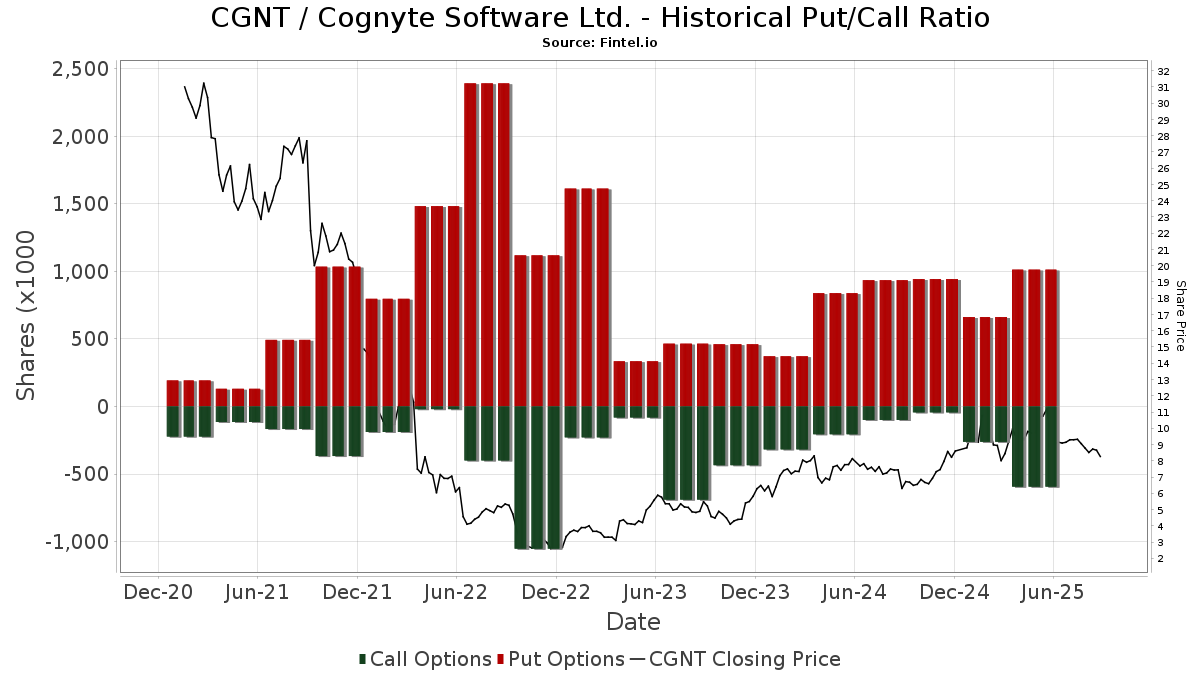
Rasio Put/Call Institusional
Selain melaporkan isu ekuitas dan utang standar, institusi dengan aset di bawah manajemen lebih dari 100 juta dolar AS juga harus mengungkapkan kepemilikan opsi put dan call mereka. Karena opsi put umumnya menunjukkan sentimen negatif, dan opsi call menunjukkan sentimen positif, kita dapat mengetahui sentimen institusional secara keseluruhan dengan memplot rasio put terhadap call. Grafik di sebelah kanan memplot rasio put/call historis untuk instrumen ini.
Menggunakan Rasio Put/Call sebagai indikator sentimen investor mengatasi salah satu kekurangan utama dari penggunaan total kepemilikan institusional, yaitu sejumlah besar aset yang dikelola diinvestasikan secara pasif untuk melacak indeks. Dana yang dikelola secara pasif biasanya tidak membeli opsi, sehingga indikator rasio put/call lebih akurat dalam melacak sentimen dana yang dikelola secara aktif.
Pengajuan 13D/G
Kami menyajikan pengajuan 13D/G secara terpisah dari pengajuan 13F karena perlakuan yang berbeda oleh SEC. Pengajuan 13D/G dapat diajukan oleh kelompok investor (dengan satu pemimpin), sedangkan pengajuan 13F tidak bisa. Hal ini mengakibatkan situasi di mana seorang investor dapat mengajukan 13D/G yang melaporkan satu nilai untuk total saham (mewakili semua saham yang dimiliki oleh kelompok investor), tetapi kemudian mengajukan 13F yang melaporkan nilai yang berbeda untuk total saham (mewakili kepemilikan mereka sendiri). Ini berarti bahwa kepemilikan saham dari pengajuan 13D/G dan pengajuan 13F seringkali tidak dapat dibandingkan secara langsung, sehingga kami menyajikannya secara terpisah.
Catatan: Mulai 16 Mei 2021, kami tidak lagi menampilkan pemilik yang belum mengajukan 13D/G dalam setahun terakhir. Sebelumnya, kami menampilkan riwayat lengkap pengajuan 13D/G. Secara umum, entitas yang diwajibkan untuk mengajukan pengajuan 13D/G harus mengajukan setidaknya setiap tahun sebelum mengirimkan pengajuan penutupan. Namun, terkadang dana keluar dari posisi tanpa mengirimkan pengajuan penutupan (misalnya, mereka menghentikan operasi), sehingga menampilkan riwayat lengkap terkadang menyebabkan kebingungan tentang kepemilikan saat ini. Untuk mencegah kebingungan, kami sekarang hanya menampilkan pemilik 'saat ini' - yaitu - pemilik yang telah mengajukan dalam setahun terakhir.
Upgrade to unlock premium data.
| Tanggal File | Formulir | Investor | Sebelumnya Saham |
Terbaru Saham |
Δ Saham (Persen) |
Kepemilikan (Persen) |
Δ Pagmamay-ari (Persen) |
|
|---|---|---|---|---|---|---|---|---|
| 2025-07-08 | Legal & General Investment Management Ltd | 4,033,757 | 3,962,838 | -1.76 | 5.91 | 3.14 | ||
| 2025-05-15 | AMERICAN CAPITAL MANAGEMENT INC | 5,802,415 | 6,665,590 | 14.88 | 9.30 | 13.41 | ||
| 2024-11-14 | Legal & General Group Plc | 0 | 0.00 | |||||
| 2024-11-12 | Senvest Management, LLC | 3,582,753 | 1,459,825 | -59.25 | 2.00 | -60.00 | ||
| 2024-10-07 | Topline Capital Management, LLC | 3,754,643 | 9,020,184 | 140.24 | 12.50 | 140.38 | ||
| 2024-09-16 | Value Base Ltd. | 9.53 | 2.14 |
Pengajuan 13F dan NPORT
Detail pada pengajuan 13F tersedia gratis. Detail pada pengajuan NP memerlukan keanggotaan premium. Baris berwarna hijau menunjukkan posisi baru. Baris berwarna merah menunjukkan posisi yang sudah ditutup. Klik tautan ini ikon untuk melihat riwayat transaksi selengkapnya.
Tingkatkan
untuk membuka data premium dan mengekspor ke Excel ![]() .
.
| Tanggal File | Sumber | Investor | Ketik | Presyo ng Avg (Silangan) |
Saham | Δ Saham (%) |
Dilaporkan Nilai ($1000) |
Nilai Δ (%) |
Alokasi Port (%) |
|
|---|---|---|---|---|---|---|---|---|---|---|
| 2025-08-14 | 13F | Group One Trading, L.p. | 34,843 | 322 | ||||||
| 2025-07-09 | 13F | Silverberg Bernstein Capital Management LLC | 152,100 | 41.09 | 1,405 | 67.26 | ||||
| 2025-08-14 | 13F | Kent Lake PR LLC | 200,000 | -52.19 | 1,848 | -43.35 | ||||
| 2025-08-14 | 13F | Legato Capital Management LLC | 101,547 | -0.24 | 938 | 18.14 | ||||
| 2025-08-12 | 13F | Franklin Resources Inc | 15,033 | 0.00 | 139 | 17.95 | ||||
| 2025-08-14 | 13F | Group One Trading, L.p. | Put | 24,200 | 2,100.00 | 224 | 2,687.50 | |||
| 2025-08-14 | 13F | Group One Trading, L.p. | Call | 48,900 | -21.51 | 452 | -7.01 | |||
| 2025-08-13 | 13F | Virtus ETF Advisers LLC | 4,086 | 38 | ||||||
| 2025-08-12 | 13F | Magnetar Financial LLC | 37,375 | 174.59 | 345 | 225.47 | ||||
| 2025-07-08 | 13F | Parallel Advisors, LLC | 408 | 0.00 | 4 | 0.00 | ||||
| 2025-08-08 | 13F | Geode Capital Management, Llc | 51,122 | -47.43 | 472 | -37.73 | ||||
| 2025-08-11 | 13F | Public Employees Retirement Association Of Colorado | 4,835 | 0.00 | 0 | |||||
| 2025-08-12 | 13F | Jpmorgan Chase & Co | 582,139 | 36.27 | 5,379 | 61.40 | ||||
| 2025-07-31 | 13F | Value Base Ltd. | 5,719,187 | 0.00 | 52,845 | 18.46 | ||||
| 2025-07-24 | NP | ONEQ - Fidelity Nasdaq Composite Index Tracking Stock This fund is a listed as child fund of Fmr Llc and if that institution has disclosed ownership in this security, then these positions will not be double counted when calculating total shares and total value | 46,888 | -5.27 | 511 | 15.61 | ||||
| 2025-08-12 | 13F | Coldstream Capital Management Inc | 0 | -100.00 | 0 | |||||
| 2025-08-21 | NP | LUSIX - Lazard US Systematic Small Cap Equity Portfolio Institutional Shares | 3,980 | -55.53 | 37 | 0.00 | ||||
| 2025-07-31 | 13F | Caitong International Asset Management Co., Ltd | 622 | 75.71 | 6 | 150.00 | ||||
| 2025-08-01 | 13F | Y-Intercept (Hong Kong) Ltd | 191,223 | 144.56 | 1,767 | 189.98 | ||||
| 2025-08-07 | 13F | Connor, Clark & Lunn Investment Management Ltd. | 1,083,646 | 19.33 | 10,013 | 41.35 | ||||
| 2025-05-13 | 13F | Fox Run Management, L.l.c. | 0 | -100.00 | 0 | -100.00 | ||||
| 2025-08-14 | 13F | Nebula Research & Development LLC | 26,720 | 247 | ||||||
| 2025-07-24 | 13F | Us Bancorp \de\ | 5,682 | -28.25 | 53 | -14.75 | ||||
| 2025-08-12 | 13F | Essex Investment Management Co Llc | 340,470 | -0.72 | 3,146 | 17.61 | ||||
| 2025-08-14 | 13F | Graham Capital Management, L.P. | 10,168 | -68.87 | 94 | -63.39 | ||||
| 2025-08-13 | 13F | Shelton Capital Management | 23,594 | 0.71 | 218 | 19.78 | ||||
| 2025-08-13 | 13F | New York State Common Retirement Fund | 93,978 | 0.00 | 1 | |||||
| 2025-08-22 | NP | COLUMBIA FUNDS VARIABLE INSURANCE TRUST - Columbia Variable Portfolio - Small Cap Value Fund Class 1 | 137,809 | 1.92 | 1,273 | 20.78 | ||||
| 2025-06-24 | NP | ESCKX - 1290 Essex Small Cap Growth Fund Class R | 75,436 | 1.08 | 739 | 6.48 | ||||
| 2025-08-13 | 13F | Quadrant Capital Group Llc | 0 | -100.00 | 0 | |||||
| 2025-08-14 | 13F | Wells Fargo & Company/mn | 5,445 | 0.00 | 50 | 19.05 | ||||
| 2025-06-30 | NP | PRFZ - Invesco FTSE RAFI US 1500 Small-Mid ETF This fund is a listed as child fund of Invesco Ltd. and if that institution has disclosed ownership in this security, then these positions will not be double counted when calculating total shares and total value | 59,744 | -28.47 | 585 | -24.71 | ||||
| 2025-04-15 | 13F | SJS Investment Consulting Inc. | 0 | -100.00 | 0 | -100.00 | ||||
| 2025-09-04 | 13F/A | Advisor Group Holdings, Inc. | 3,634 | 79.37 | 34 | 120.00 | ||||
| 2025-06-30 | NP | PDN - Invesco FTSE RAFI Developed Markets ex-U.S. Small-Mid ETF This fund is a listed as child fund of Invesco Ltd. and if that institution has disclosed ownership in this security, then these positions will not be double counted when calculating total shares and total value | 2,510 | 25 | ||||||
| 2025-07-16 | 13F | Signaturefd, Llc | 4,000 | 0.81 | 37 | 20.00 | ||||
| 2025-08-14 | 13F | Susquehanna Portfolio Strategies, LLC | 33,561 | 310 | ||||||
| 2025-08-14 | 13F/A | Skopos Labs, Inc. | 364 | 18.18 | 3 | 50.00 | ||||
| 2025-08-13 | 13F | Walleye Capital LLC | Call | 59,200 | 547 | |||||
| 2025-07-30 | 13F | Journey Advisory Group, LLC | 0 | -100.00 | 0 | |||||
| 2025-07-30 | 13F | Phoenix Holdings Ltd. | 218,981 | 0.00 | 2,023 | 18.44 | ||||
| 2025-08-14 | 13F | Man Group plc | 0 | -100.00 | 0 | |||||
| 2025-08-26 | NP | AZBAX - AllianzGI Small-Cap Fund Class A | 32,764 | 303 | ||||||
| 2025-08-13 | 13F | Marshall Wace, Llp | 756,876 | 77.54 | 6,994 | 110.32 | ||||
| 2025-08-27 | 13F/A | Squarepoint Ops LLC | Put | 605,900 | 0.98 | 5,599 | 19.62 | |||
| 2025-05-14 | 13F | Walleye Capital LLC | 0 | -100.00 | 0 | -100.00 | ||||
| 2025-08-27 | 13F/A | Squarepoint Ops LLC | 67,180 | -50.95 | 621 | -41.95 | ||||
| 2025-05-08 | 13F | Parkside Financial Bank & Trust | 0 | -100.00 | 0 | |||||
| 2025-08-14 | 13F | Sei Investments Co | 140,882 | 0.72 | 1,302 | 19.25 | ||||
| 2025-08-14 | 13F | Fmr Llc | 2 | 0.00 | 0 | |||||
| 2025-08-07 | 13F | Acadian Asset Management Llc | 2,784,080 | 4.87 | 26 | 25.00 | ||||
| 2025-08-08 | 13F | Pnc Financial Services Group, Inc. | 490 | 0.00 | 5 | 33.33 | ||||
| 2025-08-15 | 13F | Tower Research Capital LLC (TRC) | 2,651 | 38.00 | 24 | 71.43 | ||||
| 2025-07-31 | 13F | State of New Jersey Common Pension Fund D | 28,510 | 0.00 | 263 | 18.47 | ||||
| 2025-08-13 | 13F | Mackenzie Financial Corp | 48,028 | 444 | ||||||
| 2025-08-06 | 13F | Golden State Wealth Management, LLC | 155 | 0.00 | 1 | 0.00 | ||||
| 2025-08-14 | 13F | Algert Global Llc | 29,138 | -10.03 | 0 | |||||
| 2025-08-14 | 13F | PDT Partners, LLC | 83,786 | 84.04 | 774 | 118.03 | ||||
| 2025-07-29 | 13F | Stephens Inc /ar/ | 0 | -100.00 | 0 | |||||
| 2025-08-14 | 13F | Bnp Paribas Arbitrage, Sa | 34,162 | -17.53 | 316 | -2.48 | ||||
| 2025-08-14 | 13F | Boothbay Fund Management, Llc | 51,492 | 476 | ||||||
| 2025-08-14 | 13F | Engineers Gate Manager LP | 97,119 | 13.18 | 897 | 34.08 | ||||
| 2025-08-22 | NP | Columbia Funds Variable Series Trust II - Variable Portfolio - Partners Small Cap Value Fund Class 3 | 104,876 | -41.82 | 969 | -31.03 | ||||
| 2025-05-29 | 13F/A | Legal & General Group Plc | 0 | -100.00 | 0 | -100.00 | ||||
| 2025-08-18 | 13F | Wolverine Trading, Llc | Call | 16,100 | -5.85 | 147 | 8.15 | |||
| 2025-07-23 | NP | CFSSX - Column Small Cap Select Fund | 324,784 | 13.68 | 3,542 | 38.81 | ||||
| 2025-08-14 | 13F | Federation des caisses Desjardins du Quebec | 0 | -100.00 | 0 | |||||
| 2025-08-14 | 13F | Bank Of America Corp /de/ | 161,396 | -38.86 | 1,491 | -27.55 | ||||
| 2025-08-28 | NP | GWX - SPDR(R) S&P(R) International Small Cap ETF | 24,346 | -1.56 | 225 | 16.67 | ||||
| 2025-08-14 | 13F | Jane Street Group, Llc | Call | 33,400 | -74.25 | 309 | -69.54 | |||
| 2025-08-14 | 13F | Goldman Sachs Group Inc | 137,897 | 5.15 | 1,274 | 24.66 | ||||
| 2025-08-08 | 13F | SBI Securities Co., Ltd. | 131 | 0.00 | 1 | 0.00 | ||||
| 2025-08-13 | 13F | Northern Trust Corp | 13,203 | -26.23 | 122 | -12.95 | ||||
| 2025-08-14 | 13F | Jane Street Group, Llc | 116,041 | 48.00 | 1,072 | 75.45 | ||||
| 2025-07-28 | NP | MSSM - Morgan Stanley Pathway Small-Mid Cap Equity ETF | 128,974 | 12.85 | 1,406 | 37.84 | ||||
| 2025-07-29 | 13F | William Blair Investment Management, Llc | 1,425,288 | -45.62 | 13,170 | -35.58 | ||||
| 2025-08-12 | 13F | Trexquant Investment LP | 125,067 | -38.69 | 1,156 | -27.40 | ||||
| 2025-08-13 | 13F | Northwestern Mutual Wealth Management Co | 6 | -99.60 | 0 | -100.00 | ||||
| 2025-08-11 | 13F | Cornerstone Planning Group LLC | 0 | -100.00 | 0 | |||||
| 2025-08-14 | 13F/A | Barclays Plc | 6,017 | 65.53 | 0 | |||||
| 2025-08-14 | 13F | Balyasny Asset Management Llc | 17,230 | -14.66 | 159 | 1.27 | ||||
| 2025-06-25 | NP | IZRL - ARK Israel Innovative Technology ETF | 174,707 | -11.32 | 1,712 | -6.65 | ||||
| 2025-07-22 | 13F | Gsa Capital Partners Llp | 74,192 | 288.89 | 1 | |||||
| 2025-08-12 | 13F | Dimensional Fund Advisors Lp | 86,822 | 0.00 | 802 | 18.32 | ||||
| 2025-08-13 | 13F | ExodusPoint Capital Management, LP | 89,404 | -28.14 | 1 | |||||
| 2025-07-28 | NP | DAT - ProShares Big Data Refiners ETF | 5,503 | 1.27 | 60 | 25.00 | ||||
| 2025-07-23 | NP | CFSLX - Column Small Cap Fund | 56,987 | 5.41 | 621 | 28.84 | ||||
| 2025-08-12 | 13F | Edmond De Rothschild Holding S.a. | 34,870 | 0.00 | 322 | 18.82 | ||||
| 2025-08-14 | 13F | Westerly Capital Management, Llc | 850,000 | -20.19 | 7,854 | -5.45 | ||||
| 2025-08-12 | 13F | MAI Capital Management | 25 | 0.00 | 0 | |||||
| 2025-08-14 | 13F | Driehaus Capital Management Llc | 1,168,007 | 102.67 | 10,792 | 140.09 | ||||
| 2025-08-12 | 13F | Scalar Gauge Management, Llc | 545,032 | 18.48 | 5,036 | 40.36 | ||||
| 2025-08-25 | 13F/A | Neuberger Berman Group LLC | 5,215,938 | -0.44 | 48,166 | 17.51 | ||||
| 2025-07-15 | 13F | Public Employees Retirement System Of Ohio | 230,410 | 0.00 | 2,129 | 18.42 | ||||
| 2025-08-14 | 13F | Susquehanna International Group, Llp | 0 | -100.00 | 0 | |||||
| 2025-08-14 | 13F | Cubist Systematic Strategies, LLC | 109,705 | 35.21 | 1,014 | 60.28 | ||||
| 2025-08-12 | 13F | XTX Topco Ltd | 0 | -100.00 | 0 | |||||
| 2025-08-13 | 13F | Walleye Trading LLC | Call | 50,600 | 468 | |||||
| 2025-08-26 | NP | WAR - U.S. Global Technology and Aerospace & Defense ETF | 24,620 | 81.00 | 227 | 114.15 | ||||
| 2025-08-13 | 13F | Russell Investments Group, Ltd. | 230 | -94.43 | 2 | -93.75 | ||||
| 2025-08-14 | 13F | Two Sigma Investments, Lp | 62,200 | 130.00 | 575 | 173.33 | ||||
| 2025-08-12 | 13F | EAM Investors, LLC | 0 | -100.00 | 0 | |||||
| 2025-08-01 | 13F | Envestnet Asset Management Inc | 18,776 | -12.03 | 173 | 4.22 | ||||
| 2025-08-14 | 13F | RBF Capital, LLC | 20,000 | 0.00 | 185 | 17.95 | ||||
| 2025-08-11 | 13F | Senvest Management, LLC | 149,441 | -72.67 | 1,381 | -67.64 | ||||
| 2025-08-14 | 13F | Citadel Advisors Llc | 446,162 | -29.03 | 4,123 | -15.93 | ||||
| 2025-08-14 | 13F | Citadel Advisors Llc | Call | 34,800 | 4,871.43 | 322 | 6,320.00 | |||
| 2025-08-14 | 13F | State Of Wisconsin Investment Board | 490,173 | 85.83 | 4,529 | 120.18 | ||||
| 2025-08-14 | 13F | Citadel Advisors Llc | Put | 285,300 | 456.14 | 2,636 | 559.00 | |||
| 2025-08-14 | 13F | Hrt Financial Lp | 118,653 | -15.99 | 1 | 0.00 | ||||
| 2025-08-12 | 13F | CM Management, LLC | 100,000 | 924 | ||||||
| 2025-08-14 | 13F | Edenbrook Capital, LLC | 6,737,375 | 1.54 | 62,253 | 20.29 | ||||
| 2025-07-30 | 13F | ARK Investment Management LLC | 172,657 | -12.36 | 1,595 | 3.84 | ||||
| 2025-08-14 | 13F | Edenbrook Capital, LLC | Call | 200,000 | 1,848 | |||||
| 2025-04-07 | 13F | GAMMA Investing LLC | 0 | -100.00 | 0 | |||||
| 2025-06-25 | NP | CSMIX - Columbia Small Cap Value Fund I Class A | 513,614 | -0.83 | 5,033 | 4.40 | ||||
| 2025-07-28 | NP | NINAX - Neuberger Berman Intrinsic Value Fund Class A | 1,480,551 | -7.06 | 16,145 | 13.50 | ||||
| 2025-08-14 | 13F | Toroso Investments, LLC | 49,403 | 22.06 | 456 | 44.76 | ||||
| 2025-08-11 | 13F | Poehling Capital Management, LLC | 18,782 | 0.00 | 174 | 18.49 | ||||
| 2025-08-26 | NP | DRIOX - Driehaus International Small Cap Growth Fund | 166,984 | 97.63 | 1,543 | 133.99 | ||||
| 2025-08-27 | NP | OAIEX - Optimum International Fund Class A | 780 | 0.00 | 7 | 16.67 | ||||
| 2025-06-25 | NP | NTKLX - Voya Multi-Manager International Small Cap Fund Class A | 62,556 | 0.00 | 613 | 5.33 | ||||
| 2025-08-01 | 13F | Davy Global Fund Management Ltd | 93,206 | 53.33 | 861 | 81.65 | ||||
| 2025-08-05 | 13F | Simplex Trading, Llc | Call | 22,300 | 112.38 | 0 | ||||
| 2025-08-14 | 13F | G2 Investment Partners Management LLC | 266,262 | 2,460 | ||||||
| 2025-08-14 | 13F | D. E. Shaw & Co., Inc. | 829,578 | 0.41 | 7,665 | 18.95 | ||||
| 2025-08-14 | 13F | Point72 Asset Management, L.P. | 14,400 | -52.48 | 133 | -43.64 | ||||
| 2025-08-13 | 13F | Jump Financial, LLC | 0 | -100.00 | 0 | |||||
| 2025-08-05 | 13F | Simplex Trading, Llc | Put | 700 | -92.86 | 0 | ||||
| 2025-08-11 | 13F | Y.D. More Investments Ltd | 1,854,798 | 0.00 | 17,138 | 18.46 | ||||
| 2025-08-19 | 13F | State of Wyoming | 2,340 | 87.35 | 22 | 133.33 | ||||
| 2025-08-05 | 13F | Simplex Trading, Llc | 15,335 | 122.44 | 0 | |||||
| 2025-08-11 | 13F | Covestor Ltd | 6,917 | -6.38 | 0 | |||||
| 2025-08-12 | 13F | Pathstone Holdings, LLC | 29,017 | 27.40 | 268 | 51.41 | ||||
| 2025-08-14 | 13F | Royal Bank Of Canada | 1,870 | 106.17 | 18 | 125.00 | ||||
| 2025-07-25 | 13F | JustInvest LLC | 11,549 | -1.55 | 107 | 16.48 | ||||
| 2025-08-13 | 13F | Centiva Capital, LP | 0 | -100.00 | 0 | |||||
| 2025-08-07 | 13F | Legacy Advisors, LLC | 0 | -100.00 | 0 | |||||
| 2025-08-12 | 13F | Westport Asset Management Inc | 45,000 | 0.00 | 416 | 18.23 | ||||
| 2025-08-04 | 13F | Spire Wealth Management | 314 | 0.00 | 3 | 0.00 | ||||
| 2025-08-13 | 13F | Quantbot Technologies LP | 0 | -100.00 | 0 | |||||
| 2025-08-28 | NP | Amplify ETF Trust - Amplify BlueStar Israel Technology ETF | 47,992 | 18.57 | 443 | 40.63 | ||||
| 2025-08-15 | 13F | State of Tennessee, Treasury Department | 61,249 | 73.53 | 566 | 105.45 | ||||
| 2025-08-14 | 13F | Lazard Asset Management Llc | 71,374 | 1 | ||||||
| 2025-08-12 | 13F | EAM Global Investors LLC | 0 | -100.00 | 0 | |||||
| 2025-08-14 | 13F | Millennium Management Llc | 475,348 | -48.44 | 4,392 | -38.92 | ||||
| 2025-08-13 | 13F | Invesco Ltd. | 45,398 | -31.34 | 419 | -18.64 | ||||
| 2025-07-29 | 13F | Angeles Wealth Management, Llc | 64,314 | 0.00 | 594 | 18.56 | ||||
| 2025-06-26 | NP | SMLF - iShares Edge MSCI Multifactor USA Small-Cap ETF | 168,451 | 10.73 | 1,651 | 16.53 | ||||
| 2025-08-08 | 13F | SG Americas Securities, LLC | 208,843 | 145.52 | 2 | |||||
| 2025-08-12 | 13F | Proequities, Inc. | Put | 0 | 0 | |||||
| 2025-08-08 | 13F | Commonwealth Of Pennsylvania Public School Empls Retrmt Sys | 51,448 | 0.00 | 475 | 18.45 | ||||
| 2025-08-12 | 13F | Proequities, Inc. | Call | 0 | 0 | |||||
| 2025-08-12 | 13F | Proequities, Inc. | 0 | 0 | ||||||
| 2025-08-15 | 13F | Morgan Stanley | 236,180 | -1.49 | 2,182 | 16.75 | ||||
| 2025-08-14 | 13F | Sphera Funds Management Ltd. | 45,181 | 417 | ||||||
| 2025-08-08 | 13F | Larson Financial Group LLC | 632 | 6 | ||||||
| 2025-08-11 | 13F | Semanteon Capital Management, LP | 0 | -100.00 | 0 | |||||
| 2025-08-12 | 13F | BlackRock, Inc. | 301,985 | -4.71 | 2,790 | 12.91 | ||||
| 2025-07-31 | 13F | Nisa Investment Advisors, Llc | 0 | -100.00 | 0 | |||||
| 2025-08-07 | 13F | Allworth Financial LP | 75 | 0.00 | 1 | |||||
| 2025-08-14 | 13F | Topline Capital Management, LLC | 7,027,290 | -1.02 | 64,932 | 17.25 | ||||
| 2025-08-14 | 13F | Mariner, LLC | 10,578 | 4.55 | 98 | 24.36 | ||||
| 2025-08-11 | 13F | NewEdge Wealth, LLC | 37,080 | 337 | ||||||
| 2025-08-14 | 13F | Verition Fund Management LLC | 0 | -100.00 | 0 | |||||
| 2025-08-14 | 13F | Atom Investors LP | 0 | -100.00 | 0 | |||||
| 2025-08-04 | 13F | Analyst IMS Investment Management Services Ltd. | 351,521 | 0.00 | 3 | 50.00 | ||||
| 2025-08-11 | 13F | Citigroup Inc | 92,164 | -12.49 | 852 | 3.65 | ||||
| 2025-08-14 | 13F | Raymond James Financial Inc | 1,265 | 12 | ||||||
| 2025-08-14 | 13F | Two Sigma Advisers, Lp | 31,400 | -18.65 | 290 | -3.65 | ||||
| 2025-08-14 | 13F | Ameriprise Financial Inc | 851,305 | -15.01 | 7,866 | 0.68 | ||||
| 2025-08-05 | 13F | Corton Capital Inc. | 10,304 | 95 | ||||||
| 2025-08-14 | 13F | State Street Corp | 25,863 | -1.47 | 239 | 16.67 | ||||
| 2025-05-14 | 13F | Archon Capital Management LLC | 0 | -100.00 | 0 | |||||
| 2025-08-13 | 13F | Arrowstreet Capital, Limited Partnership | 840,735 | 49.33 | 7,768 | 76.91 | ||||
| 2025-08-14 | 13F | American Capital Management Inc | 6,712,241 | 0.70 | 62,021 | 19.29 | ||||
| 2025-08-20 | NP | WBVNX - William Blair Small Cap Value Fund Class N | 538,762 | -46.16 | 4,978 | -36.22 | ||||
| 2025-08-14 | 13F | Susquehanna International Group, Llp | Call | 129,600 | 206.38 | 1,198 | 263.83 | |||
| 2025-05-05 | 13F | Lindbrook Capital, Llc | 911 | 2.02 | 7 | 0.00 | ||||
| 2025-07-31 | 13F | R Squared Ltd | 11,875 | 110 | ||||||
| 2025-08-14 | 13F | Susquehanna International Group, Llp | Put | 97,500 | 901 | |||||
| 2025-07-25 | 13F | Pandora Wealth, Inc. | 65 | 0.00 | 1 | |||||
| 2025-08-14 | 13F | C M Bidwell & Associates Ltd | 99 | 0.00 | 1 | |||||
| 2025-08-14 | 13F | UBS Group AG | 171,049 | -53.47 | 1,580 | -44.89 | ||||
| 2025-08-13 | 13F | Renaissance Technologies Llc | 577,711 | -9.68 | 5,338 | 7.02 | ||||
| 2025-08-14 | 13F | Point72 Asia (Singapore) Pte. Ltd. | 3,259 | 130.64 | 30 | 172.73 | ||||
| 2025-08-14 | 13F | Qube Research & Technologies Ltd | 224,053 | 25.45 | 2,070 | 48.60 | ||||
| 2025-07-24 | NP | FNCMX - Fidelity Nasdaq Composite Index Fund This fund is a listed as child fund of Fmr Llc and if that institution has disclosed ownership in this security, then these positions will not be double counted when calculating total shares and total value | 50,913 | 0.00 | 555 | 22.25 |
Other Listings
| DE:81M | € 7.25 |