Mga Batayang Estadistika
| Pemilik Institusional | 151 total, 150 long only, 0 short only, 1 long/short - change of 0.66% MRQ |
| Alokasi Portofolio Rata-rata | 0.2989 % - change of -12.48% MRQ |
| Saham Institusional (Jangka Panjang) | 11,098,255 (ex 13D/G) - change of -1.18MM shares -9.61% MRQ |
| Nilai Institusional (Jangka Panjang) | $ 278,861 USD ($1000) |
Kepemilikan Institusional dan Pemegang Saham
Invesco DB Multi-Sector Commodity Trust - Invesco DB Agriculture Fund (US:DBA) memiliki 151 pemilik institusional dan pemegang saham yang telah mengajukan formulir 13D/G atau 13F kepada Komisi Bursa Efek (Securities Exchange Commission/SEC). Lembaga-lembaga ini memegang total 11,098,255 saham. Pemegang saham terbesar meliputi Wells Fargo & Company/mn, New York Life Investment Management Llc, Morgan Stanley, Bank Of America Corp /de/, QAI - IQ Hedge Multi-Strategy Tracker ETF, 1832 Asset Management L.P., Kestra Advisory Services, LLC, HighTower Advisors, LLC, Jpmorgan Chase & Co, and Cambria Investment Management, L.P. .
Struktur kepemilikan institusional Invesco DB Multi-Sector Commodity Trust - Invesco DB Agriculture Fund (ARCA:DBA) menunjukkan posisi terkini di perusahaan oleh institusi dan dana, serta perubahan terbaru dalam ukuran posisi. Pemegang saham utama dapat mencakup investor individu, reksa dana, dana lindung nilai, atau institusi. Jadwal 13D menunjukkan bahwa investor memegang (atau pernah memegang) lebih dari 5% saham perusahaan dan bermaksud (atau pernah bermaksud) untuk secara aktif mengejar perubahan strategi bisnis. Jadwal 13G menunjukkan investasi pasif lebih dari 5%.
The share price as of September 5, 2025 is 27.16 / share. Previously, on September 6, 2024, the share price was 24.22 / share. This represents an increase of 12.14% over that period.

Skor Sentimen Dana
Skor Sentimen Dana (sebelumnya dikenal sebagai Skor Akumulasi Kepemilikan) menemukan saham-saham yang paling banyak dibeli oleh dana. Ini adalah hasil dari model kuantitatif multi-faktor yang canggih yang mengidentifikasi perusahaan dengan tingkat akumulasi institusional tertinggi. Model penilaian menggunakan kombinasi dari total peningkatan pemilik yang diungkapkan, perubahan dalam alokasi portofolio pada pemilik tersebut, dan metrik lainnya. Angka berkisar dari 0 hingga 100, dengan angka yang lebih tinggi menunjukkan tingkat akumulasi yang lebih tinggi dibandingkan dengan perusahaan sejenisnya, dan 50 adalah rata-ratanya.
Frekuensi Pembaruan: Setiap Hari
Lihat Ownership Explorer, yang menyediakan daftar perusahaan dengan peringkat tertinggi.
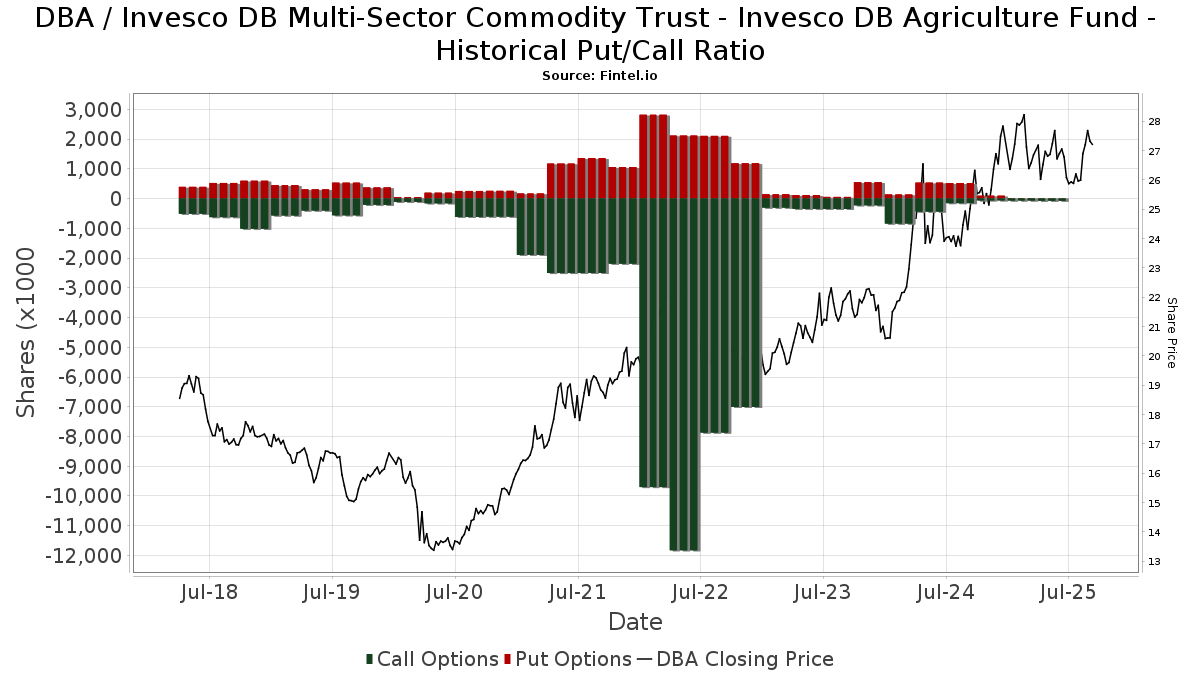
Rasio Put/Call Institusional
Selain melaporkan isu ekuitas dan utang standar, institusi dengan aset di bawah manajemen lebih dari 100 juta dolar AS juga harus mengungkapkan kepemilikan opsi put dan call mereka. Karena opsi put umumnya menunjukkan sentimen negatif, dan opsi call menunjukkan sentimen positif, kita dapat mengetahui sentimen institusional secara keseluruhan dengan memplot rasio put terhadap call. Grafik di sebelah kanan memplot rasio put/call historis untuk instrumen ini.
Menggunakan Rasio Put/Call sebagai indikator sentimen investor mengatasi salah satu kekurangan utama dari penggunaan total kepemilikan institusional, yaitu sejumlah besar aset yang dikelola diinvestasikan secara pasif untuk melacak indeks. Dana yang dikelola secara pasif biasanya tidak membeli opsi, sehingga indikator rasio put/call lebih akurat dalam melacak sentimen dana yang dikelola secara aktif.
Pengajuan 13F dan NPORT
Detail pada pengajuan 13F tersedia gratis. Detail pada pengajuan NP memerlukan keanggotaan premium. Baris berwarna hijau menunjukkan posisi baru. Baris berwarna merah menunjukkan posisi yang sudah ditutup. Klik tautan ini ikon untuk melihat riwayat transaksi selengkapnya.
Tingkatkan
untuk membuka data premium dan mengekspor ke Excel ![]() .
.
| Tanggal File | Sumber | Investor | Ketik | Presyo ng Avg (Silangan) |
Saham | Δ Saham (%) |
Dilaporkan Nilai ($1000) |
Nilai Δ (%) |
Alokasi Port (%) |
|
|---|---|---|---|---|---|---|---|---|---|---|
| 2025-08-13 | 13F | VestGen Advisors, LLC | 76,917 | 2,011 | ||||||
| 2025-08-14 | 13F | Wiley Bros.-aintree Capital, Llc | 25,644 | 27.23 | 671 | 25.70 | ||||
| 2025-06-30 | NP | CAPTX - Canterbury Portfolio Thermostat Fund Institutional Shares | 14,945 | 0.00 | 401 | -2.91 | ||||
| 2025-08-12 | 13F | Jpmorgan Chase & Co | 427,297 | -25.44 | 11,174 | -25.98 | ||||
| 2025-08-08 | 13F | Creative Planning | 11,804 | 28.25 | 309 | 27.27 | ||||
| 2025-08-19 | 13F | Advisory Services Network, LLC | 0 | -100.00 | 0 | |||||
| 2025-07-01 | 13F | First National Bank Sioux Falls | 0 | -100.00 | 0 | |||||
| 2025-08-06 | 13F | Moors & Cabot, Inc. | 24,022 | 0.97 | 628 | 0.32 | ||||
| 2025-08-14 | 13F | Boston Private Wealth Llc | 0 | -100.00 | 0 | |||||
| 2025-07-21 | 13F | Ameritas Advisory Services, LLC | 200 | 5 | ||||||
| 2025-07-28 | 13F | Harbour Investments, Inc. | 4,654 | 45.17 | 122 | 44.05 | ||||
| 2025-07-25 | 13F | Atria Wealth Solutions, Inc. | 15,443 | 0.00 | 404 | -0.74 | ||||
| 2025-08-08 | 13F | Advyzon Investment Management, LLC | 8,424 | 220 | ||||||
| 2025-07-11 | 13F | Farther Finance Advisors, LLC | 26 | 0.00 | 1 | |||||
| 2025-08-19 | 13F | Asset Dedication, LLC | 140 | 0.00 | 4 | 0.00 | ||||
| 2025-09-04 | 13F/A | Advisor Group Holdings, Inc. | 214,622 | -1.43 | 5,612 | -2.13 | ||||
| 2025-08-14 | 13F | UBS Group AG | 107,952 | -42.79 | 2,823 | -43.22 | ||||
| 2025-08-14 | 13F/A | Rockefeller Capital Management L.P. | 61,559 | 4.51 | 1,610 | 3.74 | ||||
| 2025-08-14 | 13F | Federation des caisses Desjardins du Quebec | 89 | 0.00 | 2 | 0.00 | ||||
| 2025-08-14 | 13F | TCG Advisory Services, LLC | 0 | -100.00 | 0 | |||||
| 2025-07-11 | 13F | SILVER OAK SECURITIES, Inc | 37,906 | -3.49 | 991 | -4.62 | ||||
| 2025-08-12 | 13F | Blueprint Investment Partners LLC | 0 | -100.00 | 0 | |||||
| 2025-08-05 | 13F | Huntington National Bank | 105 | -0.95 | ||||||
| 2025-08-11 | 13F | Midwest Professional Planners, LTD. | 0 | -100.00 | 0 | |||||
| 2025-04-17 | 13F | FNY Investment Advisers, LLC | 0 | -100.00 | 0 | |||||
| 2025-08-04 | 13F | Atria Investments Llc | 19,307 | 3.81 | 505 | 3.07 | ||||
| 2025-07-17 | 13F | Janney Montgomery Scott LLC | 8,838 | 0.00 | 0 | |||||
| 2025-08-05 | 13F | Westside Investment Management, Inc. | 5,104 | 0.00 | 133 | -0.75 | ||||
| 2025-08-14 | 13F | Stifel Financial Corp | 91,648 | 3.10 | 2,397 | 2.35 | ||||
| 2025-07-01 | 13F | Harbor Investment Advisory, Llc | 3,033 | 0.00 | 79 | 0.00 | ||||
| 2025-08-12 | 13F | Picton Mahoney Asset Management | 2,170 | 30.72 | 0 | |||||
| 2025-07-25 | 13F | Sharp Financial Services, LLC | 19,200 | 6.67 | 502 | 5.91 | ||||
| 2025-06-24 | NP | TNMAX - 1290 Multi-Alternative Strategies Fund Class A | 30,740 | 21.79 | 824 | 18.39 | ||||
| 2025-08-13 | 13F | Quadrature Capital Ltd | 216,891 | 5,671 | ||||||
| 2025-07-23 | 13F | WestEnd Advisors, LLC | 3,910 | 102 | ||||||
| 2025-08-14 | 13F | Ameriprise Financial Inc | 165,033 | 28.03 | 4,289 | 26.27 | ||||
| 2025-08-06 | 13F | OneAscent Wealth Management LLC | 0 | -100.00 | 0 | |||||
| 2025-07-18 | 13F | PFG Investments, LLC | 15,008 | 3.62 | 392 | 2.89 | ||||
| 2025-08-08 | 13F | Hartland & Co., LLC | 471 | 0.00 | 12 | 0.00 | ||||
| 2025-08-13 | 13F | Cambria Investment Management, L.P. | 308,923 | -4.33 | 8,078 | -5.02 | ||||
| 2025-08-13 | 13F | Vermillion & White Wealth Management Group, LLC | 5 | 0.00 | 0 | |||||
| 2025-08-14 | 13F | Main Street Financial Solutions, LLC | 16,335 | 427 | ||||||
| 2025-08-12 | 13F | Global Retirement Partners, LLC | 7,476 | -11.80 | 195 | -13.33 | ||||
| 2025-07-29 | 13F | Sowa Financial Group, Inc. | 0 | -100.00 | 0 | |||||
| 2025-07-14 | 13F | AdvisorNet Financial, Inc | 4,800 | 0.00 | 126 | -0.79 | ||||
| 2025-08-14 | 13F | Private Wealth Advisors, LLC | 184,499 | -0.43 | 4,825 | -1.15 | ||||
| 2025-08-13 | 13F | Custom Index Systems, Llc | 17,511 | -4.60 | 458 | -5.38 | ||||
| 2025-07-10 | 13F | Signal Advisors Wealth, LLC | 8,424 | 0.00 | 220 | -0.45 | ||||
| 2025-08-12 | 13F | Accredited Wealth Management, LLC | 300 | -72.73 | 8 | -75.00 | ||||
| 2025-05-02 | 13F | Transcendent Capital Group LLC | 0 | -100.00 | 0 | |||||
| 2025-08-14 | 13F | Citadel Advisors Llc | Call | 8,900 | 20.27 | 233 | 19.59 | |||
| 2025-08-14 | 13F | Citadel Advisors Llc | 17,437 | -70.16 | 456 | -70.44 | ||||
| 2025-08-14 | 13F | Citadel Advisors Llc | Put | 10,000 | -43.82 | 262 | -44.23 | |||
| 2025-07-24 | 13F | Trust Co Of Toledo Na /oh/ | 5,527 | 145 | ||||||
| 2025-08-11 | 13F | Principal Securities, Inc. | 1,315 | 3,187.50 | 34 | 3,300.00 | ||||
| 2025-05-09 | 13F | GeoWealth Management, LLC | 0 | -100.00 | 0 | |||||
| 2025-05-13 | 13F | Bank Of Montreal /can/ | 0 | -100.00 | 0 | |||||
| 2025-07-24 | 13F | IFP Advisors, Inc | 7,058 | 212.58 | 185 | 211.86 | ||||
| 2025-07-16 | 13F | Perigon Wealth Management, LLC | 171,255 | 408.90 | 4,478 | 405.42 | ||||
| 2025-08-14 | 13F | Susquehanna International Group, Llp | 0 | -100.00 | 0 | |||||
| 2025-08-11 | 13F | Citigroup Inc | 791 | 21 | ||||||
| 2025-08-12 | 13F | Insigneo Advisory Services, Llc | 27,003 | 0.00 | 706 | -0.70 | ||||
| 2025-08-15 | 13F | Equitable Holdings, Inc. | 63,327 | 8.02 | 1,656 | 7.25 | ||||
| 2025-08-26 | NP | EQ ADVISORS TRUST - 1290 VT Multi-Alternative Strategies Portfolio Class IB | 14,570 | 3.70 | 381 | 2.97 | ||||
| 2025-08-08 | 13F | Avantax Advisory Services, Inc. | 93,071 | 8.49 | 2,434 | 7.70 | ||||
| 2025-05-28 | NP | GHTA - Goose Hollow Tactical Allocation ETF | 0 | -100.00 | 0 | -100.00 | ||||
| 2025-08-06 | 13F | Pekin Hardy Strauss, Inc. | 30,570 | -1.85 | 799 | -2.56 | ||||
| 2025-08-14 | 13F | Parallax Volatility Advisers, L.P. | 9,103 | 0.00 | 238 | -0.42 | ||||
| 2025-08-04 | 13F | Mesirow Financial Investment Management, Inc. | 54,243 | 3.83 | 1,418 | 3.05 | ||||
| 2025-08-12 | 13F | CIBC Private Wealth Group, LLC | 4,477 | 0.00 | 117 | 3.54 | ||||
| 2025-08-14 | 13F | GWM Advisors LLC | 7,671 | 0.00 | 201 | -0.99 | ||||
| 2025-08-14 | 13F | Daiwa Securities Group Inc. | 151,500 | 5.43 | 4 | 0.00 | ||||
| 2025-07-17 | 13F | Sound Income Strategies, LLC | 5,889 | 154 | ||||||
| 2025-07-08 | 13F | Nbc Securities, Inc. | 61,096 | -10.07 | 2 | 0.00 | ||||
| 2025-08-14 | 13F | Two Sigma Securities, Llc | 10,945 | 17.15 | 286 | 16.26 | ||||
| 2025-08-06 | 13F | Commonwealth Equity Services, Llc | 99,664 | 14.00 | 3 | 0.00 | ||||
| 2025-08-08 | 13F/A | Ignite Planners, LLC | 27,928 | 16.67 | 727 | 13.97 | ||||
| 2025-07-22 | 13F | Hillcrest Wealth Advisors - NY, LLC | 11,400 | 0.00 | 298 | -0.67 | ||||
| 2025-08-11 | 13F | Independent Advisor Alliance | 0 | -100.00 | 0 | |||||
| 2025-08-08 | 13F | Foundations Investment Advisors, LLC | 19,475 | -4.06 | 509 | -4.68 | ||||
| 2025-07-22 | 13F | Knights of Columbus Asset Advisors LLC | 3,314 | -19.93 | 87 | -21.10 | ||||
| 2025-05-14 | 13F | Walleye Trading LLC | Call | 0 | -100.00 | 0 | ||||
| 2025-04-24 | 13F | Wingate Wealth Advisors, Inc. | 0 | -100.00 | 0 | |||||
| 2025-05-16 | 13F | Coppell Advisory Solutions LLC | 0 | -100.00 | 0 | |||||
| 2025-07-25 | 13F | Cwm, Llc | 18,579 | 2.18 | 0 | |||||
| 2025-08-14 | 13F | Jane Street Group, Llc | 50,537 | -63.21 | 1,322 | -63.48 | ||||
| 2025-05-15 | 13F | Squarepoint Ops LLC | Call | 0 | -100.00 | 0 | ||||
| 2025-08-11 | 13F | FineMark National Bank & Trust | 0 | -100.00 | 0 | |||||
| 2025-08-08 | 13F | Pnc Financial Services Group, Inc. | 5,317 | 42.59 | 139 | 41.84 | ||||
| 2025-07-31 | 13F | Leavell Investment Management, Inc. | 0 | -100.00 | 0 | |||||
| 2025-08-01 | 13F | New York Life Investment Management Llc | 807,885 | -14.77 | 21,126 | -15.38 | ||||
| 2025-08-11 | 13F | TD Waterhouse Canada Inc. | 390 | -28.57 | 10 | -28.57 | ||||
| 2025-08-14 | 13F | Wells Fargo & Company/mn | 913,416 | -3.86 | 23,886 | -4.56 | ||||
| 2025-08-07 | 13F | Parkside Financial Bank & Trust | 90 | 0.00 | 2 | 0.00 | ||||
| 2025-08-12 | 13F | Financial Advocates Investment Management | 22,468 | -59.24 | 588 | -59.55 | ||||
| 2025-07-25 | 13F | We Are One Seven, LLC | 90,857 | 11.24 | 2,376 | 10.41 | ||||
| 2025-08-13 | 13F | Continuum Advisory, LLC | 0 | -100.00 | 0 | |||||
| 2025-08-14 | 13F | Mml Investors Services, Llc | 9,862 | 9.27 | 0 | |||||
| 2025-08-25 | 13F/A | Neuberger Berman Group LLC | 83,930 | 2,195 | ||||||
| 2025-07-24 | 13F | Ronald Blue Trust, Inc. | 0 | -100.00 | 0 | |||||
| 2025-07-30 | 13F | Mid-American Wealth Advisory Group, Inc. | 241 | 6 | ||||||
| 2025-08-14 | 13F | Modern Wealth Management, LLC | 15,769 | 0.69 | 412 | 0.00 | ||||
| 2025-04-29 | 13F | Hm Payson & Co | 0 | -100.00 | 0 | |||||
| 2025-08-14 | 13F | EP Wealth Advisors, Inc. | 45,750 | 1,196 | ||||||
| 2025-08-14 | 13F | Fmr Llc | 2,809 | 152.38 | 73 | 151.72 | ||||
| 2025-08-14 | 13F | Mercer Global Advisors Inc /adv | 40,000 | -50.00 | 1,046 | -50.36 | ||||
| 2025-08-08 | 13F | Passaic Partners LLC | 0 | -100.00 | 0 | |||||
| 2025-08-04 | 13F | Flagship Harbor Advisors, Llc | 30,970 | 6.75 | 810 | 5.89 | ||||
| 2025-05-16 | 13F/A | Kestra Investment Management, LLC | 0 | -100.00 | 0 | |||||
| 2025-07-24 | 13F | Eastern Bank | 0 | -100.00 | 0 | |||||
| 2025-07-14 | 13F | Painted Porch Advisors LLC | 275 | 0.00 | 7 | 0.00 | ||||
| 2025-08-12 | 13F | Steward Partners Investment Advisory, Llc | 43,381 | 2.85 | 1,134 | 2.07 | ||||
| 2025-08-12 | 13F | LPL Financial LLC | 249,201 | 14.10 | 6,517 | 13.28 | ||||
| 2025-07-31 | 13F | Intelligent Financial Strategies | 239 | 6 | ||||||
| 2025-07-11 | 13F | Caldwell Securities, Inc | 1,362 | 27.05 | 36 | 25.00 | ||||
| 2025-05-12 | 13F | Providence First Trust Co | 0 | -100.00 | 0 | |||||
| 2025-07-30 | 13F | Capital Wealth Alliance, LLC | 196,693 | -13.36 | 5,145 | -13.99 | ||||
| 2025-08-11 | 13F | ARS Investment Partners, LLC | 10,508 | -76.27 | 275 | -76.72 | ||||
| 2025-08-08 | 13F | Itau Unibanco Holding S.A. | 168,400 | 1.32 | 4,404 | 109,975.00 | ||||
| 2025-07-31 | 13F | Oppenheimer & Co Inc | 19,973 | 522 | ||||||
| 2025-07-23 | 13F | Tyche Wealth Partners LLC | 12,502 | 8.21 | 327 | 7.24 | ||||
| 2025-08-07 | 13F | Allworth Financial LP | 2,260 | 0.00 | 59 | -3.28 | ||||
| 2025-08-08 | 13F | Gts Securities Llc | 0 | -100.00 | 0 | |||||
| 2025-08-14 | 13F | Goldman Sachs Group Inc | 18,319 | 82.42 | 479 | 81.44 | ||||
| 2025-08-13 | 13F | Flow Traders U.s. Llc | 27,255 | -62.12 | 1 | -100.00 | ||||
| 2025-07-14 | 13F | Armstrong Advisory Group, Inc | 1,350 | 0.00 | 35 | 0.00 | ||||
| 2025-07-28 | 13F | Kiker Wealth Management, LLC | 115 | 0.00 | 3 | 0.00 | ||||
| 2025-08-14 | 13F | Bnp Paribas Arbitrage, Sa | 4,413 | -91.30 | 115 | -91.39 | ||||
| 2025-08-04 | 13F | Amplius Wealth Advisors, LLC | 10,840 | 0.00 | 283 | -0.70 | ||||
| 2025-04-15 | 13F | Simplicity Wealth,LLC | 0 | -100.00 | 0 | |||||
| 2025-07-21 | 13F | Hilltop National Bank | 705 | 18 | ||||||
| 2025-08-14 | 13F | Raymond James Financial Inc | 57,685 | -28.51 | 1,508 | -29.04 | ||||
| 2025-08-14 | 13F | Group One Trading, L.p. | 1,359 | 36 | ||||||
| 2025-05-06 | 13F | WT Wealth Management | 23,682 | 38.43 | 624 | 37.22 | ||||
| 2025-07-30 | 13F | Bogart Wealth, LLC | 3,000 | 0.00 | 78 | -1.27 | ||||
| 2025-08-13 | 13F | Barclays Plc | 0 | -100.00 | 0 | |||||
| 2025-07-15 | 13F | Fifth Third Bancorp | 10,800 | 0.00 | 282 | -0.70 | ||||
| 2025-08-11 | 13F | Duff & Phelps Investment Management Co | 20,525 | 130.62 | 537 | 129.06 | ||||
| 2025-08-13 | 13F | Jones Financial Companies Lllp | 219 | 6 | ||||||
| 2025-07-30 | 13F | D.a. Davidson & Co. | 30,221 | 40.96 | 790 | 40.07 | ||||
| 2025-08-14 | 13F | Susquehanna International Group, Llp | Call | 60,800 | 10.75 | 1,590 | 9.89 | |||
| 2025-07-07 | 13F | Park Edge Advisors, LLC | 11,554 | -17.08 | 302 | -17.71 | ||||
| 2025-06-27 | NP | GMOM - Cambria Global Momentum ETF | 228,998 | -6.32 | 6,139 | -9.01 | ||||
| 2025-08-25 | NP | MAINSTAY VP FUNDS TRUST - MainStay VP IQ Hedge Multi-Strategy Portfolio Initial Class | 179,800 | -19.90 | 4,702 | -20.48 | ||||
| 2025-08-14 | 13F | Hrt Financial Lp | 25,881 | 1 | ||||||
| 2025-08-15 | 13F | Kestra Advisory Services, LLC | 483,845 | 11.17 | 12,653 | 10.37 | ||||
| 2025-08-04 | 13F | Creekmur Asset Management LLC | 399 | -0.25 | 10 | 0.00 | ||||
| 2025-08-06 | 13F | Adviser Investments LLC | 12,583 | 0.00 | 329 | -0.60 | ||||
| 2025-08-07 | 13F | Guardian Partners Inc. | 26,096 | 24.55 | 677 | 19.65 | ||||
| 2025-04-25 | 13F | Perissos Private Wealth Management, LLC | 0 | -100.00 | 0 | |||||
| 2025-07-14 | 13F | Savior LLC | 64,845 | 10.12 | 1,696 | 9.28 | ||||
| 2025-05-15 | 13F | IHT Wealth Management, LLC | 0 | -100.00 | 0 | |||||
| 2025-08-04 | 13F | Spire Wealth Management | 46,728 | 1.08 | 1,222 | 0.33 | ||||
| 2025-05-09 | 13F | Plan Group Financial, LLC | 0 | -100.00 | 0 | -100.00 | ||||
| 2025-08-01 | 13F | Envestnet Asset Management Inc | 31,121 | -19.29 | 814 | -19.90 | ||||
| 2025-07-17 | 13F | Vermillion Wealth Management, Inc. | 2,061 | 0.00 | 54 | -1.85 | ||||
| 2025-08-05 | 13F | Key FInancial Inc | 1,860 | 0.00 | 49 | 0.00 | ||||
| 2025-08-01 | 13F | Solstein Capital, LLC | 20,523 | 0.00 | 537 | -0.74 | ||||
| 2025-08-14 | 13F | Manufacturers Life Insurance Company, The | 87,229 | 48.54 | 2,281 | 47.54 | ||||
| 2025-08-14 | 13F | Comerica Bank | 5,547 | 0.00 | 145 | -0.68 | ||||
| 2025-08-12 | 13F | Weaver Consulting Group | 10,640 | 0.00 | 278 | -0.71 | ||||
| 2025-08-14 | 13F | CIBC World Markets Inc. | 22,772 | 107.83 | 595 | 106.60 | ||||
| 2025-08-08 | 13F | Larson Financial Group LLC | 1,486 | 0.00 | 39 | -2.56 | ||||
| 2025-08-14 | 13F | Qube Research & Technologies Ltd | 0 | -100.00 | 0 | |||||
| 2025-04-28 | 13F | Heritage Oak Wealth Advisors Llc | 0 | -100.00 | 0 | |||||
| 2025-08-15 | 13F | Morgan Stanley | 709,984 | -33.66 | 18,566 | -34.13 | ||||
| 2025-07-10 | 13F | Clare Market Investments LLC | 15,915 | 14.99 | 416 | 14.29 | ||||
| 2025-07-16 | 13F | BOS Asset Management, LLC | 8,489 | 0.00 | 222 | -0.90 | ||||
| 2025-08-26 | NP | PDPAX - Virtus Rampart Alternatives Diversifier Fund Class A | 20,525 | 130.62 | 537 | 129.06 | ||||
| 2025-08-08 | 13F | Citizens Financial Group Inc/ri | 121,676 | -0.58 | 3,182 | -1.30 | ||||
| 2025-08-13 | 13F | 1832 Asset Management L.P. | 555,547 | 8.46 | 14,528 | 7.67 | ||||
| 2025-08-14 | 13F | Ancora Advisors, LLC | 100 | 0.00 | 3 | 0.00 | ||||
| 2025-08-12 | 13F | Proequities, Inc. | 0 | 0 | ||||||
| 2025-08-14 | 13F | Bank Of America Corp /de/ | 698,437 | -0.98 | 18,264 | -1.69 | ||||
| 2025-07-24 | 13F | Us Bancorp \de\ | 125 | 3 | ||||||
| 2025-08-11 | 13F | HighTower Advisors, LLC | 471,132 | 0.30 | 12,320 | -0.42 | ||||
| 2025-08-13 | 13F | M Holdings Securities, Inc. | 16,654 | 0 | ||||||
| 2025-05-12 | 13F | Kohmann Bosshard Financial Services, LLC | 0 | -100.00 | 0 | |||||
| 2025-08-18 | 13F/A | National Bank Of Canada /fi/ | 30,905 | -0.80 | 808 | -1.59 | ||||
| 2025-08-14 | 13F | Royal Bank Of Canada | 111,102 | -3.23 | 2,905 | -3.94 | ||||
| 2025-07-31 | 13F | Cambridge Investment Research Advisors, Inc. | 33,539 | 9.81 | 1 | |||||
| 2025-08-05 | 13F | Intellectus Partners, LLC | 33,345 | 0.00 | 872 | -0.80 | ||||
| 2025-08-08 | 13F | Cetera Investment Advisers | 98,219 | -10.32 | 2,568 | -10.96 | ||||
| 2025-08-15 | 13F | Tower Research Capital LLC (TRC) | 22 | 22.22 | 1 | |||||
| 2025-07-09 | 13F | Camelot Technology Advisors, Inc. | 25,274 | -11.95 | 661 | -12.70 | ||||
| 2025-08-13 | 13F | Northwestern Mutual Wealth Management Co | 247 | 6 | ||||||
| 2025-08-08 | 13F | Kingsview Wealth Management, LLC | 10,649 | -10.95 | 278 | -11.46 | ||||
| 2025-08-14 | 13F | Glen Eagle Advisors, LLC | 500 | 0.00 | 13 | 0.00 | ||||
| 2025-06-25 | NP | QAI - IQ Hedge Multi-Strategy Tracker ETF | 606,448 | -14.25 | 16,259 | -16.71 | ||||
| 2025-08-19 | 13F | National Asset Management, Inc. | 44,250 | 32.73 | 1,157 | 30.59 | ||||
| 2025-08-14 | 13F | Colony Group, LLC | 27,227 | 10.63 | 712 | 9.72 | ||||
| 2025-06-27 | NP | TRTY - Cambria Trinity ETF | 79,925 | -3.39 | 2,143 | -6.18 | ||||
| 2025-05-14 | 13F | Susquehanna International Group, Llp | Put | 0 | -100.00 | 0 | -100.00 |