Mga Batayang Estadistika
| Pemilik Institusional | 226 total, 214 long only, 3 short only, 9 long/short - change of 0.88% MRQ |
| Alokasi Portofolio Rata-rata | 0.3498 % - change of -14.40% MRQ |
| Saham Institusional (Jangka Panjang) | 54,553,156 (ex 13D/G) - change of -1.03MM shares -1.86% MRQ |
| Nilai Institusional (Jangka Panjang) | $ 3,009,778 USD ($1000) |
Kepemilikan Institusional dan Pemegang Saham
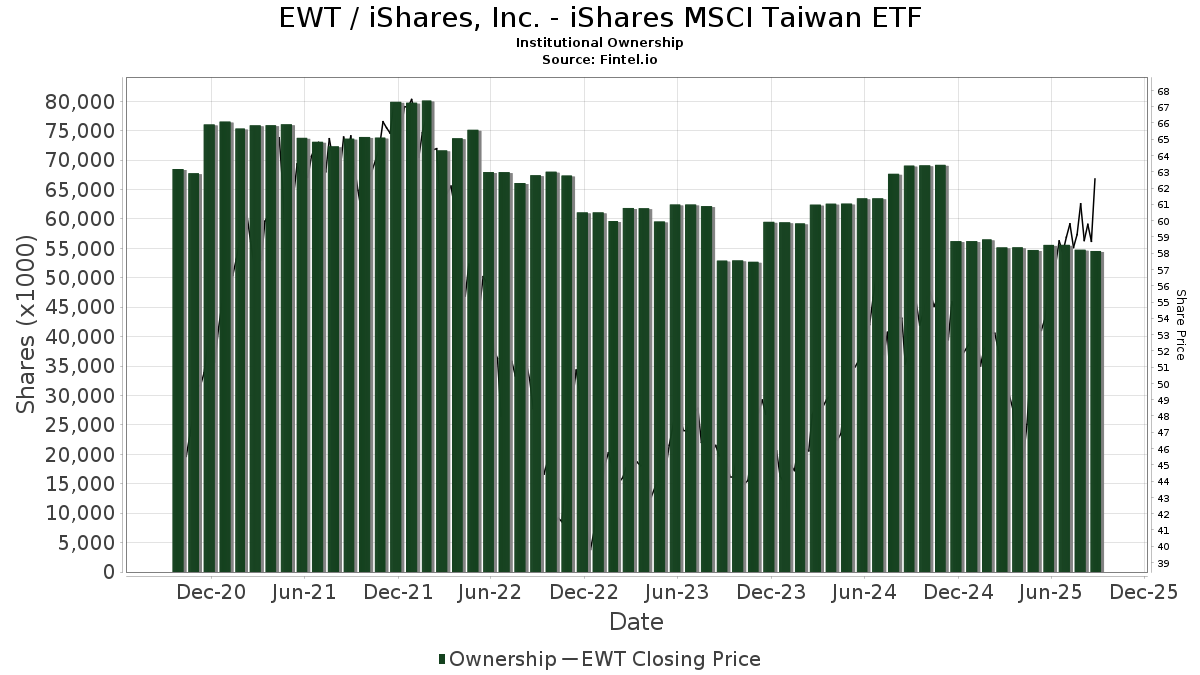
iShares, Inc. - iShares MSCI Taiwan ETF (US:EWT) memiliki 226 pemilik institusional dan pemegang saham yang telah mengajukan formulir 13D/G atau 13F kepada Komisi Bursa Efek (Securities Exchange Commission/SEC). Lembaga-lembaga ini memegang total 54,553,156 saham. Pemegang saham terbesar meliputi State of Tennessee, Treasury Department, BlackRock, Inc., Northern Trust Corp, Bnp Paribas Arbitrage, Sa, Arrowstreet Capital, Limited Partnership, Sun Life Financial Inc, Schroder Investment Management Group, Goldman Sachs Group Inc, Invesco Ltd., and Catalyst Capital Advisors LLC .
Struktur kepemilikan institusional iShares, Inc. - iShares MSCI Taiwan ETF (ARCA:EWT) menunjukkan posisi terkini di perusahaan oleh institusi dan dana, serta perubahan terbaru dalam ukuran posisi. Pemegang saham utama dapat mencakup investor individu, reksa dana, dana lindung nilai, atau institusi. Jadwal 13D menunjukkan bahwa investor memegang (atau pernah memegang) lebih dari 5% saham perusahaan dan bermaksud (atau pernah bermaksud) untuk secara aktif mengejar perubahan strategi bisnis. Jadwal 13G menunjukkan investasi pasif lebih dari 5%.
The share price as of September 5, 2025 is 60.21 / share. Previously, on September 9, 2024, the share price was 51.22 / share. This represents an increase of 17.55% over that period.
Skor Sentimen Dana
Skor Sentimen Dana (sebelumnya dikenal sebagai Skor Akumulasi Kepemilikan) menemukan saham-saham yang paling banyak dibeli oleh dana. Ini adalah hasil dari model kuantitatif multi-faktor yang canggih yang mengidentifikasi perusahaan dengan tingkat akumulasi institusional tertinggi. Model penilaian menggunakan kombinasi dari total peningkatan pemilik yang diungkapkan, perubahan dalam alokasi portofolio pada pemilik tersebut, dan metrik lainnya. Angka berkisar dari 0 hingga 100, dengan angka yang lebih tinggi menunjukkan tingkat akumulasi yang lebih tinggi dibandingkan dengan perusahaan sejenisnya, dan 50 adalah rata-ratanya.
Frekuensi Pembaruan: Setiap Hari
Lihat Ownership Explorer, yang menyediakan daftar perusahaan dengan peringkat tertinggi.
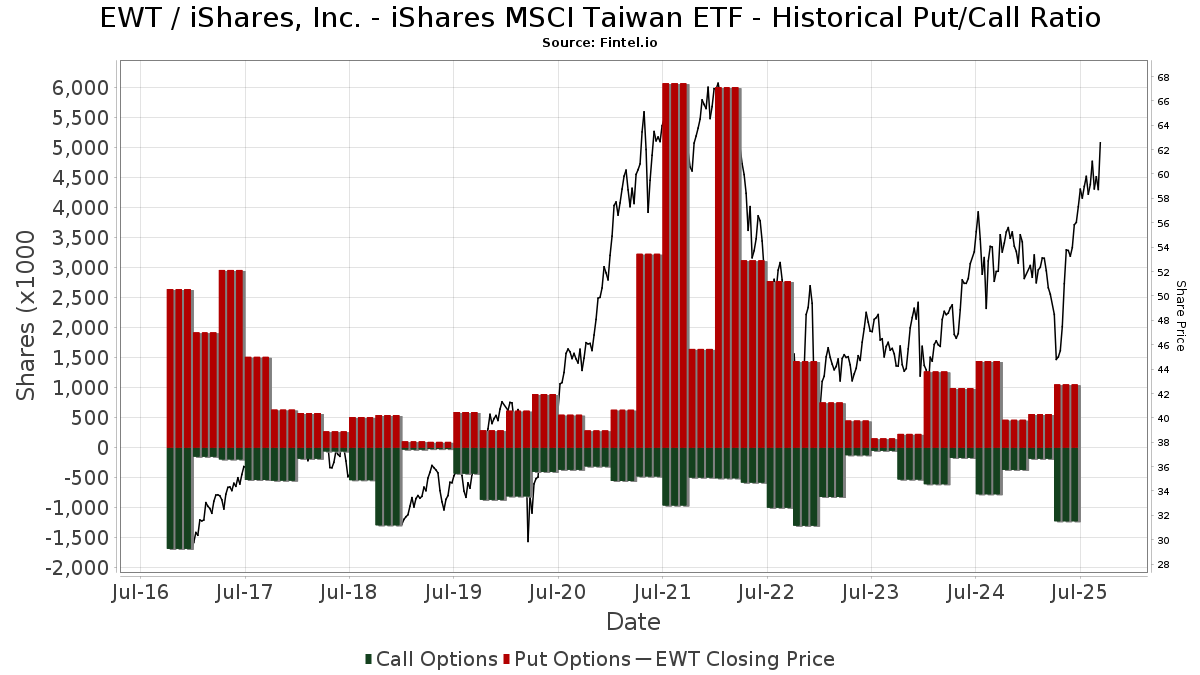
Rasio Put/Call Institusional
Selain melaporkan isu ekuitas dan utang standar, institusi dengan aset di bawah manajemen lebih dari 100 juta dolar AS juga harus mengungkapkan kepemilikan opsi put dan call mereka. Karena opsi put umumnya menunjukkan sentimen negatif, dan opsi call menunjukkan sentimen positif, kita dapat mengetahui sentimen institusional secara keseluruhan dengan memplot rasio put terhadap call. Grafik di sebelah kanan memplot rasio put/call historis untuk instrumen ini.
Menggunakan Rasio Put/Call sebagai indikator sentimen investor mengatasi salah satu kekurangan utama dari penggunaan total kepemilikan institusional, yaitu sejumlah besar aset yang dikelola diinvestasikan secara pasif untuk melacak indeks. Dana yang dikelola secara pasif biasanya tidak membeli opsi, sehingga indikator rasio put/call lebih akurat dalam melacak sentimen dana yang dikelola secara aktif.
Pengajuan 13D/G
Kami menyajikan pengajuan 13D/G secara terpisah dari pengajuan 13F karena perlakuan yang berbeda oleh SEC. Pengajuan 13D/G dapat diajukan oleh kelompok investor (dengan satu pemimpin), sedangkan pengajuan 13F tidak bisa. Hal ini mengakibatkan situasi di mana seorang investor dapat mengajukan 13D/G yang melaporkan satu nilai untuk total saham (mewakili semua saham yang dimiliki oleh kelompok investor), tetapi kemudian mengajukan 13F yang melaporkan nilai yang berbeda untuk total saham (mewakili kepemilikan mereka sendiri). Ini berarti bahwa kepemilikan saham dari pengajuan 13D/G dan pengajuan 13F seringkali tidak dapat dibandingkan secara langsung, sehingga kami menyajikannya secara terpisah.
Catatan: Mulai 16 Mei 2021, kami tidak lagi menampilkan pemilik yang belum mengajukan 13D/G dalam setahun terakhir. Sebelumnya, kami menampilkan riwayat lengkap pengajuan 13D/G. Secara umum, entitas yang diwajibkan untuk mengajukan pengajuan 13D/G harus mengajukan setidaknya setiap tahun sebelum mengirimkan pengajuan penutupan. Namun, terkadang dana keluar dari posisi tanpa mengirimkan pengajuan penutupan (misalnya, mereka menghentikan operasi), sehingga menampilkan riwayat lengkap terkadang menyebabkan kebingungan tentang kepemilikan saat ini. Untuk mencegah kebingungan, kami sekarang hanya menampilkan pemilik 'saat ini' - yaitu - pemilik yang telah mengajukan dalam setahun terakhir.
Upgrade to unlock premium data.
| Tanggal File | Formulir | Investor | Sebelumnya Saham |
Terbaru Saham |
Δ Saham (Persen) |
Kepemilikan (Persen) |
Δ Pagmamay-ari (Persen) |
|
|---|---|---|---|---|---|---|---|---|
| 2025-04-22 | BlackRock, Inc. | 5,428,949 | 3,500,499 | -35.52 | 3.80 | -30.91 |
Pengajuan 13F dan NPORT
Detail pada pengajuan 13F tersedia gratis. Detail pada pengajuan NP memerlukan keanggotaan premium. Baris berwarna hijau menunjukkan posisi baru. Baris berwarna merah menunjukkan posisi yang sudah ditutup. Klik tautan ini ikon untuk melihat riwayat transaksi selengkapnya.
Tingkatkan
untuk membuka data premium dan mengekspor ke Excel ![]() .
.
| Tanggal File | Sumber | Investor | Ketik | Presyo ng Avg (Silangan) |
Saham | Δ Saham (%) |
Dilaporkan Nilai ($1000) |
Nilai Δ (%) |
Alokasi Port (%) |
|
|---|---|---|---|---|---|---|---|---|---|---|
| 2025-07-28 | 13F | Private Wealth Asset Management, LLC | 900 | 0.00 | 52 | 21.43 | ||||
| 2025-08-12 | 13F | Steward Partners Investment Advisory, Llc | 2,522 | -33.32 | 145 | -19.55 | ||||
| 2025-07-14 | 13F | Legacy Capital Group California, Inc. | 0 | -100.00 | 0 | |||||
| 2025-08-14 | 13F | Raymond James Financial Inc | 2,663 | 153 | ||||||
| 2025-07-18 | 13F | BOCHK Asset Management Ltd | 8,500 | 488 | ||||||
| 2025-08-13 | 13F | Global Endowment Management, LP | 8,000 | 0.00 | 459 | 21.11 | ||||
| 2025-08-27 | NP | HCEMX - The Emerging Markets Portfolio HC Strategic Shares | 27,963 | 25.73 | 1,605 | 52.13 | ||||
| 2025-08-11 | 13F | Rahlfs Capital, Llc | 5,075 | 0.00 | 291 | 21.25 | ||||
| 2025-05-13 | 13F | Clear Street Markets Llc | 0 | -100.00 | 0 | -100.00 | ||||
| 2025-08-14 | 13F | Fmr Llc | 9,436 | -40.44 | 542 | -28.06 | ||||
| 2025-05-15 | 13F | Twin Tree Management, LP | 0 | -100.00 | 0 | |||||
| 2025-08-13 | 13F | Fairtree Asset Management (Pty) Ltd | 5,629 | 74.38 | 323 | 111.11 | ||||
| 2025-08-14 | 13F | BTG Pactual Asset Management US LLC | Call | 29,000 | 1,665 | |||||
| 2025-08-14 | 13F | BTG Pactual Asset Management US LLC | 720 | 41 | ||||||
| 2025-08-06 | 13F | North Capital, Inc. | 74 | 0.00 | 4 | 33.33 | ||||
| 2025-08-14 | 13F | BTG Pactual Asset Management US LLC | Put | 29,000 | 1,665 | |||||
| 2025-07-24 | 13F | Lmcg Investments, Llc | 42,693 | -4.99 | 2,451 | 14.86 | ||||
| 2025-07-24 | 13F | Standard Life Aberdeen plc | 230,973 | 63.11 | 13,245 | 98.49 | ||||
| 2025-07-14 | 13F | AdvisorNet Financial, Inc | 38 | -20.83 | 2 | 0.00 | ||||
| 2025-07-23 | 13F | WestEnd Advisors, LLC | 3,023 | -3.79 | 174 | 16.11 | ||||
| 2025-08-14 | 13F/A | Barclays Plc | 2,985 | 202.74 | 0 | |||||
| 2025-08-13 | 13F | Northwestern Mutual Wealth Management Co | 92 | -92.34 | 5 | -91.23 | ||||
| 2025-07-29 | 13F | Disciplined Investments, LLC | 13,691 | -3.11 | 786 | 17.16 | ||||
| 2025-08-14 | 13F | Css Llc/il | Put | 8,500 | 488 | |||||
| 2025-08-13 | 13F | Summit Financial, LLC | 0 | -100.00 | 0 | |||||
| 2025-08-14 | 13F | Ancora Advisors, LLC | 471 | 0.00 | 27 | 22.73 | ||||
| 2025-05-08 | 13F | Jefferies Financial Group Inc. | 0 | -100.00 | 0 | |||||
| 2025-07-29 | 13F | Salomon & Ludwin, LLC | 48 | 0.00 | 3 | 0.00 | ||||
| 2025-08-14 | 13F | Schonfeld Strategic Advisors LLC | 6,488 | -94.35 | 372 | -93.18 | ||||
| 2025-08-13 | 13F | Provida Pension Fund Administrator | 0 | -100.00 | 0 | -100.00 | ||||
| 2025-08-14 | 13F/A | Bank Julius Baer & Co. Ltd, Zurich | 605 | 13.08 | 35 | 21.43 | ||||
| 2025-08-15 | 13F | Morgan Stanley | 381,735 | 12.36 | 21,912 | 35.83 | ||||
| 2025-08-14 | 13F | State Street Corp | 683,119 | 39,211 | ||||||
| 2025-07-31 | 13F | Catalyst Capital Advisors LLC | 1,079,103 | -11.28 | 61,941 | 7.26 | ||||
| 2025-05-14 | 13F | Flow Traders U.s. Llc | 0 | -100.00 | 0 | |||||
| 2025-08-14 | 13F | Manufacturers Life Insurance Company, The | 515,044 | -23.07 | 29,564 | -7.00 | ||||
| 2025-07-31 | 13F | Glass Jacobson Investment Advisors llc | 0 | -100.00 | 0 | |||||
| 2025-07-10 | 13F | Exchange Traded Concepts, Llc | 1,282 | 74 | ||||||
| 2025-07-10 | 13F | Contravisory Investment Management, Inc. | 0 | -100.00 | 0 | |||||
| 2025-07-31 | 13F | Wealthfront Advisers Llc | 5,238 | 301 | ||||||
| 2025-07-08 | 13F | Webster Bank, N. A. | 880 | 0.00 | 51 | 21.95 | ||||
| 2025-07-09 | 13F | Massmutual Trust Co Fsb/adv | 7,874 | -4.30 | 452 | 15.64 | ||||
| 2025-08-14 | 13F | Parallax Volatility Advisers, L.P. | 0 | -100.00 | 0 | |||||
| 2025-08-14 | 13F | Cubist Systematic Strategies, LLC | 46,695 | 2,680 | ||||||
| 2025-08-14 | 13F | Mariner, LLC | 4,596 | -7.08 | 264 | 12.39 | ||||
| 2025-08-05 | 13F | C2P Capital Advisory Group, LLC d.b.a. Prosperity Capital Advisors | 11,721 | -34.13 | 673 | -21.59 | ||||
| 2025-08-12 | 13F | Rock Creek Group, LP | 37,558 | 2,156 | ||||||
| 2025-07-23 | 13F | Meitav Dash Investments Ltd | 326,670 | 0.00 | 18,751 | 20.89 | ||||
| 2025-08-07 | 13F | Guidance Capital, Inc | 12,375 | 7.86 | 723 | 23.63 | ||||
| 2025-07-28 | 13F | Td Asset Management Inc | 50,483 | 6.80 | 2,898 | 29.10 | ||||
| 2025-08-08 | 13F | Banco Bilbao Vizcaya Argentaria, S.a. | 522,227 | 981.22 | 29,917 | 1,203.01 | ||||
| 2025-06-26 | NP | BlackRock ETF Trust - iShares International Country Rotation Active ETF | 4,178 | -32.04 | 198 | -37.34 | ||||
| 2025-08-13 | 13F | Marshall Wace, Llp | 0 | -100.00 | 0 | |||||
| 2025-08-15 | 13F | North Ridge Wealth Advisors, Inc. | 20 | 0.00 | 1 | |||||
| 2025-07-24 | 13F | Blair William & Co/il | 3,350 | -2.05 | 192 | 18.52 | ||||
| 2025-06-26 | NP | SSXU - Day Hagan/Ned Davis Research Smart Sector International ETF | 48,996 | 21.04 | 2,326 | 11.72 | ||||
| 2025-08-12 | 13F | Wayfinding Financial, LLC | 0 | -100.00 | 0 | |||||
| 2025-08-12 | 13F | Coldstream Capital Management Inc | 0 | -100.00 | 0 | |||||
| 2025-08-14 | 13F | Atom Investors LP | 7,074 | -41.28 | 406 | -29.02 | ||||
| 2025-08-14 | 13F | Balyasny Asset Management Llc | 37,202 | 2,135 | ||||||
| 2025-08-04 | 13F | Spinnaker Trust | 168,301 | -0.19 | 9,660 | 20.67 | ||||
| 2025-08-14 | 13F | Balyasny Asset Management Llc | Put | 75,000 | 4,305 | |||||
| 2025-08-27 | 13F/A | Squarepoint Ops LLC | 0 | -100.00 | 0 | -100.00 | ||||
| 2025-04-28 | 13F | Principal Financial Group Inc | 0 | -100.00 | 0 | |||||
| 2025-08-12 | 13F | Franklin Resources Inc | 43,443 | -65.95 | 2,494 | -58.85 | ||||
| 2025-08-12 | 13F | Zacks Investment Management | 35,639 | 13.54 | 2,046 | 37.25 | ||||
| 2025-08-14 | 13F | BLKBRD Asset Management, LP | 0 | -100.00 | 0 | |||||
| 2025-08-08 | 13F | SBI Securities Co., Ltd. | 2,905 | 4.72 | 167 | 26.72 | ||||
| 2025-07-16 | 13F | Banque Pictet & Cie Sa | 144,222 | 0.00 | 8,278 | 20.90 | ||||
| 2025-08-08 | 13F | City Of London Investment Management Co Ltd | 937,565 | 31.94 | 53,816 | 59.51 | ||||
| 2025-08-14 | 13F | CIBC World Markets Inc. | 0 | -100.00 | 0 | |||||
| 2025-08-11 | 13F | Nomura Asset Management Co Ltd | 151,780 | 0.32 | 8,712 | 21.29 | ||||
| 2025-04-14 | 13F | Cedar Mountain Advisors, LLC | 0 | -100.00 | 0 | |||||
| 2025-08-12 | 13F | Rhumbline Advisers | 110 | 0.00 | 6 | 20.00 | ||||
| 2025-07-21 | 13F | Mirae Asset Global Investments Co., Ltd. | 24,800 | 24.00 | 1,424 | 48.85 | ||||
| 2025-07-28 | 13F | BRYN MAWR TRUST Co | 6,300 | 0.00 | 362 | 20.74 | ||||
| 2025-05-16 | 13F | Coppell Advisory Solutions LLC | 0 | -100.00 | 0 | |||||
| 2025-08-14 | 13F | Arizona PSPRS Trust | 23,100 | 1,326 | ||||||
| 2025-07-29 | 13F | Ifrah Financial Services, Inc. | 4,899 | 281 | ||||||
| 2025-07-18 | 13F | Founders Capital Management | 33 | 0.00 | 2 | 0.00 | ||||
| 2025-08-06 | 13F | Pekin Hardy Strauss, Inc. | 18,740 | 1,076 | ||||||
| 2025-08-13 | 13F | Lido Advisors, LLC | 40,851 | 2,345 | ||||||
| 2025-08-14 | 13F | Ameriprise Financial Inc | 352,992 | -16.98 | 18,595 | -1.13 | ||||
| 2025-08-14 | 13F | Headlands Technologies LLC | 7,220 | 414 | ||||||
| 2025-08-08 | 13F | Cetera Investment Advisers | 4,860 | -8.68 | 279 | 10.71 | ||||
| 2025-08-05 | 13F | Castlekeep Investment Advisors Llc | 8,570 | -3.41 | 492 | 16.63 | ||||
| 2025-04-22 | 13F/A | NorthRock Partners, LLC | 0 | -100.00 | 0 | -100.00 | ||||
| 2025-07-28 | NP | EARAX - Eaton Vance Richard Bernstein All Asset Strategy Fund Class A | 54,068 | -68.84 | 2,832 | -67.88 | ||||
| 2025-07-18 | 13F | PFG Investments, LLC | 5,100 | 0.00 | 293 | 20.66 | ||||
| 2025-08-05 | 13F | Huntington National Bank | 0 | |||||||
| 2025-08-12 | 13F | Atlas Capital Advisors Llc | 939 | -3.59 | 54 | 15.22 | ||||
| 2025-08-11 | 13F | TD Waterhouse Canada Inc. | 50,573 | 6.78 | 2,909 | 27.94 | ||||
| 2025-08-13 | 13F | M&t Bank Corp | 5,065 | 3.64 | 291 | 25.00 | ||||
| 2025-07-29 | 13F | Millburn Ridgefield Corp | 1,079,103 | -11.28 | 61,941 | 7.26 | ||||
| 2025-07-24 | 13F | Us Bancorp \de\ | 970 | -6.46 | 56 | 12.24 | ||||
| 2025-07-31 | 13F | Caisse Des Depots Et Consignations | 225,000 | 0.00 | 12,852 | 19.87 | ||||
| 2025-08-07 | 13F | Zurcher Kantonalbank (Zurich Cantonalbank) | 5,597 | -34.64 | 327 | -20.68 | ||||
| 2025-08-14 | 13F | Susquehanna International Group, Llp | 358,647 | 482.07 | 20,586 | 603.79 | ||||
| 2025-08-11 | 13F | HighTower Advisors, LLC | 3,900 | 224 | ||||||
| 2025-08-13 | 13F | Sun Life Financial Inc | 1,892,950 | -1.26 | 109 | 18.68 | ||||
| 2025-08-14 | 13F | Susquehanna International Group, Llp | Call | 262,600 | 477.14 | 15,073 | 597.82 | |||
| 2025-08-14 | 13F | Susquehanna International Group, Llp | Put | 124,900 | -33.24 | 7,169 | -19.30 | |||
| 2025-08-12 | 13F | LPL Financial LLC | 434,612 | -3.93 | 24,947 | 16.14 | ||||
| 2025-08-14 | 13F | AllSquare Wealth Management LLC | 624 | 0.00 | 36 | 20.69 | ||||
| 2025-08-12 | 13F | American Century Companies Inc | 0 | -100.00 | 0 | |||||
| 2025-07-28 | NP | ERBAX - Eaton Vance Richard Bernstein Equity Strategy Fund Class A | 334,238 | -46.97 | 17,507 | -45.33 | ||||
| 2025-08-12 | 13F | Legal & General Group Plc | 635,303 | 0.00 | 36,451 | 20.78 | ||||
| 2025-08-14 | 13F | Maven Securities LTD | 3,607 | 207 | ||||||
| 2025-08-06 | 13F | Innealta Capital, Llc | 9,188 | 527 | ||||||
| 2025-08-12 | 13F | Jpmorgan Chase & Co | 1,068,662 | -9.28 | 61,341 | 9.68 | ||||
| 2025-08-14 | 13F | Vident Advisory, LLC | 7,901 | 11.58 | 454 | 34.82 | ||||
| 2025-07-22 | 13F | Knights of Columbus Asset Advisors LLC | 4,310 | 247 | ||||||
| 2025-08-06 | 13F | AE Wealth Management LLC | 170 | 709.52 | 10 | |||||
| 2025-08-07 | 13F | Cumberland Advisors Inc | 39,855 | 0.39 | 2,288 | 21.39 | ||||
| 2025-08-01 | 13F | Bessemer Group Inc | 7,617 | -0.96 | 0 | |||||
| 2025-08-14 | 13F | Bluefin Capital Management, Llc | 75,088 | 438.96 | 4,310 | 552.04 | ||||
| 2025-08-14 | 13F | Stifel Financial Corp | 4,281 | 246 | ||||||
| 2025-07-28 | 13F | Harbour Investments, Inc. | 49 | 0.00 | 3 | 0.00 | ||||
| 2025-08-13 | 13F | Northern Trust Corp | 2,510,875 | -15.30 | 144,124 | 2.40 | ||||
| 2025-08-12 | 13F | CIBC Private Wealth Group, LLC | 192,500 | 0.00 | 11,050 | 40.18 | ||||
| 2025-08-14 | 13F | Becker Capital Management Inc | 16,422 | 0.00 | 943 | 20.92 | ||||
| 2025-04-09 | 13F | Merit Financial Group, LLC | 0 | -100.00 | 0 | |||||
| 2025-05-15 | 13F | Wolverine Trading, Llc | 0 | -100.00 | 0 | -100.00 | ||||
| 2025-08-14 | 13F | Tudor Investment Corp Et Al | 74,032 | -62.25 | 4,249 | -54.37 | ||||
| 2025-08-27 | 13F/A | Squarepoint Ops LLC | Call | 600,000 | 34,440 | |||||
| 2025-08-27 | 13F/A | Squarepoint Ops LLC | Put | 600,000 | 34,440 | |||||
| 2025-08-14 | 13F | Comerica Bank | 659,387 | -6.22 | 37,849 | 13.38 | ||||
| 2025-07-29 | NP | BLUIX - BLUEPRINT GROWTH FUND Institutional Class | 10,743 | -2.63 | 563 | 0.36 | ||||
| 2025-04-24 | NP | ZEMRX - American Beacon Ninety One Emerging Markets Equity Fund R6 Class | 415,480 | 21,111 | ||||||
| 2025-07-28 | 13F | Credit Industriel Et Commercial | 0 | -100.00 | 0 | |||||
| 2025-08-13 | 13F | BCJ Capital Management, LLC | 7,421 | 426 | ||||||
| 2025-08-28 | NP | DMCY - DEMOCRACY INTERNATIONAL FUND Shares | 7,901 | 11.58 | 454 | 34.82 | ||||
| 2025-08-13 | 13F | Amundi | 93,560 | 52.38 | 5,497 | 94.41 | ||||
| 2025-07-25 | 13F | Cwm, Llc | 95 | 0.00 | 0 | |||||
| 2025-08-05 | 13F | Gould Asset Management Llc /ca/ | 16,460 | 2.49 | 945 | 23.88 | ||||
| 2025-05-13 | 13F | Cresset Asset Management, LLC | 0 | -100.00 | 0 | |||||
| 2025-08-08 | 13F | Gts Securities Llc | 0 | -100.00 | 0 | |||||
| 2025-07-23 | 13F | Elm3 Financial Group, LLC | 12,854 | 1.14 | 738 | 22.22 | ||||
| 2025-07-28 | 13F | Credit Industriel Et Commercial | Put | 0 | -100.00 | 0 | ||||
| 2025-08-08 | 13F | Altfest L J & Co Inc | 51,487 | 2,955 | ||||||
| 2025-08-14 | 13F | Bank Of America Corp /de/ | 375,463 | -35.93 | 21,552 | -22.54 | ||||
| 2025-07-02 | 13F/A | Bank Of Nova Scotia | 0 | -100.00 | 0 | -100.00 | ||||
| 2025-08-14 | 13F | New Vernon Capital Holdings II LLC | 136,776 | -97.38 | 7,851 | 7,101.83 | ||||
| 2025-08-12 | 13F | Elo Mutual Pension Insurance Co | 0 | -100.00 | 0 | |||||
| 2025-08-14 | 13F | Old Mission Capital Llc | 0 | -100.00 | 0 | |||||
| 2025-08-14 | 13F | Wasatch Advisors Inc | 0 | -100.00 | 0 | |||||
| 2025-07-22 | 13F | Checchi Capital Advisers, LLC | 71,718 | 2.11 | 4,117 | 23.46 | ||||
| 2025-08-18 | 13F/A | National Bank Of Canada /fi/ | 120 | 0.00 | 7 | 20.00 | ||||
| 2025-08-14 | 13F | Millennium Management Llc | 13,443 | -94.29 | 772 | -93.11 | ||||
| 2025-06-26 | NP | Arrow Investments Trust - Arrow DWA Country Rotation ETF | 12,476 | 18.24 | 592 | 9.23 | ||||
| 2025-08-13 | 13F | Knollwood Investment Advisory, LLC | 4,800 | 0.00 | 276 | 21.15 | ||||
| 2025-08-14 | 13F | USS Investment Management Ltd | 894,903 | 111.77 | 51,345 | 155.78 | ||||
| 2025-08-14 | 13F | Transamerica Financial Advisors, Inc. | 42 | 0.00 | 2 | |||||
| 2025-08-14 | 13F | Millennium Management Llc | Call | 6,800 | -89.34 | 390 | -87.12 | |||
| 2025-08-12 | 13F | Prudential Financial Inc | 282,570 | -0.15 | 16,220 | 20.71 | ||||
| 2025-08-13 | 13F | Fisher Asset Management, LLC | 23,468 | -18.82 | 1,347 | -1.82 | ||||
| 2025-07-31 | 13F | Ssa Swiss Advisors Ag | 1,171 | 0.00 | 70 | 25.45 | ||||
| 2025-08-14 | 13F | Zurich Insurance Group Ltd/FI | 68,690 | 0.00 | 3,959 | 9.79 | ||||
| 2025-07-22 | 13F | Sava Infond d.o.o. | 35,900 | 0.00 | 2,061 | 20.89 | ||||
| 2025-08-13 | 13F | Korea Investment CORP | 238,472 | -22.62 | 13,688 | -6.46 | ||||
| 2025-08-14 | 13F | Wellington Management Group Llp | 834,560 | 0.13 | 47,904 | 21.05 | ||||
| 2025-08-06 | 13F | Texas Yale Capital Corp. | 9,342 | 0.00 | 536 | 20.99 | ||||
| 2025-08-01 | 13F | Envestnet Asset Management Inc | 28,983 | 2.16 | 1,664 | 23.55 | ||||
| 2025-08-06 | 13F | Richard Bernstein Advisors LLC | 379,306 | -52.81 | 21,772 | -42.95 | ||||
| 2025-08-11 | 13F | Banque Cantonale Vaudoise | 37,779 | -0.36 | 2 | 100.00 | ||||
| 2025-08-14 | 13F | Michelson Medical Research Foundation, Inc. | 27,435 | 0.00 | 1,575 | 20.89 | ||||
| 2025-04-16 | 13F | Union Bancaire Privee, UBP SA | 0 | -100.00 | 0 | |||||
| 2025-08-13 | 13F | Sumitomo Mitsui Financial Group, Inc. | 114 | 7 | ||||||
| 2025-08-14 | 13F | CIBC Asset Management Inc | 9,982 | -15.02 | 573 | 2.69 | ||||
| 2025-05-15 | 13F | Fullerton Fund Management Co Ltd | 0 | -100.00 | 0 | |||||
| 2025-05-14 | 13F | Credit Agricole S A | 11,515 | 46.46 | 547 | 34.48 | ||||
| 2025-07-28 | 13F | Rosenberg Matthew Hamilton | 863 | 0.00 | 50 | 22.50 | ||||
| 2025-07-11 | 13F | Farther Finance Advisors, LLC | 852 | 0.24 | 49 | 20.00 | ||||
| 2025-08-19 | 13F | Advisory Services Network, LLC | 0 | -100.00 | 0 | |||||
| 2025-08-12 | 13F | BlackRock, Inc. | 4,060,576 | -10.87 | 233,077 | 7.75 | ||||
| 2025-07-29 | 13F | Private Wealth Management Group, LLC | 1,485 | 0.00 | 85 | 21.43 | ||||
| 2025-08-11 | 13F | Principal Securities, Inc. | 334 | 0.00 | 19 | 11.76 | ||||
| 2025-08-14 | 13F | Bnp Paribas Arbitrage, Sa | 2,085,693 | 393.41 | 119,719 | 496.50 | ||||
| 2025-08-11 | 13F | Citigroup Inc | 252,062 | -11.19 | 14,468 | 7.37 | ||||
| 2025-07-30 | 13F | Phillips Financial Management, Llc | 0 | -100.00 | 0 | |||||
| 2025-08-13 | 13F | Hsbc Holdings Plc | 229,213 | -8.13 | 13,159 | 11.09 | ||||
| 2025-08-28 | NP | SYMIX - AlphaCentric Symmetry Strategy Fund Class I | 2,455 | -2.42 | 141 | 7.69 | ||||
| 2025-08-01 | 13F | Unconventional Investor, LLC | 8,074 | -5.81 | 463 | 13.76 | ||||
| 2025-07-29 | 13F | Private Trust Co Na | 172 | -4.97 | 10 | 12.50 | ||||
| 2025-08-11 | 13F | Citigroup Inc | Call | 250,000 | 14,350 | |||||
| 2025-08-14 | 13F | Prelude Capital Management, Llc | 9,187 | 527 | ||||||
| 2025-08-08 | 13F | Pnc Financial Services Group, Inc. | 217 | 12 | ||||||
| 2025-08-12 | 13F | Global Retirement Partners, LLC | 5,775 | 7.84 | 331 | 19.49 | ||||
| 2025-08-14 | 13F | State Of Wisconsin Investment Board | 40,800 | 0.00 | 2,342 | 20.86 | ||||
| 2025-08-14 | 13F | Citadel Advisors Llc | 339,859 | 34.05 | 19,508 | 62.05 | ||||
| 2025-08-14 | 13F | Graham Capital Management, L.P. | Put | 80,500 | 4,621 | |||||
| 2025-04-17 | 13F | Factory Mutual Insurance Co | 0 | -100.00 | 0 | |||||
| 2025-08-14 | 13F | Citadel Advisors Llc | Put | 110,300 | -52.64 | 6,331 | -42.75 | |||
| 2025-07-22 | 13F | IMC-Chicago, LLC | 0 | -100.00 | 0 | |||||
| 2025-08-14 | 13F | Citadel Advisors Llc | Call | 6,700 | -49.62 | 385 | -39.14 | |||
| 2025-08-14 | 13F | Two Sigma Advisers, Lp | 0 | -100.00 | 0 | |||||
| 2025-08-04 | 13F | Migdal Insurance & Financial Holdings Ltd. | 4,170 | -15.24 | 0 | |||||
| 2025-08-11 | 13F | Frank, Rimerman Advisors LLC | 5,132 | 0.00 | 295 | 20.99 | ||||
| 2025-06-26 | NP | LGCAX - Lord Abbett Global Equity Research Fund Class A | 0 | -100.00 | 0 | -100.00 | ||||
| 2025-09-04 | 13F/A | Advisor Group Holdings, Inc. | 4,585 | 16.85 | 263 | 41.40 | ||||
| 2025-08-14 | 13F | D. E. Shaw & Co., Inc. | 0 | -100.00 | 0 | |||||
| 2025-08-14 | 13F | Millennium Management Llc | Put | 8,800 | -86.21 | 505 | -83.33 | |||
| 2025-08-13 | 13F | Mount Yale Investment Advisors, LLC | 103 | 6 | ||||||
| 2025-08-14 | 13F | Peak6 Llc | Put | 100 | -97.92 | 6 | -97.80 | |||
| 2025-08-14 | 13F | Peak6 Llc | Call | 27,200 | -9.03 | 1,561 | 10.01 | |||
| 2025-08-14 | 13F | Two Sigma Securities, Llc | 0 | -100.00 | 0 | |||||
| 2025-08-19 | 13F | National Asset Management, Inc. | 7,532 | 432 | ||||||
| 2025-08-19 | 13F | State of Wyoming | 104,330 | -0.69 | 5,989 | 20.05 | ||||
| 2025-04-24 | NP | AQLT - iShares MSCI Global Quality Factor ETF | 76,202 | 3,872 | ||||||
| 2025-07-23 | 13F | Nbt Bank N A /ny | 244 | 0.00 | 14 | 27.27 | ||||
| 2025-08-14 | 13F | Goldman Sachs Group Inc | 1,413,490 | 134.66 | 81,134 | 183.70 | ||||
| 2025-08-14 | 13F | Two Sigma Investments, Lp | 147,500 | 8,466 | ||||||
| 2025-07-31 | 13F | Nisa Investment Advisors, Llc | 26,300 | 61.35 | 1,510 | 95.21 | ||||
| 2025-08-13 | 13F | Townsquare Capital Llc | 0 | -100.00 | 0 | |||||
| 2025-07-23 | 13F | Vontobel Holding Ltd. | 53,997 | -6.05 | 3,099 | 13.60 | ||||
| 2025-07-16 | 13F | Meridian Investment Counsel Inc. | 11,474 | -3.98 | 659 | 16.05 | ||||
| 2025-08-08 | 13F | Geode Capital Management, Llc | 56,738 | 20.89 | ||||||
| 2025-08-14 | 13F | Group One Trading, L.p. | 4,099 | -76.88 | 235 | -72.06 | ||||
| 2025-08-14 | 13F | Wells Fargo & Company/mn | 101,590 | 43.27 | 5,831 | 73.23 | ||||
| 2025-08-08 | 13F | Creative Planning | 9,102 | -4.32 | 522 | 15.74 | ||||
| 2025-08-29 | NP | MBXAX - Catalyst/Millburn Hedge Strategy Fund Class A | 1,079,103 | -11.28 | 61,941 | 7.26 | ||||
| 2025-08-01 | 13F | Solstein Capital, LLC | 28 | -96.60 | 2 | -97.44 | ||||
| 2025-08-13 | 13F | Arrowstreet Capital, Limited Partnership | 1,905,456 | 2,378.16 | 109,373 | 2,896.52 | ||||
| 2025-08-15 | 13F | Tower Research Capital LLC (TRC) | 152 | 7,500.00 | 9 | |||||
| 2025-07-11 | 13F | Arrow Investment Advisors, LLC | 0 | -100.00 | 0 | |||||
| 2025-07-11 | 13F/A | Financiere des Professionnels - Fonds d,investissement inc. | 50,000 | 0.00 | 2,870 | 20.89 | ||||
| 2025-05-15 | 13F | DZ BANK AG Deutsche Zentral Genossenschafts Bank, Frankfurt am Main | 0 | -100.00 | 0 | |||||
| 2025-07-22 | 13F | 4Thought Financial Group Inc. | 90 | 1.12 | 5 | 25.00 | ||||
| 2025-07-16 | 13F/A | CX Institutional | 495 | -15.67 | 0 | |||||
| 2025-08-28 | NP | ICCIX - Dynamic International Opportunity Fund Class I | 9,092 | -42.38 | 522 | -36.15 | ||||
| 2025-08-11 | 13F | Covestor Ltd | 29 | -17.14 | 0 | |||||
| 2025-08-13 | 13F | Invesco Ltd. | 1,111,646 | 16.14 | 63,808 | 40.41 | ||||
| 2025-08-13 | 13F | PineBridge Investments, L.P. | 97,197 | -24.58 | 5,579 | -8.82 | ||||
| 2025-08-14 | 13F | Royal Bank Of Canada | 8,423 | -94.26 | 484 | -93.05 | ||||
| 2025-08-14 | 13F | GWM Advisors LLC | 250 | 0.00 | 14 | 27.27 | ||||
| 2025-05-15 | 13F | Cullen Capital Management, LLC | 125,835 | -56.56 | 5,975 | -60.16 | ||||
| 2025-07-25 | 13F | Allspring Global Investments Holdings, LLC | 89,049 | -35.50 | 5,111 | -22.03 | ||||
| 2025-08-07 | 13F | Acadian Asset Management Llc | 0 | -100.00 | 0 | |||||
| 2025-08-11 | 13F | Mount Lucas Management LP | 16,562 | 951 | ||||||
| 2025-08-14 | 13F | Toronto Dominion Bank | 5 | 0.00 | 0 | |||||
| 2025-07-03 | 13F | Fiduciary Financial Group, Llc | 6,951 | 0.67 | 400 | 33.78 | ||||
| 2025-07-23 | 13F | Venturi Wealth Management, LLC | 0 | -100.00 | 0 | |||||
| 2025-08-14 | 13F | Mml Investors Services, Llc | 8,129 | -28.71 | 0 | |||||
| 2025-07-30 | 13F | Journey Advisory Group, LLC | 43,385 | 2,490 | ||||||
| 2025-08-13 | 13F | Schroder Investment Management Group | 1,677,273 | 4,066.31 | 97,030 | 4,940.52 | ||||
| 2025-04-08 | 13F | Investors Research Corp | 0 | -100.00 | 0 | |||||
| 2025-07-25 | 13F | Yousif Capital Management, Llc | 657,868 | -6.18 | 37,762 | 13.42 | ||||
| 2025-08-01 | 13F | Oversea-Chinese Banking CORP Ltd | 81,885 | -12.71 | 4,700 | 5.52 | ||||
| 2025-08-12 | 13F | Trexquant Investment LP | 0 | -100.00 | 0 | |||||
| 2025-08-26 | NP | Forethought Variable Insurance Trust - Global Atlantic BlackRock Disciplined International Core Portfolio Class I Shares | 115,818 | -11.20 | 6,648 | 7.35 | ||||
| 2025-04-17 | 13F | Hanson & Doremus Investment Management | 0 | -100.00 | 0 | |||||
| 2025-08-05 | 13F | Bank of New York Mellon Corp | 312,994 | -10.74 | 17,966 | 7.91 | ||||
| 2025-08-14 | 13F | Barometer Capital Management Inc. | 3,300 | 189 | ||||||
| 2025-07-16 | 13F | Register Financial Advisors LLC | 50 | 0.00 | 3 | 0.00 | ||||
| 2025-08-07 | 13F | Axiom International Investors Llc /de | 18,000 | 13.21 | 1,033 | 37.00 | ||||
| 2025-07-08 | 13F | Boltwood Capital Management | 9,500 | -5.94 | 545 | 13.78 | ||||
| 2025-08-05 | 13F | Bank Of Montreal /can/ | 2,816 | 177.17 | 162 | 235.42 | ||||
| 2025-08-14 | 13F | Optiver Holding B.V. | 18,072 | 1,037 | ||||||
| 2025-05-13 | 13F | Quadrature Capital Ltd | 0 | -100.00 | 0 | -100.00 | ||||
| 2025-08-19 | 13F | Newbridge Financial Services Group, Inc. | 14 | 0.00 | 1 | |||||
| 2025-07-30 | 13F | Phoenix Holdings Ltd. | 5,750 | 0.00 | 330 | 20.88 | ||||
| 2025-08-08 | 13F | SG Americas Securities, LLC | 1,931 | -15.97 | 0 | |||||
| 2025-08-14 | 13F | Federation des caisses Desjardins du Quebec | 45,041 | 13.02 | 2,585 | 36.63 | ||||
| 2025-08-14 | 13F | Kovitz Investment Group Partners, LLC | 6,328 | 27.61 | 363 | 54.47 | ||||
| 2025-08-14 | 13F | Boothbay Fund Management, Llc | 12,385 | 711 | ||||||
| 2025-08-18 | 13F | Wolverine Trading, Llc | Call | 7,800 | 451 | |||||
| 2025-08-25 | 13F/A | Neuberger Berman Group LLC | 81,971 | -7.70 | 4,705 | 11.60 | ||||
| 2025-08-12 | 13F | Proequities, Inc. | 0 | 0 | ||||||
| 2025-08-18 | 13F | Wolverine Trading, Llc | Put | 4,600 | -61.02 | 266 | -52.84 | |||
| 2025-08-14 | 13F | UBS Group AG | Call | 10,040 | -45.95 | 576 | -34.62 | |||
| 2025-05-15 | 13F | CAPROCK Group, Inc. | 12,355 | 0.00 | 587 | -8.29 | ||||
| 2025-07-09 | 13F | Breakwater Investment Management | 935 | 0.00 | 54 | 20.45 | ||||
| 2025-08-14 | 13F | UBS Group AG | 523,858 | 117.07 | 30,069 | 162.43 | ||||
| 2025-05-13 | 13F | Horizon Investments, LLC | 0 | -100.00 | 0 | |||||
| 2025-08-14 | 13F | Qube Research & Technologies Ltd | 3,152 | 181 | ||||||
| 2025-07-29 | 13F | Lyell Wealth Management, Lp | 5,125 | 0.00 | 294 | 20.99 | ||||
| 2025-08-08 | 13F | Foundations Investment Advisors, LLC | 0 | -100.00 | 0 | |||||
| 2025-08-14 | 13F | Driehaus Capital Management Llc | 44,113 | 2,532 | ||||||
| 2025-08-14 | 13F | Jane Street Group, Llc | 262,590 | 15,073 | ||||||
| 2025-07-25 | NP | PUTNAM FUNDS TRUST - Putnam Dynamic Asset Allocation Equity Fund Class A | 1,038 | 0.00 | 54 | 3.85 | ||||
| 2025-05-14 | 13F | Idaho Trust Bank | 0 | -100.00 | 0 | |||||
| 2025-08-14 | 13F | Value Aligned Research Advisors, LLC | Put | 8,000 | 459 | |||||
| 2025-07-15 | 13F | Pictet North America Advisors SA | 32,409 | 0.00 | 1,860 | 20.94 | ||||
| 2025-07-31 | 13F | Jordan Park Group LLC | 574,025 | 0.00 | 32,949 | 20.90 | ||||
| 2025-08-13 | 13F | Renaissance Technologies Llc | 13,100 | 752 | ||||||
| 2025-08-14 | 13F | Jane Street Group, Llc | Put | 10,000 | 574 | |||||
| 2025-08-14 | 13F | Jane Street Group, Llc | Call | 20,500 | 201.47 | 1,177 | 265.22 | |||
| 2025-04-22 | 13F | Cambridge Investment Research Advisors, Inc. | 0 | -100.00 | 0 | |||||
| 2025-05-02 | 13F | Edgestream Partners, L.P. | 0 | -100.00 | 0 | |||||
| 2025-08-14 | 13F | Ubs Asset Management Americas Inc | 307,309 | -6.88 | 17,640 | 12.58 | ||||
| 2025-08-13 | 13F | Continuum Advisory, LLC | 0 | -100.00 | 0 | |||||
| 2025-07-24 | 13F | Ronald Blue Trust, Inc. | 8,819 | -38.59 | 506 | -25.70 | ||||
| 2025-08-15 | 13F | State of Tennessee, Treasury Department | 16,006,156 | 0.16 | 918,753 | 21.08 | ||||
| 2025-08-28 | NP | Northern Lights Fund Trust - Ocean Park International ETF | 1,282 | 120.65 | 74 | 143.33 | ||||
| 2025-08-11 | 13F | Hexagon Capital Partners LLC | 0 | -100.00 | 0 | |||||
| 2025-07-17 | 13F | V-Square Quantitative Management LLC | 24,127 | 8.24 | 1,385 | 30.81 | ||||
| 2025-07-30 | 13F | Whittier Trust Co | 294 | 0.00 | 17 | 23.08 | ||||
| 2025-04-21 | 13F | Ayalon Holdings Ltd. | 0 | -100.00 | 0 | |||||
| 2025-08-06 | 13F | Commonwealth Equity Services, Llc | 7,346 | -3.76 | 0 | |||||
| 2025-05-15 | 13F | Main Management LLC | 0 | -100.00 | 0 | |||||
| 2025-08-14 | 13F | Integrated Wealth Concepts LLC | 30,294 | 94.93 | 1,739 | 135.82 | ||||
| 2025-07-11 | 13F | Caldwell Securities, Inc | 0 | -100.00 | 0 | |||||
| 2025-07-21 | 13F | Franklin Street Advisors Inc /nc | 10,000 | 0.00 | 1 | |||||
| 2025-07-31 | 13F | Sumitomo Mitsui Trust Holdings, Inc. | 60,743 | 5.51 | 3,487 | 27.55 | ||||
| 2025-07-09 | 13F | Finley Financial, LLC | 1,745 | 0.00 | 100 | 21.95 | ||||
| 2025-08-08 | 13F | Larson Financial Group LLC | 0 | -100.00 | 0 |