Mga Batayang Estadistika
| Pemilik Institusional | 385 total, 385 long only, 0 short only, 0 long/short - change of 17.22% MRQ |
| Alokasi Portofolio Rata-rata | 0.3021 % - change of 9.63% MRQ |
| Saham Institusional (Jangka Panjang) | 101,769,756 (ex 13D/G) - change of 16.33MM shares 19.11% MRQ |
| Nilai Institusional (Jangka Panjang) | $ 5,597,922 USD ($1000) |
Kepemilikan Institusional dan Pemegang Saham
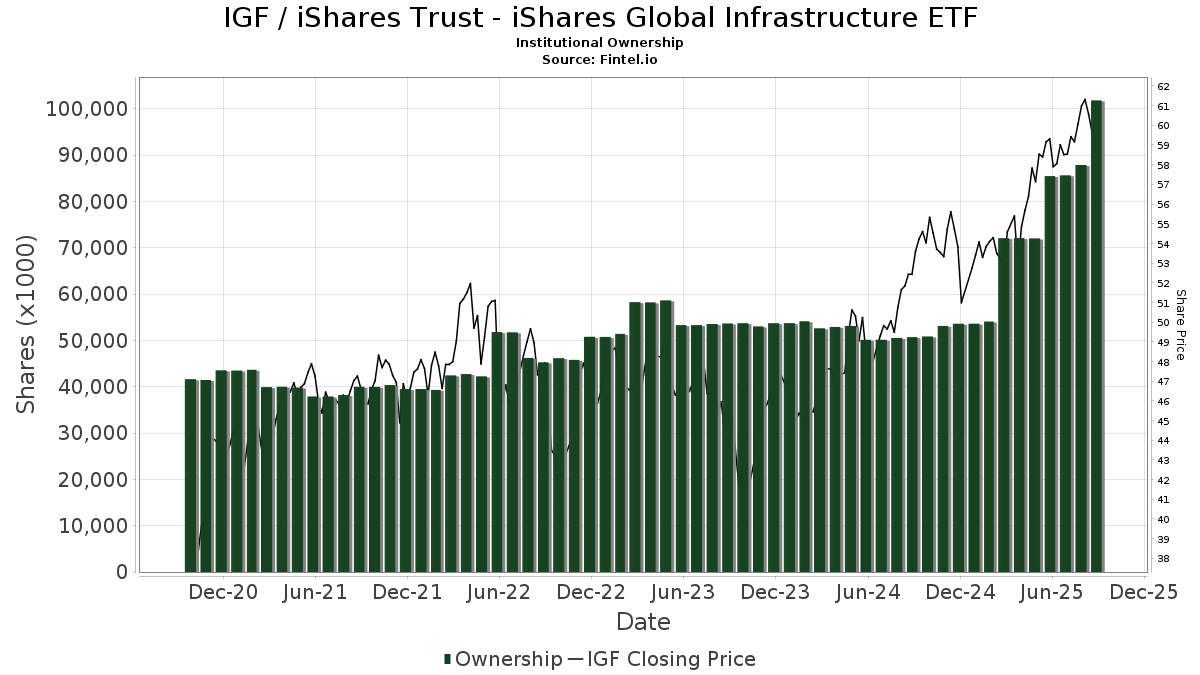
iShares Trust - iShares Global Infrastructure ETF (US:IGF) memiliki 385 pemilik institusional dan pemegang saham yang telah mengajukan formulir 13D/G atau 13F kepada Komisi Bursa Efek (Securities Exchange Commission/SEC). Lembaga-lembaga ini memegang total 101,769,756 saham. Pemegang saham terbesar meliputi Northern Trust Corp, BlackRock, Inc., LPL Financial LLC, Proficio Capital Partners LLC, BlackRock Funds III - BLACKROCK LIFEPATH INDEX 2040 FUND Investor A, Pathstone Holdings, LLC, BlackRock Funds III - BLACKROCK LIFEPATH INDEX 2035 FUND Investor A, BlackRock Funds III - BLACKROCK LIFEPATH INDEX 2030 FUND Investor A, BlackRock Funds III - BLACKROCK LIFEPATH INDEX RETIREMENT FUND Investor A, and Ballentine Partners, LLC .
Struktur kepemilikan institusional iShares Trust - iShares Global Infrastructure ETF (NasdaqGM:IGF) menunjukkan posisi terkini di perusahaan oleh institusi dan dana, serta perubahan terbaru dalam ukuran posisi. Pemegang saham utama dapat mencakup investor individu, reksa dana, dana lindung nilai, atau institusi. Jadwal 13D menunjukkan bahwa investor memegang (atau pernah memegang) lebih dari 5% saham perusahaan dan bermaksud (atau pernah bermaksud) untuk secara aktif mengejar perubahan strategi bisnis. Jadwal 13G menunjukkan investasi pasif lebih dari 5%.
The share price as of September 5, 2025 is 59.87 / share. Previously, on September 9, 2024, the share price was 52.41 / share. This represents an increase of 14.23% over that period.
Skor Sentimen Dana
Skor Sentimen Dana (sebelumnya dikenal sebagai Skor Akumulasi Kepemilikan) menemukan saham-saham yang paling banyak dibeli oleh dana. Ini adalah hasil dari model kuantitatif multi-faktor yang canggih yang mengidentifikasi perusahaan dengan tingkat akumulasi institusional tertinggi. Model penilaian menggunakan kombinasi dari total peningkatan pemilik yang diungkapkan, perubahan dalam alokasi portofolio pada pemilik tersebut, dan metrik lainnya. Angka berkisar dari 0 hingga 100, dengan angka yang lebih tinggi menunjukkan tingkat akumulasi yang lebih tinggi dibandingkan dengan perusahaan sejenisnya, dan 50 adalah rata-ratanya.
Frekuensi Pembaruan: Setiap Hari
Lihat Ownership Explorer, yang menyediakan daftar perusahaan dengan peringkat tertinggi.
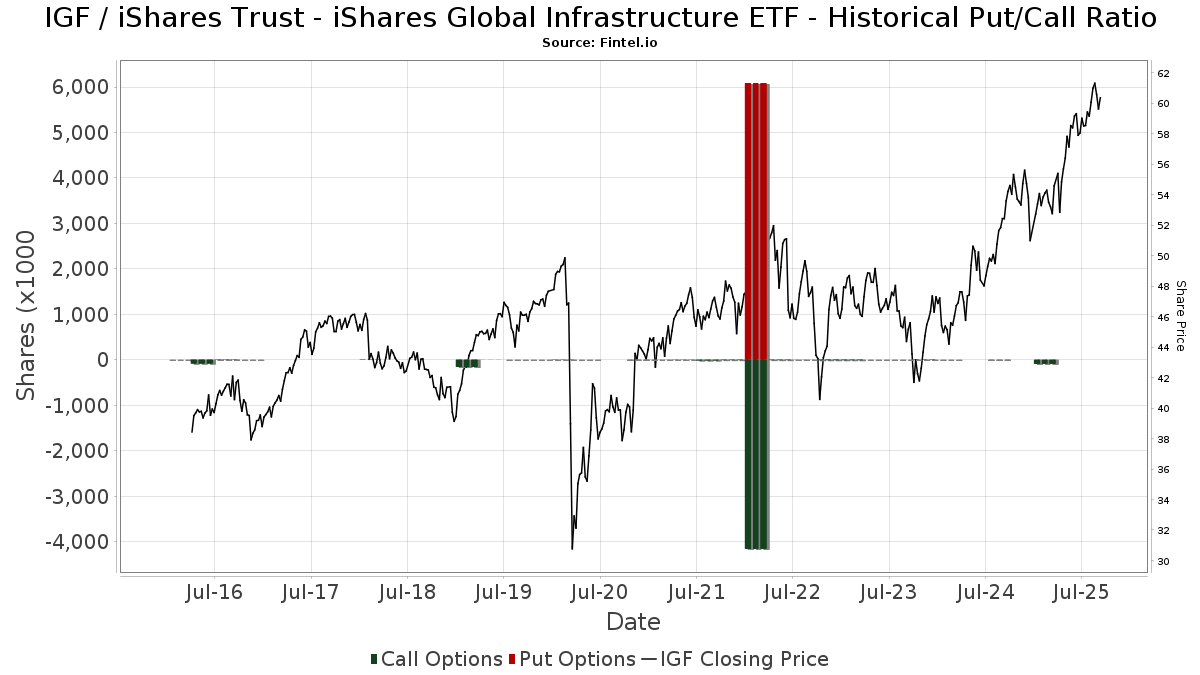
Rasio Put/Call Institusional
Selain melaporkan isu ekuitas dan utang standar, institusi dengan aset di bawah manajemen lebih dari 100 juta dolar AS juga harus mengungkapkan kepemilikan opsi put dan call mereka. Karena opsi put umumnya menunjukkan sentimen negatif, dan opsi call menunjukkan sentimen positif, kita dapat mengetahui sentimen institusional secara keseluruhan dengan memplot rasio put terhadap call. Grafik di sebelah kanan memplot rasio put/call historis untuk instrumen ini.
Menggunakan Rasio Put/Call sebagai indikator sentimen investor mengatasi salah satu kekurangan utama dari penggunaan total kepemilikan institusional, yaitu sejumlah besar aset yang dikelola diinvestasikan secara pasif untuk melacak indeks. Dana yang dikelola secara pasif biasanya tidak membeli opsi, sehingga indikator rasio put/call lebih akurat dalam melacak sentimen dana yang dikelola secara aktif.
Pengajuan 13D/G
Kami menyajikan pengajuan 13D/G secara terpisah dari pengajuan 13F karena perlakuan yang berbeda oleh SEC. Pengajuan 13D/G dapat diajukan oleh kelompok investor (dengan satu pemimpin), sedangkan pengajuan 13F tidak bisa. Hal ini mengakibatkan situasi di mana seorang investor dapat mengajukan 13D/G yang melaporkan satu nilai untuk total saham (mewakili semua saham yang dimiliki oleh kelompok investor), tetapi kemudian mengajukan 13F yang melaporkan nilai yang berbeda untuk total saham (mewakili kepemilikan mereka sendiri). Ini berarti bahwa kepemilikan saham dari pengajuan 13D/G dan pengajuan 13F seringkali tidak dapat dibandingkan secara langsung, sehingga kami menyajikannya secara terpisah.
Catatan: Mulai 16 Mei 2021, kami tidak lagi menampilkan pemilik yang belum mengajukan 13D/G dalam setahun terakhir. Sebelumnya, kami menampilkan riwayat lengkap pengajuan 13D/G. Secara umum, entitas yang diwajibkan untuk mengajukan pengajuan 13D/G harus mengajukan setidaknya setiap tahun sebelum mengirimkan pengajuan penutupan. Namun, terkadang dana keluar dari posisi tanpa mengirimkan pengajuan penutupan (misalnya, mereka menghentikan operasi), sehingga menampilkan riwayat lengkap terkadang menyebabkan kebingungan tentang kepemilikan saat ini. Untuk mencegah kebingungan, kami sekarang hanya menampilkan pemilik 'saat ini' - yaitu - pemilik yang telah mengajukan dalam setahun terakhir.
Upgrade to unlock premium data.
| Tanggal File | Formulir | Investor | Sebelumnya Saham |
Terbaru Saham |
Δ Saham (Persen) |
Kepemilikan (Persen) |
Δ Pagmamay-ari (Persen) |
|
|---|---|---|---|---|---|---|---|---|
| 2025-07-15 | BlackRock Portfolio Management LLC | 17,418,019 | 17,411,811 | -0.04 | 13.80 | -12.10 | ||
| 2025-02-07 | BlackRock, Inc. | 0 | 0.00 |
Pengajuan 13F dan NPORT
Detail pada pengajuan 13F tersedia gratis. Detail pada pengajuan NP memerlukan keanggotaan premium. Baris berwarna hijau menunjukkan posisi baru. Baris berwarna merah menunjukkan posisi yang sudah ditutup. Klik tautan ini ikon untuk melihat riwayat transaksi selengkapnya.
Tingkatkan
untuk membuka data premium dan mengekspor ke Excel ![]() .
.
| Tanggal File | Sumber | Investor | Ketik | Presyo ng Avg (Silangan) |
Saham | Δ Saham (%) |
Dilaporkan Nilai ($1000) |
Nilai Δ (%) |
Alokasi Port (%) |
|
|---|---|---|---|---|---|---|---|---|---|---|
| 2025-07-09 | 13F | VisionPoint Advisory Group, LLC | 11,361 | 673 | ||||||
| 2025-07-17 | 13F | Worth Financial Advisory Group, LLC | 8,414 | 27.60 | 498 | 38.33 | ||||
| 2025-08-07 | 13F | Allworth Financial LP | 1,340 | 95.34 | 79 | 107.89 | ||||
| 2025-06-27 | NP | TRTY - Cambria Trinity ETF | 38,792 | 2,187 | ||||||
| 2025-04-29 | 13F | Wood Tarver Financial Group, LLC | 0 | -100.00 | 0 | |||||
| 2025-07-29 | 13F | Stratos Wealth Partners, LTD. | 3,743 | 1.55 | 222 | 9.95 | ||||
| 2025-08-19 | 13F | Advisory Services Network, LLC | 27,895 | -6.27 | 1,648 | 1.35 | ||||
| 2025-08-14 | 13F | Synovus Financial Corp | 5,472 | -6.29 | 324 | 1.25 | ||||
| 2025-08-07 | 13F | Tacita Capital Inc | 345 | 0.00 | 20 | 11.11 | ||||
| 2025-08-14 | 13F | D. E. Shaw & Co., Inc. | 146,694 | 1,359.35 | 8,684 | 1,481.79 | ||||
| 2025-08-26 | NP | LPREX - BlackRock LifePath Dynamic 2040 Fund Investor A Shares | 150,921 | 0.00 | 8,935 | 8.29 | ||||
| 2025-07-23 | 13F | Sunbeam Capital Management, LLC | 9,368 | 0.00 | 555 | 8.20 | ||||
| 2025-08-06 | 13F | Commonwealth Equity Services, Llc | 68,624 | 95.60 | 4 | 300.00 | ||||
| 2025-08-08 | 13F | Principal Financial Group Inc | 658,091 | -67.92 | 38,959 | -65.27 | ||||
| 2025-08-13 | 13F | Northern Trust Corp | 28,568,006 | 9.89 | 1,691,226 | 18.99 | ||||
| 2025-08-11 | 13F | NewEdge Wealth, LLC | 4,797 | 290 | ||||||
| 2025-08-11 | 13F | TD Waterhouse Canada Inc. | 456,556 | -3.49 | 26,948 | 4.07 | ||||
| 2025-07-29 | NP | JRTKX - Multi-Index 2035 Lifetime Portfolio Class 1 | 56,645 | -4.28 | 3,342 | 5.63 | ||||
| 2025-08-06 | 13F | Anchor Capital Advisors Llc | 16,596 | -0.70 | 982 | 7.56 | ||||
| 2025-08-12 | 13F | Stelac Advisory Services LLC | 61,126 | -2.29 | 3,618 | 5.82 | ||||
| 2025-07-24 | 13F | JB Capital LLC | 6,338 | 375 | ||||||
| 2025-08-06 | 13F | Legacy Bridge, LLC | 317 | 0.00 | 19 | 5.88 | ||||
| 2025-08-14 | 13F | Glen Eagle Advisors, LLC | 72 | 0.00 | 4 | 33.33 | ||||
| 2025-08-12 | 13F | Proequities, Inc. | 0 | 0 | ||||||
| 2025-08-11 | 13F | First American Trust, Fsb | 165,498 | 4,116.51 | 9,797 | 4,478.04 | ||||
| 2025-08-13 | 13F | Schroder Investment Management Group | 3,100 | -8.82 | 184 | -1.08 | ||||
| 2025-08-26 | NP | BlackRock Funds III - BLACKROCK LIFEPATH INDEX 2035 FUND Investor A This fund is a listed as child fund of BlackRock, Inc. and if that institution has disclosed ownership in this security, then these positions will not be double counted when calculating total shares and total value | 3,410,632 | -0.69 | 201,909 | 7.54 | ||||
| 2025-07-31 | 13F | Waldron Private Wealth LLC | 648,780 | -1.56 | 38,408 | 6.60 | ||||
| 2025-08-14 | 13F | Aqr Capital Management Llc | 19,064 | 1,129 | ||||||
| 2025-08-26 | NP | CRTOX - Conquer Risk Tactical Opportunities Fund | 169,697 | 20.95 | 10,046 | 31.56 | ||||
| 2025-08-12 | 13F | Boreal Capital Management LLC | 2,024 | 120 | ||||||
| 2025-06-23 | NP | ITDB - iShares LifePath Target Date 2030 ETF | 6,446 | 23.70 | 363 | 31.05 | ||||
| 2025-08-12 | 13F | Change Path, LLC | 7,102 | 420 | ||||||
| 2025-07-21 | 13F | Sageworth Trust Co | 59,049 | 3,496 | ||||||
| 2025-08-14 | 13F | Benjamin Edwards Inc | 4,287 | -3.94 | 254 | 4.12 | ||||
| 2025-08-06 | 13F | Moors & Cabot, Inc. | 6,729 | 13.07 | 398 | 22.46 | ||||
| 2025-08-12 | 13F | SRS Capital Advisors, Inc. | 200 | 0.00 | 12 | 10.00 | ||||
| 2025-07-08 | 13F | Parallel Advisors, LLC | 136 | 0.00 | 8 | 14.29 | ||||
| 2025-08-13 | 13F | Providence Capital Advisors, LLC | 368 | 22 | ||||||
| 2025-08-06 | 13F | Rialto Wealth Management, LLC | 64 | 0.00 | 4 | 0.00 | ||||
| 2025-08-14 | 13F | Old Mission Capital Llc | 95,088 | -67.23 | 5,629 | -64.51 | ||||
| 2025-07-16 | 13F | Banque Pictet & Cie Sa | 30,235 | 1.53 | 1,790 | 9.89 | ||||
| 2025-08-13 | 13F | Cambria Investment Management, L.P. | 149,918 | -3.23 | 8,875 | 4.79 | ||||
| 2025-07-10 | 13F | Wealth Enhancement Advisory Services, Llc | 30,015 | -9.12 | 1,772 | -1.83 | ||||
| 2025-07-16 | 13F/A | CX Institutional | 98,891 | -61.40 | 6 | -64.29 | ||||
| 2025-08-06 | 13F | Hoxton Planning & Management, LLC | 8,310 | 3.77 | 492 | 12.36 | ||||
| 2025-07-29 | NP | JRTGX - Multi-Index 2030 Lifetime Portfolio Class 1 | 74,675 | -4.50 | 4,406 | 5.36 | ||||
| 2025-08-08 | 13F | Capstone Financial Advisors, Inc. | 111,454 | 0.55 | 6,598 | 8.90 | ||||
| 2025-08-04 | 13F | Keybank National Association/oh | 131,958 | -4.38 | 7,812 | 3.54 | ||||
| 2025-08-14 | 13F | Mml Investors Services, Llc | 22,744 | 59.81 | 1 | |||||
| 2025-04-22 | 13F/A | NorthRock Partners, LLC | 0 | -100.00 | 0 | -100.00 | ||||
| 2025-08-08 | 13F | Hartland & Co., LLC | 50,856 | 3.06 | 3,011 | 11.61 | ||||
| 2025-08-14 | 13F/A | Rockefeller Capital Management L.P. | 12,734 | 754 | ||||||
| 2025-08-04 | 13F | Mesirow Financial Investment Management, Inc. | 25,074 | -22.29 | 1,484 | -15.87 | ||||
| 2025-08-12 | 13F | Integrated Advisors Network LLC | 11,872 | 703 | ||||||
| 2025-05-08 | 13F | Heritage Wealth Advisors | 0 | -100.00 | 0 | |||||
| 2025-08-13 | 13F | Quadrant Capital Group Llc | 10,978 | -26.15 | 650 | -20.07 | ||||
| 2025-07-17 | 13F | Janney Montgomery Scott LLC | 146,371 | -1.59 | 9 | 0.00 | ||||
| 2025-08-13 | 13F | Pictet Asset Management Holding SA | 211,620 | 33.68 | 12,420 | 44.04 | ||||
| 2025-07-30 | 13F | Financial Perspectives, Inc | 946 | 0.00 | 56 | 9.80 | ||||
| 2025-08-14 | 13F | Gotham Asset Management, LLC | 39,370 | 0.00 | 2,331 | 8.27 | ||||
| 2025-08-26 | NP | BlackRock Funds III - BLACKROCK LIFEPATH INDEX 2050 FUND Investor A This fund is a listed as child fund of BlackRock, Inc. and if that institution has disclosed ownership in this security, then these positions will not be double counted when calculating total shares and total value | 16,796 | 994 | ||||||
| 2025-07-24 | 13F | Blair William & Co/il | 2,872 | 2.53 | 170 | 11.11 | ||||
| 2025-08-14 | 13F | Wetherby Asset Management Inc | 139,943 | 8,285 | ||||||
| 2025-05-01 | 13F | Grant/GrossMendelsohn, LLC | 11,130 | 0.00 | 631 | 8.43 | ||||
| 2025-08-14 | 13F | Keebeck Wealth Management, LLC | 5,063 | -26.77 | 300 | -20.69 | ||||
| 2025-08-01 | 13F | Rossby Financial, LCC | 31 | 2 | ||||||
| 2025-08-14 | 13F | Fmr Llc | 16,552 | -14.95 | 980 | -7.90 | ||||
| 2025-08-27 | 13F/A | Squarepoint Ops LLC | 6,118 | 362 | ||||||
| 2025-08-14 | 13F | Integrated Wealth Concepts LLC | 61,502 | 2.43 | 3,641 | 10.91 | ||||
| 2025-08-14 | 13F | Comerica Bank | 44,703 | 4.75 | 2,646 | 13.42 | ||||
| 2025-08-13 | 13F | Johnson Financial Group, Inc. | 88,276 | -0.81 | 5,226 | 7.40 | ||||
| 2025-06-23 | NP | IRTR - iShares LifePath Retirement ETF | 2,985 | -0.07 | 168 | 6.33 | ||||
| 2025-07-25 | 13F | Atria Wealth Solutions, Inc. | 17,256 | 181.55 | 1,019 | 204.18 | ||||
| 2025-08-13 | 13F | MONECO Advisors, LLC | 5,873 | -1.19 | 348 | 7.10 | ||||
| 2025-07-15 | 13F | Mather Group, Llc. | 0 | -100.00 | 0 | |||||
| 2025-08-13 | 13F | Capital Analysts, Inc. | 11,206 | 0.00 | 1 | |||||
| 2025-07-30 | 13F | Clune & Associates, Ltd. | 5,380 | 1.55 | 318 | 10.03 | ||||
| 2025-08-14 | 13F | EP Wealth Advisors, Inc. | 2,832 | 168 | ||||||
| 2025-07-10 | 13F | Exchange Traded Concepts, Llc | 0 | -100.00 | 0 | |||||
| 2025-07-21 | 13F | Creative Capital Management Investments LLC | 133 | 8 | ||||||
| 2025-08-14 | 13F | Dagco, Inc. | 430 | 25 | ||||||
| 2025-04-28 | 13F | Miller Howard Investments Inc /ny | 0 | -100.00 | 0 | |||||
| 2025-08-08 | 13F | Cetera Investment Advisers | 91,356 | 20.99 | 5,408 | 31.01 | ||||
| 2025-08-14 | 13F | Bnp Paribas Arbitrage, Sa | 132,098 | 72.57 | 7,820 | 86.90 | ||||
| 2025-05-09 | 13F | Manchester Capital Management LLC | 0 | -100.00 | 0 | -100.00 | ||||
| 2025-07-25 | 13F | Concurrent Investment Advisors, LLC | 9,235 | 130.88 | 547 | 150.46 | ||||
| 2025-08-12 | 13F | LPL Financial LLC | 9,044,618 | 9.85 | 535,441 | 18.95 | ||||
| 2025-08-01 | 13F | Penobscot Wealth Management | 21,982 | 15.82 | 1,301 | 25.46 | ||||
| 2025-05-13 | 13F | Coston, McIsaac & Partners | 0 | -100.00 | 0 | |||||
| 2025-08-14 | 13F | Raymond James Financial Inc | 276,566 | 76.31 | 16,373 | 90.93 | ||||
| 2025-08-15 | 13F | CI Private Wealth, LLC | 17,711 | 24.20 | 1,048 | 34.53 | ||||
| 2025-07-22 | 13F | Simplicity Wealth,LLC | 0 | -100.00 | 0 | |||||
| 2025-08-11 | 13F | Beaumont Capital Management, LLC | 20,002 | 1,184 | ||||||
| 2025-08-28 | NP | GPMIX - GuidePath(R) Multi-Asset Income Allocation Fund Service Shares | 5,878 | 348 | ||||||
| 2025-08-13 | 13F | Northwestern Mutual Wealth Management Co | 53,096 | 20.18 | 3,143 | 30.14 | ||||
| 2025-08-11 | 13F | Nomura Asset Management Co Ltd | 7,006 | 96.36 | 415 | 112.31 | ||||
| 2025-08-13 | 13F | Nicolet Advisory Services, Llc | 70,082 | -7.96 | 4,149 | 3.26 | ||||
| 2025-08-11 | 13F | HighTower Advisors, LLC | 150,880 | -1.10 | 8,932 | 7.10 | ||||
| 2025-04-17 | 13F | Montecito Bank & Trust | 9,427 | -9.94 | 515 | -5.85 | ||||
| 2025-07-25 | 13F | Heartland Bank & Trust Co | 306,162 | -6.90 | 18,125 | 0.81 | ||||
| 2025-08-04 | 13F | Wolverine Asset Management Llc | 10,350 | 613 | ||||||
| 2025-07-11 | 13F | Essex Savings Bank | 3,534 | 209 | ||||||
| 2025-07-17 | 13F | City Holding Co | 2,271 | 3.89 | 134 | 12.61 | ||||
| 2025-08-14 | 13F | AllSquare Wealth Management LLC | 85 | 0.00 | 5 | 25.00 | ||||
| 2025-06-30 | NP | PFADX - RiskPro® PFG 0-15 Fund Class R | 38,521 | -4.54 | 2,172 | 1.21 | ||||
| 2025-08-27 | NP | ACEFX - Absolute Strategies Fund Institutional Shares | 0 | -100.00 | 0 | -100.00 | ||||
| 2025-08-12 | 13F | Ci Investments Inc. | 496,192 | 0.00 | 29 | 7.41 | ||||
| 2025-08-26 | NP | BlackRock Funds III - BLACKROCK LIFEPATH INDEX RETIREMENT FUND Investor A This fund is a listed as child fund of BlackRock, Inc. and if that institution has disclosed ownership in this security, then these positions will not be double counted when calculating total shares and total value | 3,234,371 | 2.49 | 191,475 | 10.98 | ||||
| 2025-07-16 | 13F | ORG Partners LLC | 802 | 47 | ||||||
| 2025-08-01 | 13F | Y-Intercept (Hong Kong) Ltd | 3,578 | -74.19 | 212 | -72.13 | ||||
| 2025-08-05 | 13F | Advisors Preferred, LLC | 2,908 | 172 | ||||||
| 2025-08-12 | 13F | Vestor Capital, Llc | 4,988 | 0 | ||||||
| 2025-08-11 | 13F | Citigroup Inc | 5,000 | 296 | ||||||
| 2025-07-18 | 13F | GEN Financial Management, INC. | 5,429 | -0.62 | 321 | 7.72 | ||||
| 2025-07-22 | 13F | Merit Financial Group, LLC | 14,237 | 843 | ||||||
| 2025-08-07 | 13F | Proficio Capital Partners LLC | 5,748,084 | 6,696 | ||||||
| 2025-08-01 | 13F | Corrado Advisors, Llc | 38,506 | 6.04 | 2,280 | 14.81 | ||||
| 2025-07-31 | 13F | Money Design Co.,Ltd. | 505,980 | -10.34 | 30 | -3.33 | ||||
| 2025-08-08 | 13F | Pnc Financial Services Group, Inc. | 916,045 | -2.97 | 54,230 | 5.07 | ||||
| 2025-08-14 | 13F | Matrix Private Capital Group Llc | 4,577 | 0.00 | 271 | 8.00 | ||||
| 2025-08-08 | 13F | Creative Planning | 49,335 | -39.06 | 2,921 | -34.03 | ||||
| 2025-07-15 | 13F | Total Wealth Planning, Llc | 80,727 | -2.01 | 4,779 | 6.11 | ||||
| 2025-08-25 | 13F/A | Neuberger Berman Group LLC | 6,009 | 2.67 | 356 | 11.29 | ||||
| 2025-05-05 | 13F | Eagle Bay Advisors LLC | 0 | -100.00 | 0 | |||||
| 2025-08-07 | 13F | Cypress Capital Management LLC (WY) | 198 | 0.00 | 12 | 10.00 | ||||
| 2025-07-28 | 13F | BRYN MAWR TRUST Co | 37,772 | 2,236 | ||||||
| 2025-08-14 | 13F | Nepc Llc | 787,542 | 10.95 | 46,622 | 20.14 | ||||
| 2025-07-11 | 13F | First PREMIER Bank | 1,400 | 0.00 | 0 | |||||
| 2025-08-08 | 13F/A | Ignite Planners, LLC | 4,821 | 285 | ||||||
| 2025-07-29 | 13F | Signature Estate & Investment Advisors Llc | 12,646 | 1.78 | 749 | 10.16 | ||||
| 2025-08-14 | 13F | Barometer Capital Management Inc. | 0 | -100.00 | 0 | |||||
| 2025-07-16 | 13F | TOWER TRUST & INVESTMENT Co | 2,540 | 2.25 | 150 | 7.14 | ||||
| 2025-08-13 | 13F | Scotia Capital Inc. | 3,641 | -51.83 | 216 | -47.82 | ||||
| 2025-08-12 | 13F | Laurel Wealth Advisors LLC | 2,128 | 5,811.11 | 0 | -100.00 | ||||
| 2025-08-12 | 13F | New Republic Capital, LLC | 31 | 0.00 | 2 | 0.00 | ||||
| 2025-08-14 | 13F | Harris Associates L P | 0 | -100.00 | 0 | |||||
| 2025-07-31 | 13F | Brighton Jones Llc | 9,941 | 3.75 | 588 | 12.43 | ||||
| 2025-08-12 | 13F | Financial Advocates Investment Management | 114,399 | 64.91 | 6,772 | 78.59 | ||||
| 2025-08-08 | 13F | Gts Securities Llc | 18,592 | 1,101 | ||||||
| 2025-08-14 | 13F | Warren Averett Asset Management, LLC | 11,386 | -0.58 | 674 | 7.67 | ||||
| 2025-08-12 | 13F | Park Square Financial Group, LLC | 9 | 1 | ||||||
| 2025-08-14 | 13F | Ancora Advisors, LLC | 708 | 0.00 | 42 | 7.89 | ||||
| 2025-08-11 | 13F | Western Wealth Management, LLC | 4,412 | 10.72 | 261 | 20.28 | ||||
| 2025-08-12 | 13F | Employees' Retirement Fund of the City of Fort Worth | 46,200 | 0.00 | 2,526 | 0.00 | ||||
| 2025-08-14 | 13F | Smartleaf Asset Management LLC | 122 | -85.78 | 7 | -84.78 | ||||
| 2025-07-22 | 13F | Wealthcare Advisory Partners LLC | 11,224 | 42.18 | 664 | 54.06 | ||||
| 2025-08-14 | 13F | Laird Norton Trust Company, Llc | 16,517 | 19.73 | 978 | 29.58 | ||||
| 2025-08-04 | 13F | Creative Financial Designs Inc /adv | 2,624 | 1.04 | 155 | 9.93 | ||||
| 2025-07-18 | 13F | Bartlett & Co. Wealth Management Llc | 355 | 0.00 | 21 | 10.53 | ||||
| 2025-07-30 | 13F | LGT Financial Advisors LLC | 339 | 20 | ||||||
| 2025-08-13 | 13F | EverSource Wealth Advisors, LLC | 79 | -10.23 | 5 | 0.00 | ||||
| 2025-08-14 | 13F/A | Forefront Analytics, LLC | 3,905 | -42.64 | 231 | -37.90 | ||||
| 2025-04-25 | 13F | New Millennium Group LLC | 0 | -100.00 | 0 | |||||
| 2025-05-16 | 13F | Coppell Advisory Solutions LLC | 0 | -100.00 | 0 | |||||
| 2025-07-17 | 13F | Greenleaf Trust | 8,771 | -5.10 | 519 | 2.77 | ||||
| 2025-07-25 | 13F | Cwm, Llc | 366 | -64.64 | 0 | |||||
| 2025-08-04 | 13F | Haven Private, LLC | 32,771 | 1,940 | ||||||
| 2025-08-12 | 13F | DiMeo Schneider & Associates, L.L.C. | 10,396 | 34.98 | 615 | 46.08 | ||||
| 2025-08-26 | NP | LPRDX - BlackRock LifePath Dynamic 2030 Fund Investor A Shares | 121,670 | 0.00 | 7,203 | 8.28 | ||||
| 2025-07-18 | 13F | Naples Global Advisors, Llc | 160,407 | 2.86 | 9,496 | 11.39 | ||||
| 2025-05-19 | 13F | Heck Capital Advisors, LLC | 0 | 0 | ||||||
| 2025-07-29 | 13F | Private Trust Co Na | 10,324 | 0.53 | 611 | 8.91 | ||||
| 2025-07-14 | 13F | S.A. Mason LLC | 2,732 | 0.00 | 162 | 8.05 | ||||
| 2025-07-22 | 13F | Coastal Investment Advisors, Inc. | 149 | -45.82 | 9 | -46.67 | ||||
| 2025-07-23 | 13F | DMG Group, LLC | 0 | -100.00 | 0 | |||||
| 2025-08-08 | 13F | Avantax Advisory Services, Inc. | 3,405 | 202 | ||||||
| 2025-03-12 | 13F/A | Private Capital Management Llc | 0 | -100.00 | 0 | |||||
| 2025-08-04 | 13F | Creekmur Asset Management LLC | 2 | 0.00 | 0 | |||||
| 2025-08-14 | 13F | Bank Of America Corp /de/ | 918,485 | 139.96 | 54,374 | 159.85 | ||||
| 2025-05-02 | 13F | Kingsview Wealth Management, LLC | 0 | -100.00 | 0 | |||||
| 2025-08-13 | 13F | GeoWealth Management, LLC | 3 | 0 | ||||||
| 2025-07-29 | NP | EBI - Longview Advantage ETF | 0 | -100.00 | 0 | -100.00 | ||||
| 2025-09-04 | 13F/A | Advisor Group Holdings, Inc. | 19,343 | 9.78 | 1,145 | 18.90 | ||||
| 2025-08-14 | 13F | Moneta Group Investment Advisors Llc | 936,480 | 4.67 | 55,440 | 13.34 | ||||
| 2025-08-01 | 13F | Banco Santander, S.A. | 125,660 | 0.00 | 7,439 | 8.30 | ||||
| 2025-08-05 | 13F | EPG Wealth Management LLC | 458 | 1.78 | 27 | 12.50 | ||||
| 2025-08-07 | 13F | Resources Investment Advisors, LLC. | 10,903 | -2.15 | 645 | 5.91 | ||||
| 2025-08-05 | 13F | Dynasty Wealth Management, Llc | 43,075 | -4.59 | 2,550 | 3.32 | ||||
| 2025-05-15 | 13F | Glenmede Trust Co Na | 2,819 | 0.00 | 154 | 4.76 | ||||
| 2025-08-18 | 13F/A | National Bank Of Canada /fi/ | 1,450 | 56.76 | 86 | 70.00 | ||||
| 2025-08-13 | 13F | Nicolet Bankshares Inc | 7,729 | 40.94 | 458 | 52.84 | ||||
| 2025-08-06 | 13F | First Horizon Advisors, Inc. | 111 | 7 | ||||||
| 2025-07-29 | NP | JLMOX - Multi-Index Lifestyle Moderate Portfolio Class 1 | 13,231 | -4.96 | 781 | 4.84 | ||||
| 2025-07-25 | NP | PRDAX - Diversified Real Asset Fund Class A | 1,490,416 | 30.58 | 87,935 | 44.08 | ||||
| 2025-07-23 | 13F | Citizens National Bank Trust Department | 75 | 0.00 | 4 | 0.00 | ||||
| 2025-07-30 | 13F | BlueChip Wealth Advisors LLC | 3,821 | 0.00 | 226 | 8.65 | ||||
| 2025-08-13 | 13F | Continuum Advisory, LLC | 0 | -100.00 | 0 | |||||
| 2025-08-14 | 13F | Goldman Sachs Group Inc | 874,939 | 92.80 | 51,796 | 108.78 | ||||
| 2025-08-07 | 13F/A | Joseph Group Capital Management | 5,246 | -1.52 | 311 | 6.53 | ||||
| 2025-08-08 | 13F | Capital Investment Advisory Services, LLC | 119 | 7 | ||||||
| 2025-08-05 | 13F | BEAM Asset Management, LLC | 0 | -100.00 | 0 | |||||
| 2025-08-14 | 13F | Aprio Wealth Management, LLC | 72,703 | 122.46 | 4,304 | 140.99 | ||||
| 2025-07-14 | 13F | AdvisorNet Financial, Inc | 51 | 3 | ||||||
| 2025-08-26 | NP | LPRAX - BlackRock LifePath Dynamic Retirement Fund Investor A Shares | 131,726 | 0.00 | 7,798 | 8.29 | ||||
| 2025-08-11 | 13F | Private Advisor Group, LLC | 31,970 | 18.47 | 1,893 | 28.27 | ||||
| 2025-08-13 | 13F | Cresset Asset Management, LLC | 5,806 | -17.96 | 344 | -11.14 | ||||
| 2025-08-13 | 13F | Russell Investments Group, Ltd. | 46 | -9.80 | 3 | 0.00 | ||||
| 2025-08-14 | 13F | UBS Group AG | 517,504 | 30.94 | 30,636 | 41.79 | ||||
| 2025-08-14 | 13F | CoreCap Advisors, LLC | 2,209 | 49.46 | 131 | 62.50 | ||||
| 2025-07-17 | 13F | Capital Insight Partners, Llc | 77,023 | -7.25 | 4,560 | 0.42 | ||||
| 2025-08-12 | 13F | Running Point Capital Advisors, LLC | 0 | -100.00 | 0 | |||||
| 2025-07-23 | 13F | Maryland State Retirement & Pension System | 86,906 | -13.46 | 5,145 | -6.30 | ||||
| 2025-08-01 | 13F | Bank of Jackson Hole Trust | 2,853 | 0.00 | 169 | 10.53 | ||||
| 2025-08-12 | 13F | EFG Asset Management (Americas) Corp. | 75,720 | -2.51 | 4,483 | 5.56 | ||||
| 2025-07-30 | 13F | Strategic Investment Management, Llc | 0 | -100.00 | 0 | |||||
| 2025-06-23 | NP | ITDE - iShares LifePath Target Date 2045 ETF | 1,965 | 50.00 | 111 | 59.42 | ||||
| 2025-07-29 | NP | JIIOX - Multi-Index Lifestyle Aggressive Portfolio Class 1 | 40,880 | -8.00 | 2,412 | 1.52 | ||||
| 2025-07-31 | 13F | Auour Investments LLC | 3,533 | -5.84 | 209 | -0.95 | ||||
| 2025-08-12 | 13F | Global Retirement Partners, LLC | 30,866 | 13,803.60 | 1,827 | 16,509.09 | ||||
| 2025-04-30 | 13F | Brown Advisory Inc | 0 | -100.00 | 0 | |||||
| 2025-08-13 | 13F | Natixis Advisors, L.p. | 73,732 | -15.80 | 4 | 0.00 | ||||
| 2025-08-12 | 13F | Marshall & Sterling Wealth Advisors Inc. | 427 | 81.70 | 25 | 108.33 | ||||
| 2025-08-14 | 13F | Susquehanna International Group, Llp | 139,515 | 3,628.35 | 8,259 | 3,948.53 | ||||
| 2025-08-06 | 13F | Stonebridge Financial Planning Group, LLC | 10,698 | 633 | ||||||
| 2025-08-13 | 13F | Greenwich Wealth Management LLC | 8,054 | 0.00 | 0 | |||||
| 2025-08-13 | 13F | Twin Peaks Wealth Advisors, LLC | 365 | 22 | ||||||
| 2025-05-01 | 13F | Marks Group Wealth Management, Inc | 0 | -100.00 | 0 | |||||
| 2025-07-11 | 13F | Bell Bank | 7,000 | 0.00 | 414 | 8.38 | ||||
| 2025-08-06 | 13F | Vestmark Advisory Solutions, Inc. | 171,088 | 10,128 | ||||||
| 2025-07-30 | 13F | Whittier Trust Co Of Nevada Inc | 1,200 | 0.00 | 71 | 9.23 | ||||
| 2025-08-04 | 13F | Assetmark, Inc | 1,408,974 | 1,677,250.00 | 83,411 | 2,085,175.00 | ||||
| 2025-07-08 | 13F | Boltwood Capital Management | 12,910 | 12.65 | 764 | 22.04 | ||||
| 2025-04-29 | 13F | U.S. Capital Wealth Advisors, LLC | 0 | -100.00 | 0 | |||||
| 2025-08-07 | 13F | Brio Consultants, LLC | 23,051 | -1.50 | 1,365 | 6.65 | ||||
| 2025-08-14 | 13F | Boston Private Wealth Llc | 27,425 | 1,624 | ||||||
| 2025-08-26 | NP | BlackRock Funds III - BLACKROCK LIFEPATH INDEX 2040 FUND Investor A This fund is a listed as child fund of BlackRock, Inc. and if that institution has disclosed ownership in this security, then these positions will not be double counted when calculating total shares and total value | 4,638,424 | -3.07 | 274,595 | 4.96 | ||||
| 2025-07-30 | 13F | Eqis Capital Management, Inc. | 8,505 | 3.68 | 503 | 12.28 | ||||
| 2025-08-12 | 13F | Deutsche Bank Ag\ | 1,680 | 0.00 | 99 | 8.79 | ||||
| 2025-08-06 | 13F | Golden State Wealth Management, LLC | 58 | 0.00 | 3 | 0.00 | ||||
| 2025-08-15 | 13F | Captrust Financial Advisors | 890,705 | -19.65 | 52,729 | -13.00 | ||||
| 2025-07-21 | 13F | Ascent Group, LLC | 10,561 | 625 | ||||||
| 2025-07-21 | 13F | Quent Capital, LLC | 0 | -100.00 | 0 | |||||
| 2025-08-14 | 13F | Operose Advisors LLC | 11,300 | 0.00 | 669 | 8.27 | ||||
| 2025-07-25 | 13F | Envestnet Portfolio Solutions, Inc. | 22,190 | 444.41 | 1,314 | 491.44 | ||||
| 2025-07-31 | 13F | Cambridge Investment Research Advisors, Inc. | 53,992 | 95.72 | 3 | 200.00 | ||||
| 2025-07-21 | 13F | Ameriflex Group, Inc. | 0 | -100.00 | 0 | |||||
| 2025-08-13 | 13F | Meketa Investment Group Inc /adv | 4,311 | -20.99 | 255 | -14.43 | ||||
| 2025-07-11 | 13F/A | Umb Bank N A/mo | 1,225 | 73 | ||||||
| 2025-07-24 | 13F | Capital Advisors, Ltd. LLC | 21,384 | 0.24 | 1 | 0.00 | ||||
| 2025-07-25 | 13F | Sequoia Financial Advisors, LLC | 5,247 | 311 | ||||||
| 2025-08-12 | 13F | Bokf, Na | 0 | -100.00 | 0 | |||||
| 2025-07-25 | 13F | GFS Advisors, LLC | 4,200 | 0.00 | 249 | 8.26 | ||||
| 2025-05-15 | 13F | Cubist Systematic Strategies, LLC | 0 | -100.00 | 0 | |||||
| 2025-08-14 | 13F | Stifel Financial Corp | 33,692 | 18.25 | 1,995 | 28.07 | ||||
| 2025-07-21 | 13F | Barrett & Company, Inc. | 381 | 1.87 | 23 | 10.00 | ||||
| 2025-07-29 | NP | JLGOX - Multi-Index Lifestyle Growth Portfolio Class 1 | 69,632 | -8.76 | 4,108 | 0.69 | ||||
| 2025-07-16 | 13F | American National Bank | 1,430 | 85 | ||||||
| 2025-08-26 | NP | LPJRX - BlackRock LifePath Dynamic 2035 Fund Class R Shares | 110,186 | 11.16 | 6,523 | 20.39 | ||||
| 2025-07-07 | 13F | Fox Hill Wealth Management | 14,947 | 1.08 | 885 | 9.41 | ||||
| 2025-07-08 | 13F/A | Salem Investment Counselors Inc | 300 | 0.00 | 18 | 6.25 | ||||
| 2025-08-11 | 13F | Advisor Resource Council | 0 | -100.00 | 0 | |||||
| 2025-07-29 | NP | JRTBX - Multi-Index 2025 Lifetime Portfolio Class 1 | 68,309 | -5.82 | 4,030 | 3.92 | ||||
| 2025-08-14 | 13F | Logan Stone Capital, LLC | 81,907 | 62.61 | 4,849 | 76.10 | ||||
| 2025-05-13 | 13F | Aptus Capital Advisors, LLC | 0 | -100.00 | 0 | |||||
| 2025-07-15 | 13F | EWG Elevate Inc. | 16,279 | 964 | ||||||
| 2025-07-31 | 13F | Hanlon Investment Management, Inc. | 8,504 | 503 | ||||||
| 2025-08-05 | 13F | Huntington National Bank | 561 | 8.32 | ||||||
| 2025-08-14 | 13F | Mercer Global Advisors Inc /adv | 47,148 | 45.06 | 2,791 | 57.15 | ||||
| 2025-07-15 | 13F | Droms Strauss Advisors Inc /mo/ /adv | 48,960 | 3.86 | 2,898 | 12.46 | ||||
| 2025-08-13 | 13F | Alerus Financial Na | 28 | 2 | ||||||
| 2025-08-14 | 13F | Manufacturers Life Insurance Company, The | 1,585,267 | 35.07 | 93,848 | 46.26 | ||||
| 2025-08-05 | 13F | Bank Of Montreal /can/ | 61,831 | -22.69 | 3,660 | -16.29 | ||||
| 2025-08-14 | 13F | Royal Bank Of Canada | 187,683 | 41.58 | 11,111 | 53.32 | ||||
| 2025-08-05 | 13F | American Institute for Advanced Investment Management, LLP | 8,540 | 506 | ||||||
| 2025-08-11 | 13F | Dorsey & Whitney Trust CO LLC | 0 | -100.00 | 0 | |||||
| 2025-08-12 | 13F | OneAscent Financial Services LLC | 18,215 | -28.11 | 1 | 0.00 | ||||
| 2025-08-14 | 13F | Evergreen Capital Management Llc | 4,829 | 286 | ||||||
| 2025-08-08 | 13F | SBI Securities Co., Ltd. | 2,103 | 98.96 | 124 | 117.54 | ||||
| 2025-05-09 | 13F | Headlands Technologies LLC | 0 | -100.00 | 0 | |||||
| 2025-07-14 | 13F | Abound Wealth Management | 1,633 | 0.00 | 97 | 7.87 | ||||
| 2025-07-24 | 13F | Us Bancorp \de\ | 1,789,138 | 0.79 | 105,917 | 9.14 | ||||
| 2025-08-11 | 13F | Annis Gardner Whiting Capital Advisors, LLC | 217 | 0.00 | 13 | 9.09 | ||||
| 2025-08-14 | 13F | Chicago Wealth Management, Inc. | 179,820 | 10,645 | ||||||
| 2025-08-14 | 13F | Atomi Financial Group, Inc. | 7,779 | 2.63 | 460 | 11.11 | ||||
| 2025-08-12 | 13F | Rock Creek Group, LP | 23,351 | 1,382 | ||||||
| 2025-07-22 | 13F | Sage Financial Group Inc | 107,745 | -6.88 | 6,379 | 0.84 | ||||
| 2025-08-07 | 13F | Verus Capital Partners, Llc | 3,871 | -0.08 | 229 | 8.53 | ||||
| 2025-08-01 | 13F | Financial Counselors Inc | 0 | -100.00 | 0 | |||||
| 2025-07-28 | 13F | Harbour Investments, Inc. | 1,963 | -11.46 | 116 | -4.13 | ||||
| 2025-08-08 | 13F | Commonwealth Of Pennsylvania Public School Empls Retrmt Sys | 220,020 | 0.00 | 13,025 | 8.29 | ||||
| 2025-08-11 | 13F | Beta Wealth Group, Inc. | 74,415 | 4,405 | ||||||
| 2025-08-11 | 13F | Birchbrook, Inc. | 2 | 0.00 | 0 | |||||
| 2025-08-14 | 13F | Mariner, LLC | 1,509,575 | 5.01 | 89,366 | 13.72 | ||||
| 2025-08-08 | 13F | VERITY Wealth Advisors | 9,069 | 0.00 | 537 | 8.28 | ||||
| 2025-07-09 | 13F | Baron Wealth Management LLC | 7,219 | 1.35 | 427 | 9.77 | ||||
| 2025-07-16 | 13F | Tassel Capital Management, Inc. | 3,970 | -28.89 | 235 | -22.95 | ||||
| 2025-08-01 | 13F | Oarsman Capital, Inc. | 9,062 | 9.29 | 536 | 18.32 | ||||
| 2025-08-14 | 13F | Newport Capital Group, LLC | 9,184 | -1.27 | 544 | 6.89 | ||||
| 2025-07-25 | 13F | Verdence Capital Advisors LLC | 5,167 | 0.37 | 306 | 8.54 | ||||
| 2025-07-24 | 13F | Trust Co Of Toledo Na /oh/ | 138 | 8 | ||||||
| 2025-08-11 | 13F | Hexagon Capital Partners LLC | 0 | -100.00 | 0 | |||||
| 2025-08-14 | 13F | Hancock Whitney Corp | 169,226 | -6.96 | 10,018 | 0.74 | ||||
| 2025-07-25 | 13F | Hemington Wealth Management | 220 | 0 | ||||||
| 2025-08-01 | 13F | Envestnet Asset Management Inc | 881,204 | 58.56 | 52,162 | 71.68 | ||||
| 2025-08-12 | 13F | Barings Llc | 32,327 | 1,914 | ||||||
| 2025-05-01 | 13F | Schechter Investment Advisors, LLC | 59,320 | 0.62 | 3,243 | 5.26 | ||||
| 2025-05-06 | 13F | Financial & Tax Architects, LLC | 0 | -100.00 | 0 | |||||
| 2025-04-29 | 13F | Lee Danner & Bass Inc | 0 | -100.00 | 0 | |||||
| 2025-08-19 | 13F/A | Pitcairn Co | 8,167 | 0.00 | 483 | 8.30 | ||||
| 2025-08-12 | 13F | MAI Capital Management | 562,147 | 10.93 | 33,279 | 20.12 | ||||
| 2025-08-12 | 13F | O'shaughnessy Asset Management, Llc | 2,332 | 197.83 | 138 | 228.57 | ||||
| 2025-08-12 | 13F | Archer Investment Corp | 91 | 0.00 | 5 | 25.00 | ||||
| 2025-04-28 | NP | MPAY - Akros Monthly Payout ETF | 3,003 | 1.45 | 161 | -2.44 | ||||
| 2025-07-21 | 13F | Mirae Asset Global Investments Co., Ltd. | 38,029 | -8.37 | 2,251 | 225,000.00 | ||||
| 2025-08-13 | 13F | Lido Advisors, LLC | 23,023 | 20.11 | 1,363 | 30.18 | ||||
| 2025-08-12 | 13F | Founders Financial Alliance, LLC | 150 | 29.31 | 9 | 33.33 | ||||
| 2025-08-12 | 13F | Franklin Resources Inc | 1,124 | -1.14 | 67 | 6.45 | ||||
| 2025-08-14 | 13F | Ameriprise Financial Inc | 205,874 | 52.17 | 12,187 | 64.76 | ||||
| 2025-07-29 | NP | JRLQX - Multi-Index 2045 Lifetime Portfolio Class 1 | 13,909 | -4.56 | 821 | 5.26 | ||||
| 2025-07-22 | 13F | Valley National Advisers Inc | 165 | 0.00 | 0 | |||||
| 2025-08-13 | 13F | Cerity Partners LLC | 28,043 | 35.62 | 1,660 | 46.90 | ||||
| 2025-07-17 | 13F | HB Wealth Management, LLC | 10,255 | -6.06 | 607 | 1.85 | ||||
| 2025-08-26 | NP | LPHAX - BlackRock LifePath Dynamic 2045 Fund Investor A Shares | 14,404 | 0.00 | 853 | 8.26 | ||||
| 2025-08-11 | 13F | Tidemark, LLC | 0 | -100.00 | 0 | |||||
| 2025-08-12 | 13F | Pathstone Holdings, LLC | 3,505,710 | 5.43 | 207,538 | 14.22 | ||||
| 2025-08-07 | 13F | Summit X, LLC | 3,381 | 200 | ||||||
| 2025-08-06 | 13F | AE Wealth Management LLC | 299 | 110.56 | 18 | 142.86 | ||||
| 2025-07-29 | NP | JRTTX - Multi-Index 2040 Lifetime Portfolio Class 1 | 32,797 | -4.87 | 1,935 | 4.99 | ||||
| 2025-08-11 | 13F | Wealthspire Advisors, LLC | 439,424 | -0.14 | 26,014 | 8.14 | ||||
| 2025-08-14 | 13F | Colony Group, LLC | 142,651 | 1.04 | 8,445 | 9.41 | ||||
| 2025-07-24 | 13F | IFP Advisors, Inc | 1,916 | 155.47 | 113 | 175.61 | ||||
| 2025-08-13 | 13F | M&t Bank Corp | 13,756 | -1.23 | 814 | 6.96 | ||||
| 2025-07-29 | NP | JIBOX - Multi-Index Lifestyle Balanced Portfolio Class 1 | 51,866 | -9.05 | 3,060 | 0.36 | ||||
| 2025-08-14 | 13F | Wells Fargo & Company/mn | 495,696 | 189.95 | 29,345 | 213.98 | ||||
| 2025-07-21 | 13F | DHJJ Financial Advisors, Ltd. | 1,342 | 79 | ||||||
| 2025-07-24 | 13F | Coordinated Financial Services, Inc. | 4,756 | 282 | ||||||
| 2025-07-11 | 13F | Farther Finance Advisors, LLC | 1,246 | 74 | ||||||
| 2025-08-14 | 13F | Federation des caisses Desjardins du Quebec | 8,686 | -0.05 | 514 | 8.21 | ||||
| 2025-08-15 | 13F/A | Symphony Financial, Ltd. Co. | 116,055 | 750.59 | 7,341 | 885.37 | ||||
| 2025-08-08 | NP | QALTX - Quantified Alternative Investment Fund Investor Class Shares | 2,908 | -53.58 | 172 | -49.56 | ||||
| 2025-04-15 | 13F | Collier Financial | 141 | 8 | ||||||
| 2025-08-07 | 13F | Argent Advisors, Inc. | 5,150 | 0.00 | 305 | 8.19 | ||||
| 2025-05-02 | 13F | Apollon Wealth Management, LLC | 0 | -100.00 | 0 | |||||
| 2025-07-16 | 13F | Perigon Wealth Management, LLC | 40,418 | 1.04 | 2,393 | 9.42 | ||||
| 2025-08-05 | 13F | Tsfg, Llc | 2,008 | 0.05 | 0 | |||||
| 2025-08-04 | 13F | Simon Quick Advisors, Llc | 10,593 | 627 | ||||||
| 2025-05-15 | 13F | Macquarie Group Ltd | 0 | -100.00 | 0 | |||||
| 2025-08-01 | 13F | Chilton Capital Management Llc | 475 | 28 | ||||||
| 2025-07-16 | 13F | Spinnaker Investment Group, LLC | 3,882 | 0.00 | 230 | 8.02 | ||||
| 2025-08-15 | 13F | Fft Wealth Management Llc | 4,313 | 260 | ||||||
| 2025-07-01 | 13F | Harbor Investment Advisory, Llc | 7,334 | 32.98 | 434 | 44.19 | ||||
| 2025-08-12 | 13F | CIBC Private Wealth Group, LLC | 147,345 | 28.56 | 8,723 | 50.56 | ||||
| 2025-08-04 | 13F | Atria Investments Llc | 49,240 | 756.05 | 2,915 | 828.03 | ||||
| 2025-08-11 | 13F | Principal Securities, Inc. | 147,965 | 2.52 | 8,760 | 16.11 | ||||
| 2025-07-29 | NP | JRLOX - Multi-Index 2020 Lifetime Portfolio Class 1 | 29,474 | -8.17 | 1,739 | 1.28 | ||||
| 2025-08-13 | 13F | Jones Financial Companies Lllp | 6,125 | 30.13 | 359 | 40.23 | ||||
| 2025-08-13 | 13F | Mount Yale Investment Advisors, LLC | 98 | 6 | ||||||
| 2025-07-29 | NP | JRLDX - Multi-Index 2010 Lifetime Portfolio Class 1 | 6,440 | -14.84 | 380 | -6.19 | ||||
| 2025-08-26 | NP | BlackRock Funds III - BLACKROCK LIFEPATH INDEX 2045 FUND Investor A This fund is a listed as child fund of BlackRock, Inc. and if that institution has disclosed ownership in this security, then these positions will not be double counted when calculating total shares and total value | 612,500 | 24.01 | 36,260 | 34.29 | ||||
| 2025-08-07 | 13F | Hennion & Walsh Asset Management, Inc. | 4,530 | 0.00 | 268 | 8.50 | ||||
| 2025-08-14 | 13F | Kovitz Investment Group Partners, LLC | 211,133 | 30.91 | 12,499 | 41.76 | ||||
| 2025-08-26 | NP | BlackRock Funds III - BLACKROCK LIFEPATH INDEX 2030 FUND Investor A This fund is a listed as child fund of BlackRock, Inc. and if that institution has disclosed ownership in this security, then these positions will not be double counted when calculating total shares and total value | 3,329,495 | 0.28 | 197,106 | 8.59 | ||||
| 2025-07-15 | 13F | West Oak Capital, LLC | 25 | 0.00 | 0 | |||||
| 2025-07-16 | 13F | Highline Wealth Partners Llc | 1,806 | -7.95 | 107 | -0.93 | ||||
| 2025-04-21 | 13F | PSI Advisors, LLC | 0 | -100.00 | 0 | |||||
| 2025-08-06 | 13F | Quadrant Private Wealth Management, LLC | 4,602 | 272 | ||||||
| 2025-07-22 | 13F | Belpointe Asset Management LLC | 20,609 | 1,220 | ||||||
| 2025-08-01 | 13F | Motco | 9,276 | 16.72 | 548 | 26.27 | ||||
| 2025-07-21 | 13F | Ameritas Advisory Services, LLC | 169 | 10 | ||||||
| 2025-08-15 | 13F | Kestra Advisory Services, LLC | 43,763 | 2,591 | ||||||
| 2025-07-15 | 13F | BigSur Wealth Management LLC | 28,550 | 0.00 | 1,690 | 8.33 | ||||
| 2025-07-18 | 13F | Centricity Wealth Management, LLC | 640 | 0.00 | 38 | 8.82 | ||||
| 2025-08-12 | 13F | Wayfinding Financial, LLC | 0 | -100.00 | 0 | |||||
| 2025-08-12 | 13F | Richmond Investment Services, LLC | 3,488 | 206 | ||||||
| 2025-07-29 | 13F | Angeles Wealth Management, Llc | 5,781 | 342 | ||||||
| 2025-08-04 | 13F | Spire Wealth Management | 2,701 | -5.69 | 160 | 1.92 | ||||
| 2025-08-15 | 13F | Morgan Stanley | 1,184,015 | 45.49 | 70,094 | 57.54 | ||||
| 2025-06-27 | NP | GMOM - Cambria Global Momentum ETF | 111,126 | 6,266 | ||||||
| 2025-08-14 | 13F | Sunbelt Securities, Inc. | 88 | 0.00 | 5 | 0.00 | ||||
| 2025-07-25 | 13F | Wealth Architects, LLC | 39,896 | -1.56 | 2,362 | 6.59 | ||||
| 2025-08-13 | 13F | Mackenzie Financial Corp | 73,537 | 2.81 | 4,353 | 11.33 | ||||
| 2025-04-30 | 13F | Arcadia Investment Management Corp/mi | 0 | -100.00 | 0 | |||||
| 2025-08-15 | 13F | Equitable Holdings, Inc. | 87,792 | 8.98 | 5,197 | 18.03 | ||||
| 2025-07-29 | NP | JRLKX - Multi-Index 2015 Lifetime Portfolio Class R4 | 8,666 | -12.24 | 511 | -3.22 | ||||
| 2025-07-15 | 13F | Kwmg, Llc | 6,986 | -16.48 | 414 | -9.63 | ||||
| 2025-08-12 | 13F | Jpmorgan Chase & Co | 324,492 | -8.33 | 19,210 | -0.73 | ||||
| 2025-07-31 | 13F | Hoge Financial Services, Llc | 45,298 | -19.40 | 2,682 | -12.73 | ||||
| 2025-08-05 | 13F | Plante Moran Financial Advisors, LLC | 90 | 5 | ||||||
| 2025-08-13 | 13F | IAG Wealth Partners, LLC | 7 | 0 | ||||||
| 2025-07-24 | 13F | Louisbourg Investments Inc. | 16,677 | 6.51 | 987 | 15.44 | ||||
| 2025-06-23 | NP | ITDD - iShares LifePath Target Date 2040 ETF | 10,677 | 17.43 | 602 | 24.64 | ||||
| 2025-08-11 | 13F | Great Lakes Advisors, Llc | 175,565 | 0.37 | 10,393 | 8.69 | ||||
| 2025-08-08 | 13F | Bailard, Inc. | 45,955 | 0.00 | 2,721 | 8.28 | ||||
| 2025-07-31 | 13F | Arrien Investments, Inc. | 82,650 | 2.65 | 4,893 | 11.16 | ||||
| 2025-07-29 | 13F | Morgan Dempsey Capital Management Llc | 1,101 | 150.80 | 65 | 182.61 | ||||
| 2025-08-05 | 13F | Ellevest, Inc. | 0 | -100.00 | 0 | |||||
| 2025-08-29 | 13F | Total Investment Management Inc | 110 | 7 | ||||||
| 2025-08-11 | 13F | Strategic Wealth Partners, Ltd. | 0 | 0 | ||||||
| 2025-08-12 | 13F | AlphaCore Capital LLC | 250 | 0.00 | 15 | 7.69 | ||||
| 2025-07-31 | 13F | FSM Wealth Advisors, LLC | 175,444 | 9.83 | 10,279 | 17.70 | ||||
| 2025-08-05 | 13F | Bank of New York Mellon Corp | 274,342 | -7.52 | 16,241 | 0.14 | ||||
| 2025-08-13 | 13F | Renaissance Technologies Llc | 64,900 | 3,842 | ||||||
| 2025-08-07 | 13F | Parkside Financial Bank & Trust | 3,005 | 178 | ||||||
| 2025-07-18 | 13F | Institute for Wealth Management, LLC. | 4,530 | -0.55 | 268 | 7.63 | ||||
| 2025-06-27 | NP | SUNAMERICA SERIES TRUST - SA Goldman Sachs Multi-Asset Insights Portfolio Class 1 | 9,503 | -35.63 | 536 | -31.85 | ||||
| 2025-08-18 | 13F | N.E.W. Advisory Services LLC | 59 | 0.00 | 3 | 0.00 | ||||
| 2025-08-14 | 13F | CIBC World Markets Inc. | 7,758 | -1.39 | 459 | 6.74 | ||||
| 2025-08-14 | 13F | Glenmede Investment Management, LP | 2,819 | 167 | ||||||
| 2025-08-14 | 13F | Visionary Wealth Advisors | 66,214 | 3,920 | ||||||
| 2025-07-28 | 13F | Kiker Wealth Management, LLC | 30 | 0.00 | 2 | 0.00 | ||||
| 2025-08-14 | 13F | Qube Research & Technologies Ltd | 122,857 | 264.65 | 7,273 | 295.06 | ||||
| 2025-08-14 | 13F | Jane Street Group, Llc | 106,201 | 6,287 | ||||||
| 2025-07-25 | 13F | We Are One Seven, LLC | 17,920 | 25.43 | 1,061 | 35.72 | ||||
| 2025-08-13 | 13F | Crescent Grove Advisors, LLC | 12,200 | 0.00 | 722 | 8.41 | ||||
| 2025-07-14 | 13F | Park Avenue Securities Llc | 12,485 | 84.44 | 1 | |||||
| 2025-08-12 | 13F | Country Trust Bank | 344,136 | -0.30 | 20,373 | 7.96 | ||||
| 2025-07-24 | 13F | Costello Asset Management, INC | 398 | 1.53 | 24 | 9.52 | ||||
| 2025-08-28 | NP | Principal Diversified Select Real Asset Fund | 121,100 | 7,169 | ||||||
| 2025-07-15 | 13F | Ballentine Partners, LLC | 2,299,155 | 695.22 | 136,110 | 761.12 | ||||
| 2025-08-15 | 13F | Northeast Financial Consultants Inc | 12,355 | 0.00 | 731 | 8.30 | ||||
| 2025-07-24 | 13F | Comprehensive Money Management Services LLC | 10,219 | -2.62 | 605 | 5.41 | ||||
| 2025-07-23 | 13F | Lakeshore Capital Group, Inc. | 9,542 | -6.67 | 565 | 1.08 | ||||
| 2025-07-09 | 13F | Beacon Financial Group | 11,518 | 682 | ||||||
| 2025-07-15 | 13F | Fifth Third Bancorp | 1,340,424 | -0.15 | 79,353 | 8.13 | ||||
| 2025-08-11 | 13F | Rothschild Investment Llc | 4 | 0.00 | 0 | |||||
| 2025-08-12 | 13F | Steward Partners Investment Advisory, Llc | 8,123 | -14.75 | 481 | -7.69 | ||||
| 2025-08-06 | 13F | Washington Trust Bank | 34,433 | -46.24 | 2,038 | -41.79 | ||||
| 2025-07-24 | 13F | GFG Capital, LLC | 4,060 | -5.18 | 240 | 2.56 | ||||
| 2025-07-07 | 13F | Thurston, Springer, Miller, Herd & Titak, Inc. | 1,028 | 61 | ||||||
| 2025-07-15 | 13F | Patriot Investment Management Inc. | 9,600 | 0.11 | 568 | 8.40 | ||||
| 2025-08-08 | 13F | Firestone Capital Management | 7,646 | 0.37 | 453 | 8.65 | ||||
| 2025-07-14 | 13F | Sowell Financial Services LLC | 12,617 | 0.00 | 747 | 8.27 | ||||
| 2025-07-15 | 13F | Pictet North America Advisors SA | 35,452 | 0.00 | 2,099 | 8.26 | ||||
| 2025-08-04 | 13F | IFG Advisory, LLC | 55,116 | 5.61 | 3,263 | 14.34 | ||||
| 2025-07-29 | 13F | Sincerus Advisory, LLC | 12,846 | 10.02 | 763 | 19.44 | ||||
| 2025-08-18 | 13F | Hollencrest Capital Management | 22 | 0.00 | 1 | 0.00 | ||||
| 2025-07-15 | 13F | Compagnie Lombard Odier SCmA | 6,655 | 0.00 | 394 | 8.26 | ||||
| 2025-08-13 | 13F | 1832 Asset Management L.P. | 2,090,529 | -0.30 | 123,759 | 7.97 | ||||
| 2025-07-29 | 13F | Regions Financial Corp | 109 | 0.00 | 0 | |||||
| 2025-06-23 | NP | ITDC - iShares LifePath Target Date 2035 ETF | 9,700 | 20.93 | 547 | 28.17 | ||||
| 2025-08-12 | 13F | BlackRock, Inc. | 17,624,879 | 1.19 | 1,043,393 | 9.57 | ||||
| 2025-08-13 | 13F | Oribel Capital Management, LP | Call | 0 | -100.00 | 0 | ||||
| 2025-08-14 | 13F | GWM Advisors LLC | 1,514 | 20.35 | 90 | 30.88 |