Mga Batayang Estadistika
| Pemilik Institusional | 314 total, 309 long only, 0 short only, 5 long/short - change of 8.65% MRQ |
| Alokasi Portofolio Rata-rata | 0.1556 % - change of 2.90% MRQ |
| Saham Institusional (Jangka Panjang) | 21,420,601 (ex 13D/G) - change of -0.04MM shares -0.19% MRQ |
| Nilai Institusional (Jangka Panjang) | $ 1,562,018 USD ($1000) |
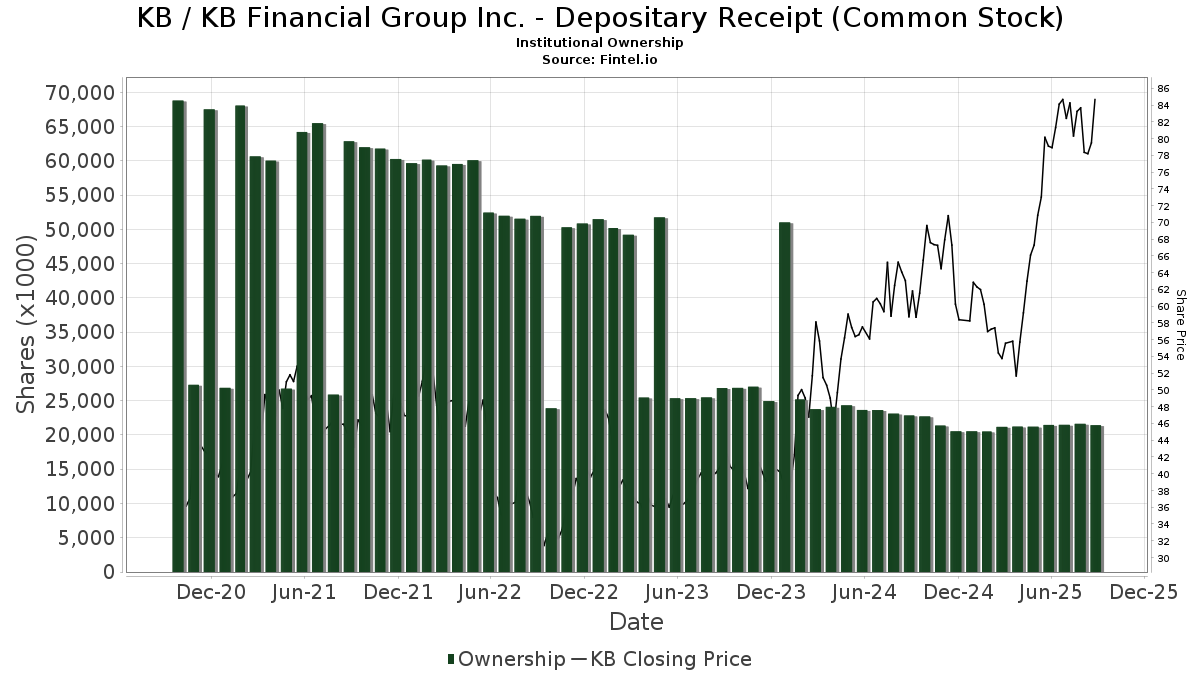
Kepemilikan Institusional dan Pemegang Saham
KB Financial Group Inc. - Depositary Receipt (Common Stock) (US:KB) memiliki 314 pemilik institusional dan pemegang saham yang telah mengajukan formulir 13D/G atau 13F kepada Komisi Bursa Efek (Securities Exchange Commission/SEC). Lembaga-lembaga ini memegang total 21,420,601 saham. Pemegang saham terbesar meliputi Dimensional Fund Advisors Lp, Dimensional Emerging Markets Value Fund - Dimensional Emerging Markets Value Fund, BlackRock, Inc., Lazard Asset Management Llc, Morgan Stanley, Arrowstreet Capital, Limited Partnership, Northern Trust Corp, Bank Of America Corp /de/, American Century Companies Inc, and Connor, Clark & Lunn Investment Management Ltd. .
Struktur kepemilikan institusional KB Financial Group Inc. - Depositary Receipt (Common Stock) (NYSE:KB) menunjukkan posisi terkini di perusahaan oleh institusi dan dana, serta perubahan terbaru dalam ukuran posisi. Pemegang saham utama dapat mencakup investor individu, reksa dana, dana lindung nilai, atau institusi. Jadwal 13D menunjukkan bahwa investor memegang (atau pernah memegang) lebih dari 5% saham perusahaan dan bermaksud (atau pernah bermaksud) untuk secara aktif mengejar perubahan strategi bisnis. Jadwal 13G menunjukkan investasi pasif lebih dari 5%.
The share price as of September 5, 2025 is 78.13 / share. Previously, on September 6, 2024, the share price was 61.61 / share. This represents an increase of 26.81% over that period.
Skor Sentimen Dana
Skor Sentimen Dana (sebelumnya dikenal sebagai Skor Akumulasi Kepemilikan) menemukan saham-saham yang paling banyak dibeli oleh dana. Ini adalah hasil dari model kuantitatif multi-faktor yang canggih yang mengidentifikasi perusahaan dengan tingkat akumulasi institusional tertinggi. Model penilaian menggunakan kombinasi dari total peningkatan pemilik yang diungkapkan, perubahan dalam alokasi portofolio pada pemilik tersebut, dan metrik lainnya. Angka berkisar dari 0 hingga 100, dengan angka yang lebih tinggi menunjukkan tingkat akumulasi yang lebih tinggi dibandingkan dengan perusahaan sejenisnya, dan 50 adalah rata-ratanya.
Frekuensi Pembaruan: Setiap Hari
Lihat Ownership Explorer, yang menyediakan daftar perusahaan dengan peringkat tertinggi.
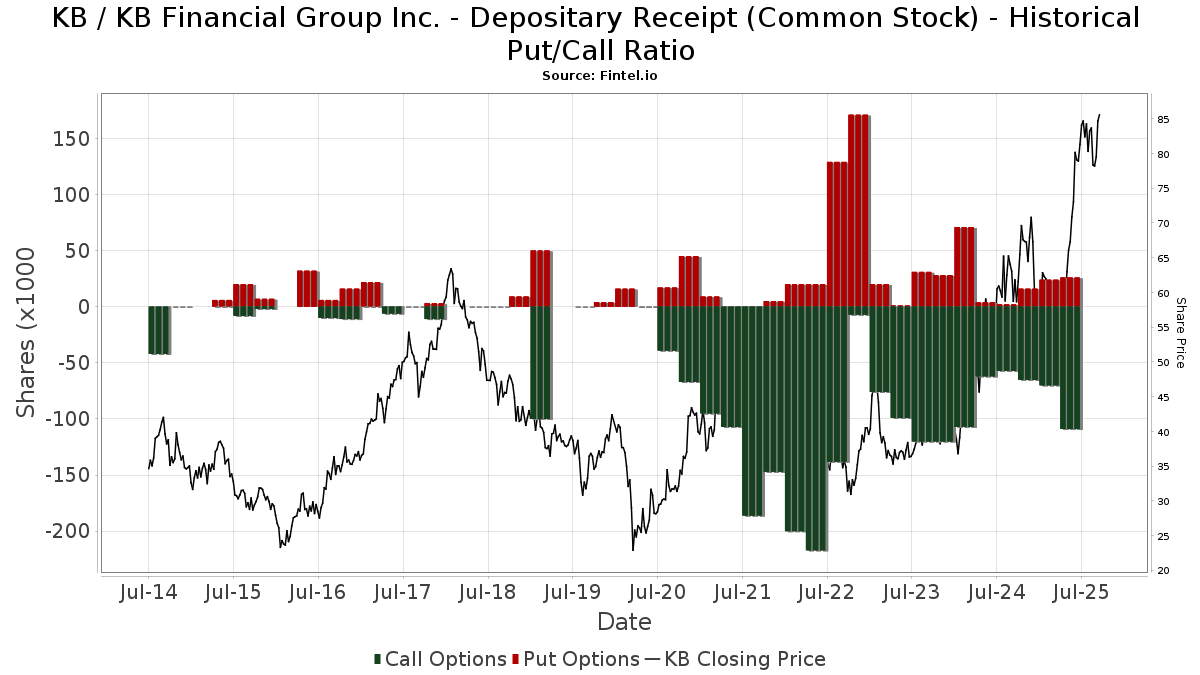
Rasio Put/Call Institusional
Selain melaporkan isu ekuitas dan utang standar, institusi dengan aset di bawah manajemen lebih dari 100 juta dolar AS juga harus mengungkapkan kepemilikan opsi put dan call mereka. Karena opsi put umumnya menunjukkan sentimen negatif, dan opsi call menunjukkan sentimen positif, kita dapat mengetahui sentimen institusional secara keseluruhan dengan memplot rasio put terhadap call. Grafik di sebelah kanan memplot rasio put/call historis untuk instrumen ini.
Menggunakan Rasio Put/Call sebagai indikator sentimen investor mengatasi salah satu kekurangan utama dari penggunaan total kepemilikan institusional, yaitu sejumlah besar aset yang dikelola diinvestasikan secara pasif untuk melacak indeks. Dana yang dikelola secara pasif biasanya tidak membeli opsi, sehingga indikator rasio put/call lebih akurat dalam melacak sentimen dana yang dikelola secara aktif.
Pengajuan 13F dan NPORT
Detail pada pengajuan 13F tersedia gratis. Detail pada pengajuan NP memerlukan keanggotaan premium. Baris berwarna hijau menunjukkan posisi baru. Baris berwarna merah menunjukkan posisi yang sudah ditutup. Klik tautan ini ikon untuk melihat riwayat transaksi selengkapnya.
Tingkatkan
untuk membuka data premium dan mengekspor ke Excel ![]() .
.
| Tanggal File | Sumber | Investor | Ketik | Presyo ng Avg (Silangan) |
Saham | Δ Saham (%) |
Dilaporkan Nilai ($1000) |
Nilai Δ (%) |
Alokasi Port (%) |
|
|---|---|---|---|---|---|---|---|---|---|---|
| 2025-07-14 | 13F | GAMMA Investing LLC | 1,836 | 105.60 | 152 | 214.58 | ||||
| 2025-06-26 | NP | BLACKROCK FUNDS - BlackRock Advantage Emerging Markets Fund Investor A Shares | 226 | -86.18 | 14 | -86.27 | ||||
| 2025-08-14 | 13F | Verition Fund Management LLC | 0 | -100.00 | 0 | |||||
| 2025-08-11 | 13F | NewEdge Wealth, LLC | 67,699 | 1.33 | 5,594 | 54.72 | ||||
| 2025-07-08 | 13F | Rise Advisors, LLC | 6 | 100.00 | 0 | |||||
| 2025-08-14 | 13F | Aquatic Capital Management LLC | 7,128 | -61.70 | 589 | -41.55 | ||||
| 2025-08-08 | 13F | SG Americas Securities, LLC | 6,359 | -83.23 | 1 | -100.00 | ||||
| 2025-04-21 | 13F | CWA Asset Management Group, LLC | 0 | -100.00 | 0 | -100.00 | ||||
| 2025-08-06 | 13F | Vestmark Advisory Solutions, Inc. | 0 | -100.00 | 0 | |||||
| 2025-08-12 | 13F | Dimensional Fund Advisors Lp | 2,620,620 | 5.05 | 216,418 | 60.37 | ||||
| 2025-08-13 | 13F | Capital International Investors | 671,937 | 22.44 | 55,260 | 86.95 | ||||
| 2025-07-28 | NP | AVEM - Avantis Emerging Markets Equity ETF This fund is a listed as child fund of American Century Companies Inc and if that institution has disclosed ownership in this security, then these positions will not be double counted when calculating total shares and total value | 617,724 | 21.45 | 46,175 | 67.13 | ||||
| 2025-08-11 | 13F | B. Metzler seel. Sohn & Co. AG | 77,332 | -10.49 | 6,387 | 36.63 | ||||
| 2025-07-30 | 13F | Cullen/frost Bankers, Inc. | 418 | 0.00 | 35 | 54.55 | ||||
| 2025-08-14 | 13F | Aspen Grove Capital, LLC | 6,061 | 0.55 | 501 | 52.44 | ||||
| 2025-05-05 | 13F | Lindbrook Capital, Llc | 5,002 | 0.91 | 271 | -4.26 | ||||
| 2025-08-13 | 13F | Groupama Asset Managment | 19,478 | 1.88 | 1,588 | 55.59 | ||||
| 2025-05-15 | 13F | Talon Private Wealth, LLC | 0 | -100.00 | 0 | -100.00 | ||||
| 2025-08-01 | 13F | Envestnet Asset Management Inc | 174,924 | 0.39 | 14,447 | 53.22 | ||||
| 2025-08-05 | 13F | Westside Investment Management, Inc. | 385 | 32 | ||||||
| 2025-08-13 | 13F | Mirabella Financial Services Llp | 7,346 | -97.10 | 609 | -95.58 | ||||
| 2025-08-14 | 13F | Prelude Capital Management, Llc | 0 | -100.00 | 0 | |||||
| 2025-07-29 | NP | GIMFX - GMO Implementation Fund | 8,621 | 0.00 | 644 | 37.61 | ||||
| 2025-07-30 | 13F | Whittier Trust Co | 233 | 19 | ||||||
| 2025-08-18 | 13F/A | National Bank Of Canada /fi/ | 69 | 0.00 | 6 | 66.67 | ||||
| 2025-07-18 | 13F | BSW Wealth Partners | 3,611 | 298 | ||||||
| 2025-07-30 | 13F | Whittier Trust Co Of Nevada Inc | 107 | 15.05 | 9 | 60.00 | ||||
| 2025-08-07 | 13F | Parkside Financial Bank & Trust | 336 | 585.71 | 28 | 1,250.00 | ||||
| 2025-07-29 | 13F | Calamos Wealth Management LLC | 36,409 | 3,007 | ||||||
| 2025-07-21 | 13F | Qrg Capital Management, Inc. | 15,147 | 13.08 | 1,251 | 72.65 | ||||
| 2025-07-23 | 13F | Trinity Street Asset Management LLP | 328,551 | -0.55 | 27,135 | 51.79 | ||||
| 2025-08-12 | 13F | LPL Financial LLC | 11,519 | 163.47 | 951 | 302.97 | ||||
| 2025-07-18 | 13F | Generali Investments CEE, investicni spolecnost, a.s. | 34,888 | 0.00 | 2,881 | 52.68 | ||||
| 2025-08-14 | 13F | Aqr Capital Management Llc | 14,448 | 160.18 | 1,193 | 297.67 | ||||
| 2025-05-15 | 13F | StoneX Group Inc. | 0 | -100.00 | 0 | -100.00 | ||||
| 2025-08-13 | 13F | Todd Asset Management Llc | 528,787 | -8.15 | 43,673 | 40.19 | ||||
| 2025-08-12 | 13F | Coldstream Capital Management Inc | 7,663 | 280.30 | 633 | 479.82 | ||||
| 2025-08-14 | 13F | D. E. Shaw & Co., Inc. | 0 | -100.00 | 0 | |||||
| 2025-08-14 | 13F | Banque Transatlantique SA | 0 | -100.00 | 0 | |||||
| 2025-07-15 | 13F | Fifth Third Bancorp | 8,320 | 1.24 | 687 | 54.73 | ||||
| 2025-07-25 | 13F | Sequoia Financial Advisors, LLC | 15,984 | 12.74 | 1,320 | 72.10 | ||||
| 2025-07-21 | 13F | Ascent Group, LLC | 3,261 | 269 | ||||||
| 2025-08-05 | 13F | Bridgewater Advisors Inc. | 8,059 | 0.44 | 641 | 29.29 | ||||
| 2025-07-31 | 13F | Caitong International Asset Management Co., Ltd | 14 | 1 | ||||||
| 2025-08-05 | 13F | Bank of New York Mellon Corp | 15,004 | 1.97 | 1,239 | 55.65 | ||||
| 2025-08-11 | 13F | Annis Gardner Whiting Capital Advisors, LLC | 148 | 12 | ||||||
| 2025-08-14 | 13F | Mercer Global Advisors Inc /adv | 10,750 | -4.33 | 888 | 45.89 | ||||
| 2025-08-13 | 13F | Grantham, Mayo, Van Otterloo & Co. LLC | 53,153 | -19.48 | 4,390 | 22.87 | ||||
| 2025-08-14 | 13F | Aprio Wealth Management, LLC | 9,851 | 2.43 | 814 | 56.35 | ||||
| 2025-08-15 | 13F | Tower Research Capital LLC (TRC) | 570 | -72.33 | 47 | -57.66 | ||||
| 2025-08-14 | 13F | Raymond James Financial Inc | 150,464 | 18.47 | 12,427 | 80.82 | ||||
| 2025-07-24 | 13F | Ronald Blue Trust, Inc. | 5,665 | -7.27 | 468 | 41.52 | ||||
| 2025-08-04 | 13F | Assetmark, Inc | 225 | 122.77 | 19 | 260.00 | ||||
| 2025-08-13 | 13F | Walleye Trading LLC | Put | 13,200 | 1,090 | |||||
| 2025-08-13 | 13F | Walleye Trading LLC | Call | 16,700 | 1,379 | |||||
| 2025-08-14 | 13F | Quantinno Capital Management LP | 42,301 | 60.20 | 3,494 | 144.61 | ||||
| 2025-06-23 | NP | UUPIX - Ultraemerging Markets Profund Investor Class | 1,447 | 3.73 | 91 | 4.60 | ||||
| 2025-08-05 | 13F | NewSquare Capital LLC | 154 | 113.89 | 13 | 300.00 | ||||
| 2025-08-13 | 13F | Jones Financial Companies Lllp | 174 | 0.00 | 14 | 55.56 | ||||
| 2025-07-25 | 13F | Yousif Capital Management, Llc | 38,413 | -6.74 | 3,173 | 42.37 | ||||
| 2025-08-13 | 13F | Walleye Trading LLC | 1,072 | 89 | ||||||
| 2025-07-15 | 13F | Public Employees Retirement System Of Ohio | 115,825 | -4.98 | 9,566 | 45.01 | ||||
| 2025-08-11 | 13F | Principal Securities, Inc. | 62 | 37.78 | 5 | 150.00 | ||||
| 2025-08-13 | 13F | Capital Research Global Investors | 59,551 | 18.12 | 4,854 | 80.45 | ||||
| 2025-07-16 | 13F | Perigon Wealth Management, LLC | 0 | -100.00 | 0 | |||||
| 2025-04-18 | 13F | Insigneo Advisory Services, Llc | 0 | -100.00 | 0 | -100.00 | ||||
| 2025-07-09 | 13F | Sivia Capital Partners, LLC | 4,112 | -19.04 | 340 | 23.72 | ||||
| 2025-05-15 | 13F/A | Orion Portfolio Solutions, LLC | 10,465 | -2.12 | 566 | -6.91 | ||||
| 2025-07-17 | 13F | Park Place Capital Corp | 504 | 0.00 | 42 | 51.85 | ||||
| 2025-08-01 | 13F | Financial Counselors Inc | 0 | -100.00 | 0 | |||||
| 2025-08-20 | NP | REMG - Emerging Markets Equity Active ETF | 3,325 | 275 | ||||||
| 2025-08-13 | 13F | Invesco Ltd. | 152,939 | 508.93 | 12,631 | 829.43 | ||||
| 2025-07-25 | NP | DEMAX - Delaware Emerging Markets Fund Class A | 245,928 | 0.00 | 18,383 | 37.62 | ||||
| 2025-08-13 | 13F | Schroder Investment Management Group | 64,244 | 24.30 | 5,306 | 92.42 | ||||
| 2025-06-26 | NP | DEXC - Dimensional Emerging Markets ex China Core Equity ETF | 7,590 | 21.46 | 478 | 22.56 | ||||
| 2025-07-30 | 13F | Eqis Capital Management, Inc. | 3,567 | -12.59 | 295 | 33.64 | ||||
| 2025-08-06 | 13F | First Horizon Advisors, Inc. | 303 | 25 | ||||||
| 2025-08-13 | 13F | Cresset Asset Management, LLC | 3,320 | -13.27 | 274 | 32.37 | ||||
| 2025-06-26 | NP | SNTKX - Steward International Enhanced Index Fund Class A | 8,767 | 36,429.17 | 552 | 55,100.00 | ||||
| 2025-07-24 | NP | SHP ETF Trust - FIS Knights of Columbus Global Belief ETF | 4,512 | 0.00 | 337 | 37.55 | ||||
| 2025-08-11 | 13F | United Capital Financial Advisers, Llc | 5,806 | -0.26 | 480 | 52.55 | ||||
| 2025-07-17 | 13F | Clean Yield Group | 293 | 0.00 | 24 | 60.00 | ||||
| 2025-07-28 | NP | VCGEX - Emerging Economies Fund | 5,475 | 12.63 | 409 | 54.92 | ||||
| 2025-07-31 | 13F | Glass Jacobson Investment Advisors llc | 0 | -100.00 | 0 | |||||
| 2025-07-28 | 13F | Ritholtz Wealth Management | 49,892 | -4.22 | 4,121 | 46.20 | ||||
| 2025-08-11 | 13F | Raiffeisen Bank International AG | 7,656 | -22.42 | 623 | 18.25 | ||||
| 2025-08-14 | 13F | Glenmede Investment Management, LP | 3,237 | 267 | ||||||
| 2025-08-14 | 13F | Two Sigma Investments, Lp | 93,977 | -32.98 | 7,762 | 2.29 | ||||
| 2025-08-14 | 13F | Two Sigma Advisers, Lp | 38,900 | -24.02 | 3,213 | 15.96 | ||||
| 2025-07-16 | 13F | Signaturefd, Llc | 25,794 | -1.47 | 2,130 | 50.42 | ||||
| 2025-08-14 | 13F | Evergreen Capital Management Llc | 4,390 | 363 | ||||||
| 2025-08-14 | 13F | Group One Trading, L.p. | Put | 100 | 8 | |||||
| 2025-08-14 | 13F | Group One Trading, L.p. | Call | 11,600 | 1.75 | 958 | 55.52 | |||
| 2025-08-14 | 13F | Henry James International Management Inc. | 63,108 | 0.04 | 5,212 | 52.71 | ||||
| 2025-07-16 | 13F | Banque Pictet & Cie Sa | 6,526 | 56.80 | 539 | 139.11 | ||||
| 2025-08-07 | 13F | Connor, Clark & Lunn Investment Management Ltd. | 734,981 | -12.96 | 60,702 | 32.86 | ||||
| 2025-08-12 | 13F | Atlas Capital Advisors Llc | 8,898 | 1.95 | 735 | 55.51 | ||||
| 2025-08-11 | 13F | Bell Investment Advisors, Inc | 282 | -5.69 | 23 | 43.75 | ||||
| 2025-08-27 | 13F/A | Squarepoint Ops LLC | 0 | -100.00 | 0 | -100.00 | ||||
| 2025-07-28 | NP | AVEEX - Avantis Emerging Markets Equity Fund Institutional Class This fund is a listed as child fund of American Century Companies Inc and if that institution has disclosed ownership in this security, then these positions will not be double counted when calculating total shares and total value | 25,431 | 0.00 | 1,901 | 37.58 | ||||
| 2025-08-06 | 13F | Pekin Hardy Strauss, Inc. | 3,000 | 248 | ||||||
| 2025-07-24 | 13F | Ramirez Asset Management, Inc. | 304,298 | 24.59 | 25,132 | 90.17 | ||||
| 2025-08-12 | 13F | Dynamic Technology Lab Private Ltd | 0 | -100.00 | 0 | |||||
| 2025-08-14 | 13F | GWM Advisors LLC | 12,154 | 0.75 | 1,004 | 53.83 | ||||
| 2025-08-07 | 13F | Legacy Advisors, LLC | 0 | -100.00 | 0 | |||||
| 2025-08-13 | 13F | Capital International Inc /ca/ | 36,395 | -2.56 | 3,006 | 48.69 | ||||
| 2025-06-26 | NP | DFAE - Dimensional Emerging Core Equity Market ETF | 59,962 | 36.31 | 3,776 | 37.41 | ||||
| 2025-07-23 | 13F | Canopy Partners, LLC | 6,728 | 0.28 | 556 | 52.89 | ||||
| 2025-08-13 | 13F | West Family Investments, Inc. | 11,486 | 20.66 | 949 | 84.08 | ||||
| 2025-07-16 | NP | CGDG - Capital Group Dividend Growers ETF Share Class | 302,977 | 34.56 | 22,648 | 85.18 | ||||
| 2025-08-07 | 13F | Vise Technologies, Inc. | 36,360 | 71.44 | 3,003 | 148.92 | ||||
| 2025-08-12 | 13F | Jpmorgan Chase & Co | 43,178 | -77.14 | 3,566 | -65.10 | ||||
| 2025-05-06 | 13F | Venturi Wealth Management, LLC | 0 | -100.00 | 0 | |||||
| 2025-07-31 | 13F | Buckingham Strategic Partners | 2,899 | 239 | ||||||
| 2025-06-30 | NP | VT - Vanguard Total World Stock Index Fund ETF Shares | 39,869 | 0.00 | 2,511 | 0.80 | ||||
| 2025-08-13 | 13F | Amundi | 17,820 | -76.82 | 1,499 | -62.74 | ||||
| 2025-07-14 | 13F | Abound Wealth Management | 10 | 0.00 | 1 | |||||
| 2025-08-14 | 13F | Harris Associates L P | 3,545 | 293 | ||||||
| 2025-08-07 | 13F | Acadian Asset Management Llc | 97,490 | -21.19 | 8 | 33.33 | ||||
| 2025-08-13 | 13F | Northern Trust Corp | 956,289 | -0.08 | 78,980 | 52.50 | ||||
| 2025-07-29 | NP | BPLSX - Boston Partners Long/Short Equity Fund INSTITUTIONAL | 14,036 | 15.26 | 1,049 | 58.70 | ||||
| 2025-07-17 | 13F | Beacon Capital Management, LLC | 39 | 0.00 | 3 | 50.00 | ||||
| 2025-08-15 | 13F | Morgan Stanley | 985,573 | 4.02 | 81,399 | 58.78 | ||||
| 2025-06-26 | NP | Dimensional Emerging Markets Value Fund - Dimensional Emerging Markets Value Fund This fund is a listed as child fund of Dimensional Fund Advisors Lp and if that institution has disclosed ownership in this security, then these positions will not be double counted when calculating total shares and total value | 1,765,706 | -0.26 | 111,204 | 0.55 | ||||
| 2025-08-13 | 13F | Twin Peaks Wealth Advisors, LLC | 181 | 15 | ||||||
| 2025-07-09 | 13F | Bruce G. Allen Investments, LLC | 481 | -48.06 | 40 | -22.00 | ||||
| 2025-08-14 | 13F | Ieq Capital, Llc | 8,263 | 682 | ||||||
| 2025-08-11 | 13F | Brown Brothers Harriman & Co | 160 | 13 | ||||||
| 2025-08-13 | 13F | Capital Analysts, Inc. | 139 | -14.20 | 0 | |||||
| 2025-08-14 | 13F | Erste Asset Management GmbH | 5,000 | 408 | ||||||
| 2025-08-13 | 13F | Quadrant Capital Group Llc | 30,642 | 10.69 | 2,531 | 69.00 | ||||
| 2025-07-29 | NP | GBFFX - GMO Benchmark-Free Fund Class III | 3,654 | 0.00 | 273 | 37.88 | ||||
| 2025-08-04 | 13F | Virtus Family Office LLC | 19,619 | 18.64 | 1,620 | 79.40 | ||||
| 2025-08-14 | 13F | Strategic Global Advisors, LLC | 3,430 | 283 | ||||||
| 2025-08-12 | 13F | SRS Capital Advisors, Inc. | 322 | 27 | ||||||
| 2025-08-14 | 13F | Atomi Financial Group, Inc. | 11,310 | 27.62 | 934 | 94.99 | ||||
| 2025-07-15 | 13F | Maseco Llp | 99 | 8 | ||||||
| 2025-08-04 | 13F | Simon Quick Advisors, Llc | 3,131 | 259 | ||||||
| 2025-06-26 | NP | DFSE - Dimensional Emerging Markets Sustainability Core 1 ETF | 4,208 | 4.91 | 265 | 6.00 | ||||
| 2025-08-14 | 13F | Balyasny Asset Management Llc | 25,305 | -11.87 | 2,090 | 34.51 | ||||
| 2025-08-12 | 13F | Franklin Resources Inc | 6,102 | 0.54 | 504 | 53.35 | ||||
| 2025-07-14 | 13F | UMA Financial Services, Inc. | 57 | 128.00 | 5 | 300.00 | ||||
| 2025-07-24 | 13F | Jfs Wealth Advisors, Llc | 515 | 3.41 | 43 | 61.54 | ||||
| 2025-08-14 | 13F/A | Bank Julius Baer & Co. Ltd, Zurich | 22,958 | 10.87 | 1,896 | 49.76 | ||||
| 2025-08-14 | 13F | Macquarie Group Ltd | 251,278 | -0.04 | 20,753 | 52.58 | ||||
| 2025-08-14 | 13F | Wealth Preservation Advisors, LLC | 29 | 2 | ||||||
| 2025-05-29 | NP | JVANX - International Equity Index Trust NAV | 0 | -100.00 | 0 | -100.00 | ||||
| 2025-05-12 | 13F | Polen Capital Management Llc | 0 | -100.00 | 0 | -100.00 | ||||
| 2025-08-13 | 13F | Russell Investments Group, Ltd. | 6,804 | 4,725.53 | 562 | 7,914.29 | ||||
| 2025-08-14 | 13F | Citadel Advisors Llc | 7,464 | -59.75 | 616 | -38.58 | ||||
| 2025-08-18 | 13F | Geneos Wealth Management Inc. | 8 | 1 | ||||||
| 2025-08-13 | 13F | Advisory Research Inc | 97,765 | 5.47 | 8,074 | 61.00 | ||||
| 2025-08-14 | 13F | Citadel Advisors Llc | Put | 3,900 | 105.26 | 322 | 215.69 | |||
| 2025-07-21 | 13F | Hgk Asset Management Inc | 0 | -100.00 | 0 | |||||
| 2025-07-30 | NP | APIE - ActivePassive International Equity ETF | 26,271 | -25.65 | 1,964 | 2.29 | ||||
| 2025-07-21 | 13F | Hilltop National Bank | 0 | -100.00 | 0 | |||||
| 2025-08-04 | 13F | Hantz Financial Services, Inc. | 771 | 817.86 | 0 | |||||
| 2025-06-26 | NP | DFCEX - Emerging Markets Core Equity Portfolio - Institutional Class This fund is a listed as child fund of Dimensional Fund Advisors Lp and if that institution has disclosed ownership in this security, then these positions will not be double counted when calculating total shares and total value | 367,901 | 0.00 | 23,170 | 0.82 | ||||
| 2025-08-14 | 13F | Citadel Advisors Llc | Call | 19,700 | 129.07 | 1,627 | 249.89 | |||
| 2025-05-09 | 13F | Deutsche Bank Ag\ | 0 | -100.00 | 0 | -100.00 | ||||
| 2025-08-07 | 13F | Hennion & Walsh Asset Management, Inc. | 10,866 | 31.61 | 897 | 101.12 | ||||
| 2025-08-13 | 13F | Bare Financial Services, Inc | 148 | 190.20 | 12 | 500.00 | ||||
| 2025-08-12 | 13F | BlackRock, Inc. | 1,671,572 | 3.22 | 138,055 | 57.55 | ||||
| 2025-08-14 | 13F | Boston Private Wealth Llc | 0 | -100.00 | 0 | -100.00 | ||||
| 2025-08-13 | 13F | Walleye Capital LLC | 674 | 56 | ||||||
| 2025-08-13 | 13F | Walleye Capital LLC | Call | 2,500 | 206 | |||||
| 2025-08-14 | 13F | Orbis Allan Gray Ltd | 370,306 | 0.91 | 30,584 | 54.02 | ||||
| 2025-06-26 | NP | DFEM - Dimensional Emerging Markets Core Equity 2 ETF | 26,085 | 18.04 | 1,643 | 18.99 | ||||
| 2025-07-25 | 13F | Verdence Capital Advisors LLC | 2,626 | 217 | ||||||
| 2025-08-14 | 13F | Millennium Management Llc | 33,034 | -10.11 | 2,728 | 37.22 | ||||
| 2025-07-23 | 13F | High Note Wealth, LLC | 4 | 0 | ||||||
| 2025-08-14 | 13F | Bank Of America Corp /de/ | 845,567 | 9.15 | 69,835 | 66.60 | ||||
| 2025-08-26 | NP | Profunds - Profund Vp Emerging Markets | 6,316 | 17.01 | 522 | 78.42 | ||||
| 2025-07-25 | 13F | Pzena Investment Management Llc | 41,601 | -17.38 | 3,436 | 26.10 | ||||
| 2025-06-26 | NP | HFIGX - Hartford Schroders Diversified Growth Fund Class I | 1,713 | 28.03 | 108 | 28.92 | ||||
| 2025-07-28 | 13F | Naviter Wealth, LLC | 4,507 | 372 | ||||||
| 2025-07-08 | 13F | Parallel Advisors, LLC | 10,756 | 10.22 | 888 | 68.18 | ||||
| 2025-07-17 | 13F | HB Wealth Management, LLC | 3,059 | 253 | ||||||
| 2025-08-08 | 13F | D'Orazio & Associates, Inc. | 2,662 | 220 | ||||||
| 2025-08-08 | 13F | Ranmore Fund Management Ltd | 255,549 | 8.49 | 21,106 | 65.59 | ||||
| 2025-08-11 | 13F | TD Waterhouse Canada Inc. | 0 | -100.00 | 0 | |||||
| 2025-08-11 | 13F | Vanguard Group Inc | 368,458 | 0.00 | 30,431 | 52.63 | ||||
| 2025-08-13 | 13F | Thornburg Investment Management Inc | 5,650 | -79.42 | 467 | -96.86 | ||||
| 2025-08-08 | 13F | Candriam Luxembourg S.C.A. | 6,063 | 0.00 | 501 | 52.44 | ||||
| 2025-06-26 | NP | DFA INVESTMENT DIMENSIONS GROUP INC - Emerging Markets Social Core Equity Portfolio Shares | 10,427 | 0.00 | 657 | 0.77 | ||||
| 2025-08-14 | 13F | Royal Bank Of Canada | 340,327 | 24.62 | 28,109 | 90.20 | ||||
| 2025-06-26 | NP | Dfa Investment Trust Co - The Emerging Markets Series This fund is a listed as child fund of Dimensional Fund Advisors Lp and if that institution has disclosed ownership in this security, then these positions will not be double counted when calculating total shares and total value | 2,997 | -28.20 | 189 | -27.69 | ||||
| 2025-08-04 | 13F | Atria Investments Llc | 9,581 | 53.00 | 791 | 134.02 | ||||
| 2025-08-13 | 13F | Congress Wealth Management LLC / DE / | 5,217 | -49.40 | 431 | -22.80 | ||||
| 2025-07-28 | NP | AVES - Avantis Emerging Markets Value ETF This fund is a listed as child fund of American Century Companies Inc and if that institution has disclosed ownership in this security, then these positions will not be double counted when calculating total shares and total value | 76,629 | 11.60 | 5,728 | 53.61 | ||||
| 2025-08-14 | 13F | Voya Investment Management Llc | 34,575 | 2,856 | ||||||
| 2025-05-15 | 13F | Cullen Capital Management, LLC | 93,222 | -26.93 | 5,044 | -30.51 | ||||
| 2025-07-18 | 13F | Deltec Asset Management Llc | 17,000 | -2.86 | 1,404 | 48.41 | ||||
| 2025-07-25 | 13F | JustInvest LLC | 51,141 | 18.17 | 4,224 | 80.39 | ||||
| 2025-08-14 | 13F/A | Barclays Plc | 4,870 | -72.55 | 0 | |||||
| 2025-07-30 | 13F | DekaBank Deutsche Girozentrale | 10,687 | 0.00 | 1 | |||||
| 2025-07-30 | 13F | Drive Wealth Management, Llc | 3,366 | 278 | ||||||
| 2025-07-31 | 13F | Cambridge Investment Research Advisors, Inc. | 5,465 | 45.23 | 0 | |||||
| 2025-08-14 | 13F | Susquehanna International Group, Llp | Call | 18,800 | -9.62 | 1,553 | 37.96 | |||
| 2025-08-14 | 13F | Susquehanna International Group, Llp | Put | 9,500 | -54.55 | 785 | -30.62 | |||
| 2025-08-14 | 13F | Ameriprise Financial Inc | 9,641 | -4.17 | 796 | 46.32 | ||||
| 2025-08-13 | 13F | Shelton Capital Management | 4,409 | 364 | ||||||
| 2025-07-14 | 13F | Foster Group, Inc. | 3,545 | 293 | ||||||
| 2025-07-16 | 13F | Highline Wealth Partners Llc | 112 | 119.61 | 9 | 350.00 | ||||
| 2025-08-13 | 13F | Guggenheim Capital Llc | 22,225 | 15.70 | 1,836 | 76.61 | ||||
| 2025-05-15 | 13F | Nomura Holdings Inc | 0 | -100.00 | 0 | |||||
| 2025-08-12 | 13F | O'shaughnessy Asset Management, Llc | 122,938 | 6.30 | 10,153 | 62.27 | ||||
| 2025-08-11 | 13F | Lsv Asset Management | 20,100 | 0.00 | 2 | 0.00 | ||||
| 2025-08-13 | 13F | Quantbot Technologies LP | 4,753 | 393 | ||||||
| 2025-07-30 | 13F | Blume Capital Management, Inc. | 4 | 0 | ||||||
| 2025-08-08 | 13F | Hartland & Co., LLC | 83 | 0.00 | 7 | 50.00 | ||||
| 2025-08-14 | 13F | Warren Averett Asset Management, LLC | 5,069 | 0.00 | 419 | 52.55 | ||||
| 2025-07-28 | NP | NSI - National Security Emerging Markets Index ETF | 1,685 | 38.68 | 126 | 92.31 | ||||
| 2025-07-29 | NP | RBB FUND, INC. - Aquarius International Fund | 6,431 | 0.00 | 481 | 37.54 | ||||
| 2025-08-29 | NP | SA FUNDS INVESTMENT TRUST - SA Emerging Markets Value Fund | 17,477 | -10.78 | 1,443 | 36.26 | ||||
| 2025-08-05 | 13F | Bank Of Montreal /can/ | 62,296 | 16.46 | 5,145 | 77.78 | ||||
| 2025-08-07 | 13F | Allworth Financial LP | 1,298 | 5.70 | 107 | 48.61 | ||||
| 2025-08-05 | 13F | Simplex Trading, Llc | Put | 100 | -92.31 | 0 | ||||
| 2025-08-05 | 13F | Simplex Trading, Llc | 832 | -12.51 | 0 | |||||
| 2025-08-12 | 13F | Rhumbline Advisers | 37,811 | -16.22 | 3,123 | 27.85 | ||||
| 2025-07-25 | 13F | Johnson Investment Counsel Inc | 2,733 | 226 | ||||||
| 2025-08-05 | 13F | Simplex Trading, Llc | Call | 10,300 | 1 | |||||
| 2025-08-06 | 13F | Commonwealth Equity Services, Llc | 6,613 | -33.88 | 1 | |||||
| 2025-08-12 | 13F | Seeds Investor Llc | 6,379 | 19.70 | 527 | 82.64 | ||||
| 2025-07-08 | 13F | Arlington Trust Co LLC | 112 | 0.00 | 9 | 50.00 | ||||
| 2025-07-14 | 13F | AdvisorNet Financial, Inc | 96 | -28.36 | 8 | 0.00 | ||||
| 2025-07-28 | NP | AVXC - Avantis Emerging Markets ex-China Equity ETF | 5,924 | 37.35 | 443 | 88.89 | ||||
| 2025-08-05 | 13F | Huntington National Bank | 978 | 2.19 | 81 | 56.86 | ||||
| 2025-08-06 | 13F | Paradigm Asset Management Co Llc | 600 | 0.00 | 50 | 53.13 | ||||
| 2025-08-14 | 13F | Wellington Management Group Llp | 112,677 | -0.47 | 9,306 | 51.92 | ||||
| 2025-08-14 | 13F | Integrated Wealth Concepts LLC | 4,102 | 339 | ||||||
| 2025-08-13 | 13F | First Trust Advisors Lp | 16,481 | -14.16 | 1,361 | 31.12 | ||||
| 2025-08-14 | 13F | Ariel Investments, Llc | 52,122 | -50.06 | 4,305 | -23.78 | ||||
| 2025-08-14 | 13F/A | Rockefeller Capital Management L.P. | 15,458 | -0.92 | 1,277 | 51.18 | ||||
| 2025-08-15 | 13F | WealthCollab, LLC | 898 | -4.77 | 74 | 45.10 | ||||
| 2025-08-14 | 13F | Wetherby Asset Management Inc | 55,945 | 2.21 | 4,620 | 48.36 | ||||
| 2025-08-14 | 13F | Stifel Financial Corp | 24,603 | 22.18 | 2,032 | 86.50 | ||||
| 2025-08-06 | 13F | BNP Paribas Asset Management Holding S.A. | 109,808 | 9 | ||||||
| 2025-05-01 | 13F | Schechter Investment Advisors, LLC | 4,953 | -25.57 | 268 | -29.37 | ||||
| 2025-08-08 | 13F | Crossmark Global Holdings, Inc. | 29,535 | 76.29 | 2,439 | 169.21 | ||||
| 2025-08-11 | 13F | Hexagon Capital Partners LLC | 0 | -100.00 | 0 | |||||
| 2025-08-13 | 13F | Mount Yale Investment Advisors, LLC | 2,464 | 204 | ||||||
| 2025-05-15 | 13F | Glenmede Trust Co Na | 3,755 | -21.15 | 203 | -24.81 | ||||
| 2025-08-14 | 13F | Mml Investors Services, Llc | 4,126 | 5.26 | 0 | |||||
| 2025-08-14 | 13F | Goldman Sachs Group Inc | 190,327 | -9.51 | 15,719 | 38.12 | ||||
| 2025-06-30 | NP | VEU - Vanguard FTSE All-World ex-US Index Fund ETF Shares | 295,077 | 0.00 | 18,584 | 0.81 | ||||
| 2025-08-13 | 13F | Kilter Group LLC | 53 | 4 | ||||||
| 2025-08-14 | 13F | Mariner, LLC | 28,869 | 14.60 | 2,383 | 74.96 | ||||
| 2025-08-11 | 13F | Frank, Rimerman Advisors LLC | 8,151 | 673 | ||||||
| 2025-05-02 | 13F | Cable Hill Partners, LLC | 5,459 | -2.20 | 344 | 8.20 | ||||
| 2025-08-04 | 13F | Spire Wealth Management | 59 | 5 | ||||||
| 2025-08-14 | 13F | Axa S.a. | 19,169 | 0.00 | 1,583 | 52.65 | ||||
| 2025-07-24 | 13F | Us Bancorp \de\ | 21,300 | 4.20 | 1,759 | 59.04 | ||||
| 2025-08-08 | 13F | JBF Capital, Inc. | 6,000 | 20.00 | 496 | 83.33 | ||||
| 2025-07-09 | 13F | Triumph Capital Management | 0 | -100.00 | 0 | |||||
| 2025-08-07 | 13F | Profund Advisors Llc | 8,667 | 24.40 | 716 | 90.16 | ||||
| 2025-08-27 | NP | GBVCX - Victory Pioneer Global Value Fund Class C | 1,330 | 0.00 | 110 | 53.52 | ||||
| 2025-08-13 | 13F | Cerity Partners LLC | 42,346 | -9.17 | 3,497 | 38.66 | ||||
| 2025-08-07 | 13F | BOK Financial Private Wealth, Inc. | 0 | -100.00 | 0 | |||||
| 2025-08-26 | NP | MASTER INVESTMENT PORTFOLIO - Active Stock Master Portfolio Active Stock Portfolio | 690 | -76.92 | 57 | -65.22 | ||||
| 2025-08-14 | 13F | Lazard Asset Management Llc | 1,554,154 | 1.73 | 128 | 56.10 | ||||
| 2025-08-01 | 13F | Bessemer Group Inc | 2,515 | 0.00 | 0 | |||||
| 2025-08-13 | 13F | Marshall Wace, Llp | 168,857 | -40.13 | 13,946 | -8.61 | ||||
| 2025-08-19 | 13F | Asset Dedication, LLC | 20 | 0.00 | 2 | 0.00 | ||||
| 2025-08-07 | 13F | Teachers Retirement System Of The State Of Kentucky | 320,500 | -14.58 | 26 | 30.00 | ||||
| 2025-08-13 | 13F | M&t Bank Corp | 4,418 | 2.74 | 365 | 56.90 | ||||
| 2025-08-12 | 13F | MAI Capital Management | 2,828 | 234 | ||||||
| 2025-08-12 | 13F | Global Retirement Partners, LLC | 8,245 | 23,457.14 | 681 | 67,900.00 | ||||
| 2025-08-13 | 13F | Townsquare Capital Llc | 0 | -100.00 | 0 | |||||
| 2025-05-15 | 13F | Ancora Advisors, LLC | 0 | -100.00 | 0 | -100.00 | ||||
| 2025-08-13 | 13F | Capital World Investors | 26,060 | -9.56 | 2,124 | 38.19 | ||||
| 2025-08-14 | 13F | Principal Street Partners, LLC | 2,598 | 215 | ||||||
| 2025-08-12 | 13F | Pathstone Holdings, LLC | 26,373 | 9.22 | 2,178 | 66.77 | ||||
| 2025-07-22 | 13F | LGT Group Foundation | 14,657 | 165.77 | 1,211 | 306.04 | ||||
| 2025-08-13 | 13F | Capital Group Private Client Services, Inc. | 81,721 | -0.74 | 6,749 | 51.49 | ||||
| 2025-07-22 | 13F | Knights of Columbus Asset Advisors LLC | 8,071 | 0.00 | 667 | 52.75 | ||||
| 2025-07-17 | 13F | V-Square Quantitative Management LLC | 0 | -100.00 | 0 | |||||
| 2025-08-14 | 13F | Vident Advisory, LLC | 50,090 | -20.71 | 4,137 | 21.01 | ||||
| 2025-08-08 | 13F | Creative Planning | 104,163 | 34.74 | 8,603 | 105.64 | ||||
| 2025-08-14 | 13F | Wiley Bros.-aintree Capital, Llc | 6,640 | 5.87 | 548 | 64.07 | ||||
| 2025-08-11 | 13F | HighTower Advisors, LLC | 4,576 | -7.96 | 378 | 40.15 | ||||
| 2025-07-09 | 13F | Gilman Hill Asset Management, LLC | 69,313 | 0.02 | 5,725 | 52.68 | ||||
| 2025-07-30 | 13F | Ethic Inc. | 57,016 | -6.33 | 4,647 | 39.76 | ||||
| 2025-08-12 | 13F | Gitterman Wealth Management, LLC | 3,200 | 264 | ||||||
| 2025-08-13 | 13F | Natixis Advisors, L.p. | 34,461 | -4.51 | 3 | 100.00 | ||||
| 2025-08-14 | 13F | Royal London Asset Management Ltd | 12,488 | 0.87 | 1,031 | 54.11 | ||||
| 2025-08-14 | 13F | Qube Research & Technologies Ltd | 0 | -100.00 | 0 | |||||
| 2025-06-25 | NP | WRAAX - Wilmington Global Alpha Equities Fund Class A Shares | 2,787 | 9.68 | 176 | 10.76 | ||||
| 2025-07-17 | 13F | Greenleaf Trust | 14,613 | 0.29 | 1,207 | 53.05 | ||||
| 2025-08-14 | 13F | Promethos Capital, LLC | 115,335 | 0.96 | 9,525 | 54.10 | ||||
| 2025-08-14 | 13F | Ubs Asset Management Americas Inc | 15,980 | -83.47 | 1,320 | -74.78 | ||||
| 2025-08-14 | 13F | Altrinsic Global Advisors Llc | 54,811 | -0.24 | 4,527 | 52.24 | ||||
| 2025-07-28 | NP | AVSE - Avantis Responsible Emerging Markets Equity ETF | 7,004 | 13.24 | 524 | 56.12 | ||||
| 2025-05-15 | 13F | CAPROCK Group, Inc. | 17,894 | 0.23 | 978 | -3.65 | ||||
| 2025-08-27 | NP | RYWTX - Emerging Markets 2x Strategy Fund Class A | 1,969 | 161.14 | 163 | 305.00 | ||||
| 2025-07-28 | 13F | Harbour Investments, Inc. | 241 | 0.00 | 20 | 46.15 | ||||
| 2025-07-28 | 13F | BRYN MAWR TRUST Co | 50 | -91.13 | 4 | -86.67 | ||||
| 2025-08-14 | 13F | Sei Investments Co | 14,268 | 3.62 | 1,178 | 58.12 | ||||
| 2025-07-30 | 13F | Bleakley Financial Group, LLC | 10,340 | -7.26 | 854 | 41.46 | ||||
| 2025-08-06 | 13F | Savant Capital, LLC | 4,150 | 343 | ||||||
| 2025-08-13 | 13F | Victory Capital Management Inc | 68,740 | 340.08 | 5,755 | 581.07 | ||||
| 2025-08-12 | 13F | Wayfinding Financial, LLC | 0 | -100.00 | 0 | |||||
| 2025-09-04 | 13F/A | Advisor Group Holdings, Inc. | 6,889 | 19.13 | 569 | 82.05 | ||||
| 2025-08-14 | 13F | Voloridge Investment Management, Llc | 23,860 | -66.47 | 1,971 | -48.83 | ||||
| 2025-08-14 | 13F | Colony Group, LLC | 8,991 | 743 | ||||||
| 2025-06-26 | NP | DFAX - Dimensional World ex U.S. Core Equity 2 ETF | 10,567 | 0.00 | 666 | 0.76 | ||||
| 2025-08-29 | NP | MPLAX - Praxis International Index Fund Class A | 19,354 | 113.24 | 1,598 | 225.46 | ||||
| 2025-08-11 | 13F | Pinnacle Wealth Planning Services, Inc. | 3,477 | -16.50 | 287 | 27.56 | ||||
| 2025-07-15 | 13F | Mather Group, Llc. | 0 | -100.00 | 0 | |||||
| 2025-08-01 | 13F | Oversea-Chinese Banking CORP Ltd | 3,547 | -8.91 | 293 | 39.05 | ||||
| 2025-07-09 | 13F | Aaron Wealth Advisors LLC | 5,676 | 9.98 | 469 | 67.74 | ||||
| 2025-08-14 | 13F | Silvercrest Asset Management Group Llc | 161,146 | 0.00 | 13,309 | 52.64 | ||||
| 2025-08-08 | 13F | Wealth Alliance | 2,599 | 215 | ||||||
| 2025-08-13 | 13F | EverSource Wealth Advisors, LLC | 6,692 | 11.38 | 553 | 69.85 | ||||
| 2025-08-13 | 13F | Arrowstreet Capital, Limited Partnership | 963,244 | -0.47 | 79,554 | 51.91 | ||||
| 2025-06-26 | NP | EMQAX - Ashmore Emerging Markets Active Equity Fund CLASS A | 0 | -100.00 | 0 | -100.00 | ||||
| 2025-05-05 | 13F | Transce3nd, LLC | 0 | -100.00 | 0 | |||||
| 2025-08-08 | 13F | Itau Unibanco Holding S.A. | 15,158 | -1.33 | 1,252 | |||||
| 2025-05-05 | 13F | Eagle Bay Advisors LLC | 0 | -100.00 | 0 | -100.00 | ||||
| 2025-07-25 | 13F | Cwm, Llc | 2,267 | -7.88 | 0 | |||||
| 2025-08-14 | 13F | Jane Street Group, Llc | 0 | -100.00 | 0 | |||||
| 2025-07-23 | 13F | Vontobel Holding Ltd. | 2,560 | 211 | ||||||
| 2025-06-26 | NP | DFEV - Dimensional Emerging Markets Value ETF | 3,434 | -39.76 | 216 | -39.33 | ||||
| 2025-07-25 | NP | DWGAX - AMERICAN FUNDS DEVELOPING WORLD GROWTH & INCOME FUND Class A This fund is a listed as child fund of Capital World Investors and if that institution has disclosed ownership in this security, then these positions will not be double counted when calculating total shares and total value | 81,239 | 0.00 | 6,073 | 37.62 | ||||
| 2025-08-14 | 13F | Systematic Alpha Investments, LLC | 3,600 | 297 | ||||||
| 2025-07-24 | 13F | PDS Planning, Inc | 8,373 | 4.35 | 692 | 59.22 | ||||
| 2025-08-12 | 13F | American Century Companies Inc | 751,168 | 18.32 | 62,039 | 80.59 | ||||
| 2025-08-14 | 13F/A | Skopos Labs, Inc. | 2,108 | 573.48 | 174 | 987.50 | ||||
| 2025-04-21 | 13F | Nelson, Van Denburg & Campbell Wealth Management Group, LLC | 0 | -100.00 | 0 | |||||
| 2025-06-26 | NP | BLACKROCK FUNDS - BlackRock Advantage ESG Emerging Markets Equity Fund Institutional This fund is a listed as child fund of BlackRock, Inc. and if that institution has disclosed ownership in this security, then these positions will not be double counted when calculating total shares and total value | 265 | -59.23 | 17 | -60.00 | ||||
| 2025-07-21 | 13F | Credential Qtrade Securities Inc. | 0 | -100.00 | 0 | -100.00 | ||||
| 2025-08-14 | 13F | Wells Fargo & Company/mn | 105,244 | 15.99 | 8,692 | 77.06 | ||||
| 2025-08-14 | 13F | Barometer Capital Management Inc. | 3,043 | 0.00 | 251 | 53.05 | ||||
| 2025-08-27 | 13F/A | Brinker Capital Investments, LLC | 17,686 | 69.00 | 1,461 | 157.95 | ||||
| 2025-07-07 | 13F | Northwest & Ethical Investments L.P. | 0 | -100.00 | 0 | -100.00 | ||||
| 2025-08-08 | 13F | Cetera Investment Advisers | 8,584 | 66.39 | 709 | 153.76 | ||||
| 2025-07-29 | 13F | Private Trust Co Na | 19 | 2 | ||||||
| 2025-04-17 | 13F | Optas, LLC | 0 | -100.00 | 0 | |||||
| 2025-04-17 | 13F | Vista Wealth Management Group, LLC | 4,656 | -15.94 | 252 | -20.32 | ||||
| 2025-08-01 | 13F | Solstein Capital, LLC | 14,987 | 0.00 | 1,238 | 52.72 | ||||
| 2025-08-14 | 13F | UBS Group AG | 87,082 | -33.55 | 7,192 | 1.42 | ||||
| 2025-08-14 | 13F | Smartleaf Asset Management LLC | 146 | -18.44 | 12 | 22.22 | ||||
| 2025-08-11 | 13F | Citigroup Inc | 66,180 | 6.81 | 5,466 | 63.04 | ||||
| 2025-08-08 | 13F | SBI Securities Co., Ltd. | 6 | 500.00 | 0 | |||||
| 2025-08-08 | 13F | Pnc Financial Services Group, Inc. | 13,515 | 15.51 | 1,116 | 76.30 | ||||
| 2025-08-28 | NP | QEMM - SPDR MSCI Emerging Markets StrategicFactors ETF | 1,270 | -3.93 | 105 | 46.48 | ||||
| 2025-07-24 | 13F | IFP Advisors, Inc | 86 | 62.26 | 7 | 250.00 | ||||
| 2025-08-13 | 13F | Hsbc Holdings Plc | 442,300 | 141.53 | 21,338 | 79.21 | ||||
| 2025-08-12 | 13F | Proequities, Inc. | Put | 0 | 0 | |||||
| 2025-08-13 | 13F | Hsbc Holdings Plc | Call | 30,000 | 0.00 | 2,478 | 52.62 | |||
| 2025-08-13 | 13F | Northwestern Mutual Wealth Management Co | 878 | 10,875.00 | 73 | |||||
| 2025-08-14 | 13F | Fmr Llc | 23,089 | 40.32 | 1,907 | 114.16 | ||||
| 2025-08-12 | 13F | Proequities, Inc. | Call | 0 | 0 | |||||
| 2025-08-25 | 13F/A | Neuberger Berman Group LLC | 2,929 | 242 | ||||||
| 2025-08-12 | 13F | Proequities, Inc. | 0 | 0 | ||||||
| 2025-08-28 | NP | JINTX - Johnson International Fund | 2,400 | 0.00 | 198 | 53.49 | ||||
| 2025-07-11 | 13F | Farther Finance Advisors, LLC | 2,134 | 215.21 | 176 | 388.89 | ||||
| 2025-08-07 | 13F | Midwest Trust Co | 3,549 | 293 | ||||||
| 2025-07-01 | 13F | Confluence Investment Management Llc | 4,732 | -6.45 | 391 | 42.86 | ||||
| 2025-07-10 | 13F | Wealth Enhancement Advisory Services, Llc | 26,053 | -1.12 | 2,233 | 56.63 | ||||
| 2025-08-07 | 13F | Sierra Ocean, Llc | 425 | -1.62 | 35 | 52.17 | ||||
| 2025-08-15 | 13F | CI Private Wealth, LLC | 15,808 | 3.22 | 1,306 | 57.61 | ||||
| 2025-08-12 | 13F | Advisors Asset Management, Inc. | 14,796 | 5.16 | 1,222 | 60.58 | ||||
| 2025-08-12 | 13F/A | Boston Partners | 86,769 | -28.88 | 7,163 | 8.19 | ||||
| 2025-07-15 | 13F | Ballentine Partners, LLC | 24,447 | 16.02 | 2,019 | 77.11 | ||||
| 2025-05-15 | 13F | Jain Global LLC | 0 | -100.00 | 0 | |||||
| 2025-08-12 | 13F | CIBC Private Wealth Group, LLC | 199 | 105.15 | 16 | 300.00 | ||||
| 2025-07-25 | 13F | Allspring Global Investments Holdings, LLC | 3,645 | 302 | ||||||
| 2025-05-15 | 13F | Integrated Quantitative Investments LLC | 0 | -100.00 | 0 | |||||
| 2025-08-14 | 13F | Bnp Paribas Arbitrage, Sa | 5,547 | -94.85 | 458 | -92.15 |