Mga Batayang Estadistika
| Pemilik Institusional | 189 total, 187 long only, 1 short only, 1 long/short - change of 0.00% MRQ |
| Alokasi Portofolio Rata-rata | 0.2030 % - change of -0.58% MRQ |
| Saham Institusional (Jangka Panjang) | 34,969,587 (ex 13D/G) - change of -3.60MM shares -9.34% MRQ |
| Nilai Institusional (Jangka Panjang) | $ 345,017 USD ($1000) |
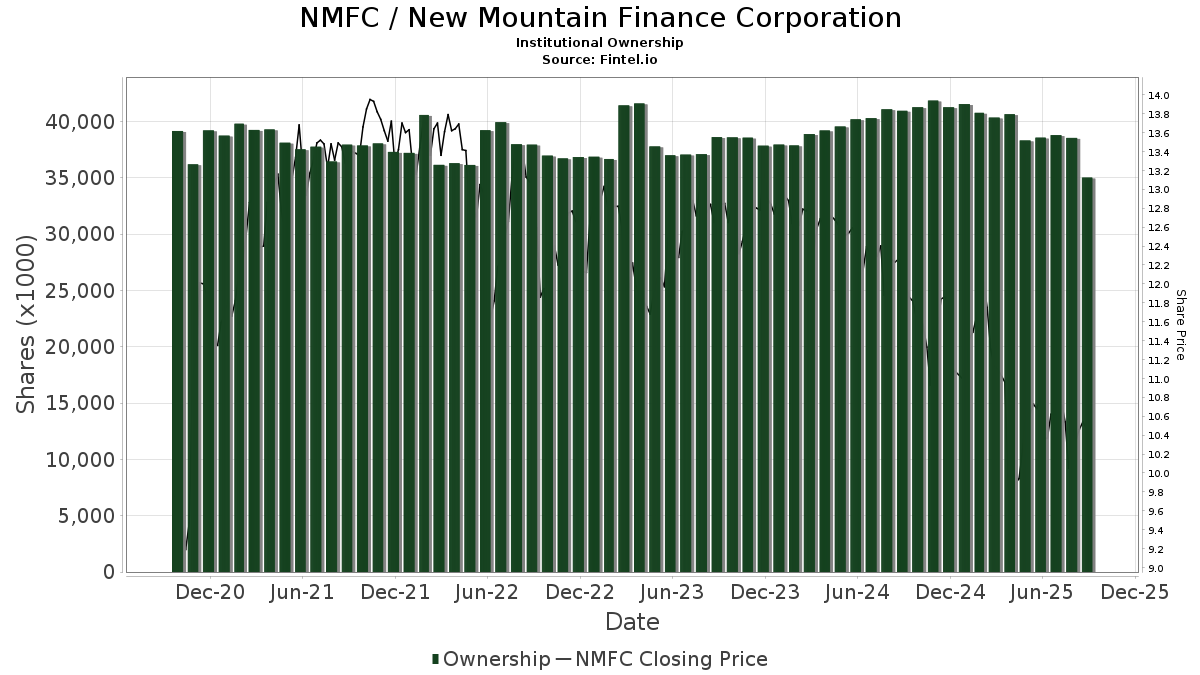
Kepemilikan Institusional dan Pemegang Saham
New Mountain Finance Corporation (US:NMFC) memiliki 189 pemilik institusional dan pemegang saham yang telah mengajukan formulir 13D/G atau 13F kepada Komisi Bursa Efek (Securities Exchange Commission/SEC). Lembaga-lembaga ini memegang total 34,969,587 saham. Pemegang saham terbesar meliputi Cerity Partners LLC, Lsv Asset Management, Van Eck Associates Corp, BIZD - VanEck Vectors BDC Income ETF, UBS Group AG, Jpmorgan Chase & Co, Two Sigma Advisers, Lp, Invesco Ltd., KBWD - Invesco KBW High Dividend Yield Financial ETF, and Dimension Capital Management Llc .
Struktur kepemilikan institusional New Mountain Finance Corporation (NasdaqGS:NMFC) menunjukkan posisi terkini di perusahaan oleh institusi dan dana, serta perubahan terbaru dalam ukuran posisi. Pemegang saham utama dapat mencakup investor individu, reksa dana, dana lindung nilai, atau institusi. Jadwal 13D menunjukkan bahwa investor memegang (atau pernah memegang) lebih dari 5% saham perusahaan dan bermaksud (atau pernah bermaksud) untuk secara aktif mengejar perubahan strategi bisnis. Jadwal 13G menunjukkan investasi pasif lebih dari 5%.
The share price as of September 5, 2025 is 10.62 / share. Previously, on September 9, 2024, the share price was 12.11 / share. This represents a decline of 12.30% over that period.
Skor Sentimen Dana
Skor Sentimen Dana (sebelumnya dikenal sebagai Skor Akumulasi Kepemilikan) menemukan saham-saham yang paling banyak dibeli oleh dana. Ini adalah hasil dari model kuantitatif multi-faktor yang canggih yang mengidentifikasi perusahaan dengan tingkat akumulasi institusional tertinggi. Model penilaian menggunakan kombinasi dari total peningkatan pemilik yang diungkapkan, perubahan dalam alokasi portofolio pada pemilik tersebut, dan metrik lainnya. Angka berkisar dari 0 hingga 100, dengan angka yang lebih tinggi menunjukkan tingkat akumulasi yang lebih tinggi dibandingkan dengan perusahaan sejenisnya, dan 50 adalah rata-ratanya.
Frekuensi Pembaruan: Setiap Hari
Lihat Ownership Explorer, yang menyediakan daftar perusahaan dengan peringkat tertinggi.
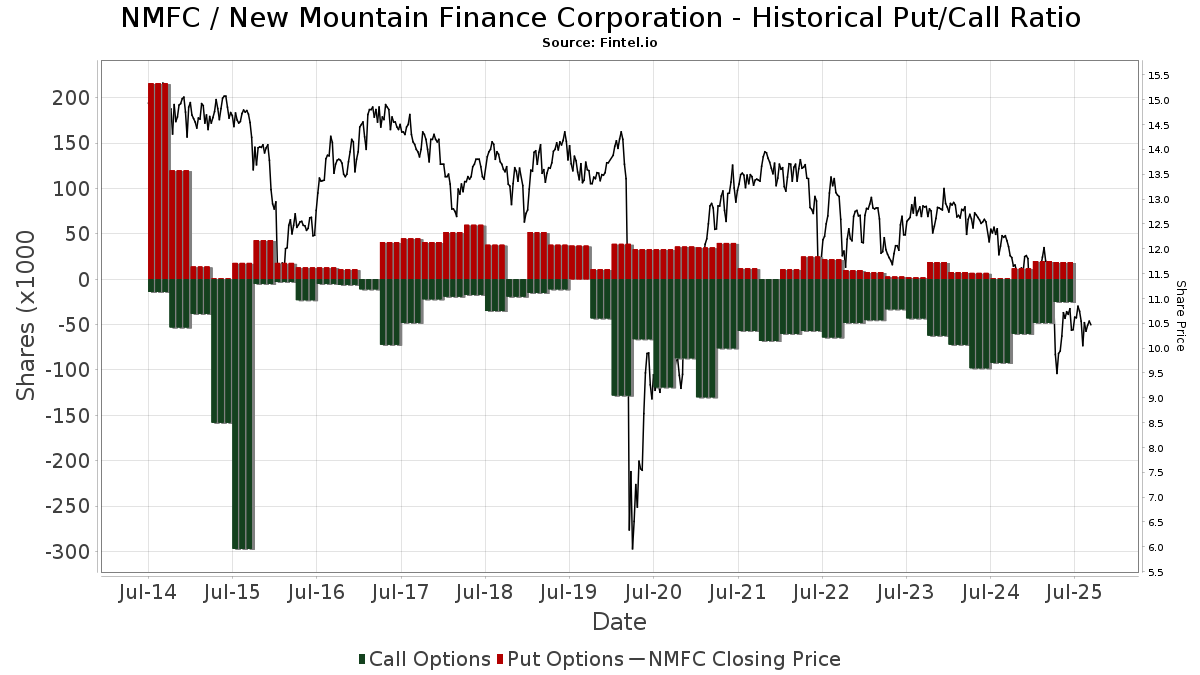
Rasio Put/Call Institusional
Selain melaporkan isu ekuitas dan utang standar, institusi dengan aset di bawah manajemen lebih dari 100 juta dolar AS juga harus mengungkapkan kepemilikan opsi put dan call mereka. Karena opsi put umumnya menunjukkan sentimen negatif, dan opsi call menunjukkan sentimen positif, kita dapat mengetahui sentimen institusional secara keseluruhan dengan memplot rasio put terhadap call. Grafik di sebelah kanan memplot rasio put/call historis untuk instrumen ini.
Menggunakan Rasio Put/Call sebagai indikator sentimen investor mengatasi salah satu kekurangan utama dari penggunaan total kepemilikan institusional, yaitu sejumlah besar aset yang dikelola diinvestasikan secara pasif untuk melacak indeks. Dana yang dikelola secara pasif biasanya tidak membeli opsi, sehingga indikator rasio put/call lebih akurat dalam melacak sentimen dana yang dikelola secara aktif.
Pengajuan 13D/G
Kami menyajikan pengajuan 13D/G secara terpisah dari pengajuan 13F karena perlakuan yang berbeda oleh SEC. Pengajuan 13D/G dapat diajukan oleh kelompok investor (dengan satu pemimpin), sedangkan pengajuan 13F tidak bisa. Hal ini mengakibatkan situasi di mana seorang investor dapat mengajukan 13D/G yang melaporkan satu nilai untuk total saham (mewakili semua saham yang dimiliki oleh kelompok investor), tetapi kemudian mengajukan 13F yang melaporkan nilai yang berbeda untuk total saham (mewakili kepemilikan mereka sendiri). Ini berarti bahwa kepemilikan saham dari pengajuan 13D/G dan pengajuan 13F seringkali tidak dapat dibandingkan secara langsung, sehingga kami menyajikannya secara terpisah.
Catatan: Mulai 16 Mei 2021, kami tidak lagi menampilkan pemilik yang belum mengajukan 13D/G dalam setahun terakhir. Sebelumnya, kami menampilkan riwayat lengkap pengajuan 13D/G. Secara umum, entitas yang diwajibkan untuk mengajukan pengajuan 13D/G harus mengajukan setidaknya setiap tahun sebelum mengirimkan pengajuan penutupan. Namun, terkadang dana keluar dari posisi tanpa mengirimkan pengajuan penutupan (misalnya, mereka menghentikan operasi), sehingga menampilkan riwayat lengkap terkadang menyebabkan kebingungan tentang kepemilikan saat ini. Untuk mencegah kebingungan, kami sekarang hanya menampilkan pemilik 'saat ini' - yaitu - pemilik yang telah mengajukan dalam setahun terakhir.
Upgrade to unlock premium data.
| Tanggal File | Formulir | Investor | Sebelumnya Saham |
Terbaru Saham |
Δ Saham (Persen) |
Kepemilikan (Persen) |
Δ Pagmamay-ari (Persen) |
|
|---|---|---|---|---|---|---|---|---|
| 2024-11-26 | KLINSKY STEVEN B | 8,690,180 | 10,409,258 | 19.78 | 9.65 | 7.22 | ||
| 2024-11-14 | Radcliffe Capital Management, L.P. | 7,236,604 | 3,528,941 | -51.23 | 3.17 | -52.62 |
Pengajuan 13F dan NPORT
Detail pada pengajuan 13F tersedia gratis. Detail pada pengajuan NP memerlukan keanggotaan premium. Baris berwarna hijau menunjukkan posisi baru. Baris berwarna merah menunjukkan posisi yang sudah ditutup. Klik tautan ini ikon untuk melihat riwayat transaksi selengkapnya.
Tingkatkan
untuk membuka data premium dan mengekspor ke Excel ![]() .
.
| Tanggal File | Sumber | Investor | Ketik | Presyo ng Avg (Silangan) |
Saham | Δ Saham (%) |
Dilaporkan Nilai ($1000) |
Nilai Δ (%) |
Alokasi Port (%) |
|
|---|---|---|---|---|---|---|---|---|---|---|
| 2025-07-17 | 13F | Sound Income Strategies, LLC | 800 | 0.00 | 8 | 0.00 | ||||
| 2025-08-08 | 13F | Geode Capital Management, Llc | 53,270 | 0.00 | 562 | -4.43 | ||||
| 2025-08-12 | 13F | Franklin Resources Inc | 643,433 | 18.10 | 6,788 | 12.96 | ||||
| 2025-07-17 | 13F | Janney Montgomery Scott LLC | 114,904 | -5.39 | 1 | 0.00 | ||||
| 2025-07-22 | 13F | Valeo Financial Advisors, LLC | 59,850 | 0.00 | 631 | -4.39 | ||||
| 2025-08-11 | 13F | Citigroup Inc | 17 | -99.84 | 0 | -100.00 | ||||
| 2025-07-08 | 13F | Parallel Advisors, LLC | 300 | 0.00 | 3 | 0.00 | ||||
| 2025-07-01 | 13F | Confluence Investment Management Llc | 369,161 | -15.85 | 3,895 | -19.51 | ||||
| 2025-08-13 | 13F | Marshall Wace, Llp | 218,263 | 2,303 | ||||||
| 2025-08-13 | 13F | Mackenzie Financial Corp | 30,180 | -10.95 | 318 | -14.75 | ||||
| 2025-08-12 | 13F | Pathstone Holdings, LLC | 297,323 | 0.37 | 3,137 | -4.01 | ||||
| 2025-08-04 | 13F | Muzinich & Co., Inc. | 575,474 | 46.38 | 6,071 | 40.01 | ||||
| 2025-08-11 | 13F | Hexagon Capital Partners LLC | 0 | -100.00 | 0 | |||||
| 2025-05-05 | 13F | Lindbrook Capital, Llc | 0 | -100.00 | 0 | |||||
| 2025-08-14 | 13F | State Street Corp | 103,263 | 257.76 | 1,089 | 242.45 | ||||
| 2025-07-31 | 13F | Cambridge Investment Research Advisors, Inc. | 155,504 | 8.66 | 2 | 0.00 | ||||
| 2025-08-12 | 13F | XTX Topco Ltd | 16,302 | 172 | ||||||
| 2025-08-08 | 13F | Hartland & Co., LLC | 0 | -100.00 | 0 | |||||
| 2025-08-19 | 13F | Newbridge Financial Services Group, Inc. | 485 | 5 | ||||||
| 2025-08-14 | 13F | Boothbay Fund Management, Llc | 13,623 | 144 | ||||||
| 2025-07-31 | 13F | Moloney Securities Asset Management, LLC | 28,047 | -8.03 | 296 | -12.20 | ||||
| 2025-08-11 | 13F | Mill Creek Capital Advisors, LLC | 149,000 | 0.00 | 1,572 | -4.38 | ||||
| 2025-05-12 | 13F | Fmr Llc | 0 | -100.00 | 0 | |||||
| 2025-07-29 | 13F | International Assets Investment Management, Llc | 32,438 | 3.77 | 342 | -0.58 | ||||
| 2025-08-13 | 13F | EverSource Wealth Advisors, LLC | 308 | 0.00 | 3 | 0.00 | ||||
| 2025-07-16 | 13F | Essex Financial Services, Inc. | 19,108 | 30.80 | 202 | 24.84 | ||||
| 2025-08-05 | 13F | Bard Associates Inc | 27,473 | 0.00 | 290 | -4.62 | ||||
| 2025-08-14 | 13F | Jane Street Group, Llc | 0 | -100.00 | 0 | |||||
| 2025-06-18 | NP | Putnam ETF Trust - Putnam BDC ETF - | 591,407 | 36.76 | 5,879 | 15.98 | ||||
| 2025-08-21 | NP | MOFTX - Mercer Opportunistic Fixed Income Fund Class I | 30,185 | 318 | ||||||
| 2025-07-30 | 13F | Sanders Morris Harris Llc | 18,375 | 0.00 | 194 | -4.46 | ||||
| 2025-07-18 | 13F | Generali Investments CEE, investicni spolecnost, a.s. | 26,672 | 0.00 | 281 | -4.42 | ||||
| 2025-07-28 | 13F | Mutual Advisors, LLC | 59,953 | 87.01 | 635 | 95.68 | ||||
| 2025-08-08 | 13F | Advyzon Investment Management, LLC | 11,937 | 126 | ||||||
| 2025-08-07 | 13F/A | Tortoise Investment Management, LLC | 0 | -100.00 | 0 | -100.00 | ||||
| 2025-07-14 | 13F | Bank & Trust Co | 422 | 0.00 | 4 | 0.00 | ||||
| 2025-08-14 | 13F | Verition Fund Management LLC | 29,132 | 138.65 | 307 | 129.10 | ||||
| 2025-05-20 | 13F/A | Colony Group, LLC | 0 | -100.00 | 0 | -100.00 | ||||
| 2025-08-13 | 13F | Lansforsakringar Fondforvaltning AB (publ) | 0 | -100.00 | 0 | |||||
| 2025-07-31 | 13F | Sumitomo Mitsui Trust Holdings, Inc. | 491,424 | 26.93 | 5,185 | 21.41 | ||||
| 2025-08-14 | 13F | Fayez Sarofim & Co | 30,272 | 0.00 | 319 | -4.20 | ||||
| 2025-08-14 | 13F | Van Eck Associates Corp | 2,474,794 | 7.81 | 26 | 4.00 | ||||
| 2025-07-09 | 13F | Shore Point Advisors, LLC | 0 | -100.00 | 0 | |||||
| 2025-08-15 | 13F | Morgan Stanley | 833,351 | -26.74 | 8,792 | -29.93 | ||||
| 2025-08-05 | 13F | Bank Of Montreal /can/ | 38,753 | -18.16 | 409 | -21.84 | ||||
| 2025-08-13 | 13F | Lido Advisors, LLC | 33,240 | 38.03 | 351 | 32.08 | ||||
| 2025-08-14 | 13F | Wells Fargo & Company/mn | 236,813 | 3.29 | 2,498 | -1.19 | ||||
| 2025-07-28 | 13F | BRYN MAWR TRUST Co | 14,000 | 0.00 | 148 | -4.55 | ||||
| 2025-07-22 | 13F | Rockingstone Advisors LLC | 201,652 | -26.51 | 2,127 | -29.71 | ||||
| 2025-08-06 | 13F | Fox Run Management, L.l.c. | 0 | -100.00 | 0 | |||||
| 2025-08-13 | 13F | Cerity Partners LLC | 2,769,051 | -19.77 | 29,213 | -23.26 | ||||
| 2025-07-30 | 13F | Privium Fund Management (UK) Ltd | 0 | -100.00 | 0 | |||||
| 2025-07-16 | 13F | Arlington Capital Management, Inc. | 89,799 | 947 | ||||||
| 2025-07-24 | NP | FNCMX - Fidelity Nasdaq Composite Index Fund This fund is a listed as child fund of Fmr Llc and if that institution has disclosed ownership in this security, then these positions will not be double counted when calculating total shares and total value | 53,270 | 0.00 | 574 | -7.58 | ||||
| 2025-08-14 | 13F | Brevan Howard Capital Management LP | 0 | -100.00 | 0 | |||||
| 2025-07-07 | 13F | Thurston, Springer, Miller, Herd & Titak, Inc. | 329 | 0.00 | 3 | 0.00 | ||||
| 2025-05-14 | 13F | Virtus ETF Advisers LLC | 0 | -100.00 | 0 | |||||
| 2025-07-18 | 13F | Chelsea Counsel Co | 340 | 0.00 | 4 | 0.00 | ||||
| 2025-08-06 | 13F | Commonwealth Equity Services, Llc | 93,571 | -5.72 | 1 | -100.00 | ||||
| 2025-08-13 | 13F | Quantbot Technologies LP | 18,859 | 199 | ||||||
| 2025-08-14 | 13F | Royal Bank Of Canada | 94,959 | 16.06 | 1,002 | 11.09 | ||||
| 2025-08-13 | 13F | Russell Investments Group, Ltd. | 52,644 | 0.00 | 555 | -4.31 | ||||
| 2025-08-14 | 13F | Susquehanna International Group, Llp | 20,421 | -67.80 | 215 | -69.24 | ||||
| 2025-08-15 | 13F | Tower Research Capital LLC (TRC) | 84 | 1 | ||||||
| 2025-06-26 | NP | LSVFX - LSV GLOBAL MANAGED VOLATILITY FUND Institutional Class Shares | 3,500 | 0.00 | 35 | -17.07 | ||||
| 2025-08-12 | 13F | MAI Capital Management | 5,336 | -26.85 | 56 | -30.00 | ||||
| 2025-07-31 | 13F | Oppenheimer & Co Inc | 33,661 | 0.11 | 355 | -4.05 | ||||
| 2025-08-07 | 13F | ProShare Advisors LLC | 18,790 | -5.30 | 198 | -9.17 | ||||
| 2025-08-08 | 13F | Larson Financial Group LLC | 10,967 | 0.06 | 116 | -4.17 | ||||
| 2025-05-12 | 13F | National Bank Of Canada /fi/ | 0 | -100.00 | 0 | -100.00 | ||||
| 2025-07-30 | 13F | Whittier Trust Co | 16,222 | -66.27 | 171 | -67.74 | ||||
| 2025-07-15 | 13F | Graypoint LLC | 10,271 | 108 | ||||||
| 2025-07-28 | NP | PEX - ProShares Global Listed Private Equity ETF | 20,089 | 1.25 | 216 | -6.49 | ||||
| 2025-08-11 | 13F | Dorsey & Whitney Trust CO LLC | 112,410 | -17.02 | 1,186 | -20.68 | ||||
| 2025-07-29 | NP | SLPAX - Siit Small Cap Fund - Class A | 38,800 | 93.03 | 418 | 78.21 | ||||
| 2025-08-13 | 13F | Wealthedge Investment Advisors, Llc | 139,893 | -8.49 | 1,476 | -12.51 | ||||
| 2025-05-13 | 13F | Caitong International Asset Management Co., Ltd | 0 | -100.00 | 0 | |||||
| 2025-07-18 | 13F | Union Bancaire Privee, UBP SA | 28,812 | 5.08 | 43,853 | 14,420.53 | ||||
| 2025-08-14 | 13F | Mercer Global Advisors Inc /adv | 10,698 | -67.80 | 113 | -69.40 | ||||
| 2025-08-08 | 13F | MTM Investment Management, LLC | 3,600 | 38 | ||||||
| 2025-07-28 | NP | KBWD - Invesco KBW High Dividend Yield Financial ETF This fund is a listed as child fund of Invesco Ltd. and if that institution has disclosed ownership in this security, then these positions will not be double counted when calculating total shares and total value | 1,018,482 | 8.45 | 10,969 | 0.26 | ||||
| 2025-08-14 | 13F | Ameriprise Financial Inc | 288,313 | 10.52 | 3,042 | 5.70 | ||||
| 2025-08-15 | 13F | Prevail Innovative Wealth Advisors, Llc | 182,461 | -5.11 | 1,925 | -9.25 | ||||
| 2025-07-31 | 13F | WFA Asset Management Corp | 39,882 | -1.54 | 488 | -4.87 | ||||
| 2025-07-28 | 13F | Harbour Investments, Inc. | 6,348 | 0.00 | 67 | -5.71 | ||||
| 2025-08-13 | 13F | Virtus Investment Advisers, Inc. | 87,901 | -10.28 | 927 | -14.17 | ||||
| 2025-08-12 | 13F | Proequities, Inc. | Put | 0 | 0 | |||||
| 2025-08-12 | 13F | Proequities, Inc. | Call | 0 | 0 | |||||
| 2025-08-12 | 13F | Proequities, Inc. | 0 | 0 | ||||||
| 2025-08-14 | 13F | Comerica Bank | 6,160 | 8.83 | 65 | 3.23 | ||||
| 2025-08-14 | 13F | Sei Investments Co | 30,317 | 12.76 | 320 | 7.77 | ||||
| 2025-08-11 | 13F | Lsv Asset Management | 2,763,256 | -0.03 | 29 | -3.33 | ||||
| 2025-08-28 | NP | SMVIX - Simt Small Cap Value Fund Class I | 10,331 | -43.44 | 109 | -46.27 | ||||
| 2025-05-16 | 13F | Dynamic Technology Lab Private Ltd | 0 | -100.00 | 0 | |||||
| 2025-08-08 | 13F | Alberta Investment Management Corp | 0 | -100.00 | 0 | |||||
| 2025-08-14 | 13F | Bramshill Investments, LLC | 0 | -100.00 | 0 | |||||
| 2025-08-13 | 13F | Northern Trust Corp | 63,596 | 150.60 | 671 | 140.14 | ||||
| 2025-08-11 | 13F | NewEdge Wealth, LLC | 30,000 | 0.00 | 306 | -7.27 | ||||
| 2025-08-14 | 13F | Glenview Trust Co | 10,100 | 107 | ||||||
| 2025-08-14 | 13F | Palisade Capital Management Llc/nj | 494,413 | -28.12 | 5,216 | -31.25 | ||||
| 2025-08-11 | 13F | Pin Oak Investment Advisors Inc | 0 | 0 | ||||||
| 2025-08-14 | 13F | Tudor Investment Corp Et Al | 33,098 | 349 | ||||||
| 2025-07-25 | 13F | Atria Wealth Solutions, Inc. | 0 | -100.00 | 0 | |||||
| 2025-07-25 | NP | First Trust Specialty Finance & Financial Opportunities Fund This fund is a listed as child fund of First Trust Advisors Lp and if that institution has disclosed ownership in this security, then these positions will not be double counted when calculating total shares and total value | 283,000 | -19.83 | 3,048 | -25.90 | ||||
| 2025-08-14 | 13F | Raymond James Financial Inc | 76,053 | -3.85 | 802 | -8.03 | ||||
| 2025-08-11 | 13F | HighTower Advisors, LLC | 493,699 | -64.91 | 5,209 | -66.44 | ||||
| 2025-08-08 | 13F | Cetera Investment Advisers | 35,164 | 45.63 | 371 | 39.10 | ||||
| 2025-08-11 | 13F | Nomura Asset Management Co Ltd | 0 | -100.00 | 0 | |||||
| 2025-07-25 | 13F | Tranquility Partners, LLC | 232,087 | 92.65 | 2,449 | 84.34 | ||||
| 2025-08-14 | 13F | Citadel Advisors Llc | Call | 25,300 | 2.85 | 267 | -1.85 | |||
| 2025-05-15 | 13F | CAPROCK Group, Inc. | 0 | -100.00 | 0 | |||||
| 2025-08-12 | 13F | CIBC Private Wealth Group, LLC | 7,235 | -63.51 | 76 | -57.78 | ||||
| 2025-08-14 | 13F | Citadel Advisors Llc | Put | 17,000 | -14.14 | 179 | -17.89 | |||
| 2025-07-28 | 13F | Naviter Wealth, LLC | 205,757 | 4.09 | 2,171 | -3.60 | ||||
| 2025-08-12 | 13F | Entropy Technologies, LP | 0 | -100.00 | 0 | |||||
| 2025-08-12 | 13F | Legal & General Group Plc | 708,066 | -1.33 | 7,477 | -5.53 | ||||
| 2025-08-14 | 13F | Susquehanna International Group, Llp | Call | 0 | -100.00 | 0 | ||||
| 2025-05-30 | NP | ERNZ - TrueShares Active Yield ETF | 0 | -100.00 | 0 | -100.00 | ||||
| 2025-08-13 | 13F | PharVision Advisers, LLC | 35,877 | 41.01 | 379 | 35.00 | ||||
| 2025-08-14 | 13F | BI Asset Management Fondsmaeglerselskab A/S | 200,607 | 0.00 | 2 | 0.00 | ||||
| 2025-08-14 | 13F | Schonfeld Strategic Advisors LLC | 0 | -100.00 | 0 | |||||
| 2025-08-07 | 13F | Allworth Financial LP | 46 | 0.00 | 0 | |||||
| 2025-08-13 | 13F | ExodusPoint Capital Management, LP | 0 | -100.00 | 0 | |||||
| 2025-07-30 | 13F | Denali Advisors Llc | 115,826 | -2.64 | 1,222 | -6.94 | ||||
| 2025-08-05 | 13F | Huntington National Bank | 4,534 | 311.81 | 48 | 291.67 | ||||
| 2025-08-14 | 13F | Williams Jones Wealth Management, LLC. | 14,000 | 0.00 | 148 | -4.55 | ||||
| 2025-08-27 | 13F/A | Squarepoint Ops LLC | 0 | -100.00 | 0 | -100.00 | ||||
| 2025-08-25 | 13F/A | Neuberger Berman Group LLC | 117,518 | -1.38 | 1,240 | -5.71 | ||||
| 2025-07-29 | NP | SVYAX - SIIT U.S. Managed Volatility Fund - Class A | 165,747 | 1,785 | ||||||
| 2025-08-08 | 13F | Condor Capital Management | 13,731 | 0.01 | 145 | -4.64 | ||||
| 2025-08-14 | 13F | Macquarie Group Ltd | 95,300 | 0.00 | 1,005 | -4.38 | ||||
| 2025-07-28 | NP | VSSVX - Small Cap Special Values Fund | 45,862 | -48.86 | 494 | -52.78 | ||||
| 2025-06-26 | NP | LSVQX - LSV Small Cap Value Fund Institutional Class Shares | 253,300 | 124.56 | 2,518 | 90.39 | ||||
| 2025-08-07 | 13F | Hennion & Walsh Asset Management, Inc. | 410,143 | 30.86 | 4,327 | 25.17 | ||||
| 2025-04-21 | 13F | Stableford Capital Ii Llc | 0 | -100.00 | 0 | |||||
| 2025-08-13 | 13F | Natixis | 42,216 | 0.00 | 449 | -3.66 | ||||
| 2025-08-14 | 13F | Two Sigma Advisers, Lp | 1,054,100 | -3.75 | 11,121 | -7.95 | ||||
| 2025-08-12 | 13F | BlackRock, Inc. | 604,788 | 43.95 | 6,381 | 37.68 | ||||
| 2025-08-11 | 13F | Elequin Capital Lp | 3 | 0 | ||||||
| 2025-08-14 | 13F | Millennium Management Llc | 402,565 | -43.38 | 4,247 | -45.84 | ||||
| 2025-07-18 | 13F | Truist Financial Corp | 15,791 | 167 | ||||||
| 2025-08-05 | 13F | Simplex Trading, Llc | 0 | -100.00 | 0 | |||||
| 2025-08-13 | 13F | Jump Financial, LLC | 20,552 | 217 | ||||||
| 2025-07-10 | 13F | Wealth Enhancement Advisory Services, Llc | 40,645 | 1.01 | 435 | -2.03 | ||||
| 2025-07-18 | 13F | PFG Investments, LLC | 31,723 | -6.34 | 335 | -10.46 | ||||
| 2025-08-07 | 13F | Connor, Clark & Lunn Investment Management Ltd. | 0 | -100.00 | 0 | |||||
| 2025-08-07 | 13F | Vise Technologies, Inc. | 15,771 | -4.38 | 166 | -10.27 | ||||
| 2025-08-15 | 13F | Zuckerman Investment Group, LLC | 15,000 | 158 | ||||||
| 2025-08-14 | 13F | Stifel Financial Corp | 43,608 | -6.06 | 460 | -10.16 | ||||
| 2025-08-15 | 13F | Caxton Associates Llp | 40,695 | 429 | ||||||
| 2025-08-13 | 13F | Everstar Asset Management, LLC | 65,578 | 9.75 | 692 | 4.86 | ||||
| 2025-08-21 | NP | BIZD - VanEck Vectors BDC Income ETF | 2,199,080 | 2.85 | 23,200 | -1.62 | ||||
| 2025-08-14 | 13F | Arete Wealth Advisors, LLC | 10,096 | 0 | ||||||
| 2025-05-15 | 13F | Centiva Capital, LP | 0 | -100.00 | 0 | -100.00 | ||||
| 2025-08-27 | NP | OASVX - Optimum Small-mid Cap Value Fund Class A | 95,300 | 0.00 | 1,005 | -4.38 | ||||
| 2025-08-12 | 13F | Verity & Verity, LLC | 10,000 | 0.00 | 106 | -4.55 | ||||
| 2025-08-05 | 13F | Simplex Trading, Llc | Put | 2,000 | 900.00 | 0 | ||||
| 2025-08-14 | 13F | Ubs Asset Management Americas Inc | 1,306 | -97.13 | 14 | -97.41 | ||||
| 2025-07-29 | NP | SGMAX - SIIT Global Managed Volatility Fund Class A | 6,644 | 1,594.90 | 72 | 1,675.00 | ||||
| 2025-08-13 | 13F | Epoch Investment Partners, Inc. | 73,315 | 0.00 | 773 | -4.33 | ||||
| 2025-08-14 | 13F | D. E. Shaw & Co., Inc. | 15,507 | 17.24 | 164 | 12.41 | ||||
| 2025-06-27 | NP | LBO - WHITEWOLF Publicly Listed Private Equity ETF | 6,864 | 14.29 | 68 | -2.86 | ||||
| 2025-08-07 | 13F | Acadian Asset Management Llc | 345,926 | 266.72 | 4 | 200.00 | ||||
| 2025-08-07 | 13F | Campbell & CO Investment Adviser LLC | 15,998 | 169 | ||||||
| 2025-08-21 | NP | MSCQX - Mercer US Small/Mid Cap Equity Fund Class I | 199,800 | 0.00 | 2,108 | -4.36 | ||||
| 2025-05-23 | NP | LSPAX - LoCorr Spectrum Income Fund Class A | 71,919 | 0.00 | 793 | -1.98 | ||||
| 2025-08-14 | 13F | Hrt Financial Lp | 82,335 | 1 | ||||||
| 2025-08-12 | 13F | Advisors Asset Management, Inc. | 215,999 | -13.02 | 2,279 | -16.83 | ||||
| 2025-08-11 | 13F | Universal- Beteiligungs- und Servicegesellschaft mbH | 209,500 | 0.00 | 2,210 | -4.33 | ||||
| 2025-08-12 | 13F | Jpmorgan Chase & Co | 1,232,203 | -0.68 | 13,000 | -5.00 | ||||
| 2025-08-14 | 13F | Chilton Investment Co Llc | 70,520 | 0.00 | 744 | -4.38 | ||||
| 2025-08-04 | 13F | Spire Wealth Management | 39,200 | 3.98 | 414 | -0.48 | ||||
| 2025-08-14 | 13F | Aquatic Capital Management LLC | 0 | -100.00 | 0 | |||||
| 2025-08-04 | 13F | Bay Colony Advisory Group, Inc d/b/a Bay Colony Advisors | 11,918 | 126 | ||||||
| 2025-07-29 | NP | ISMD - Inspire Small/Mid Cap Impact ETF | 32,099 | -4.08 | 346 | -11.31 | ||||
| 2025-06-25 | NP | VPC - Virtus Private Credit Strategy ETF | 89,491 | -0.90 | 890 | -15.97 | ||||
| 2025-08-12 | 13F | Trexquant Investment LP | 303,295 | 4.00 | 3,200 | -0.53 | ||||
| 2025-08-15 | 13F | WealthCollab, LLC | 1,761 | 19 | ||||||
| 2025-08-15 | 13F | Kestra Advisory Services, LLC | 48,609 | -23.03 | 513 | -26.44 | ||||
| 2025-07-24 | 13F | CWM Advisors, LLC | 36,844 | 17.73 | 389 | 12.46 | ||||
| 2025-08-14 | 13F | Cubist Systematic Strategies, LLC | 36,643 | 387 | ||||||
| 2025-07-09 | 13F | Key Client Fiduciary Advisors, LLC | 39,940 | -14.74 | 421 | -18.41 | ||||
| 2025-08-06 | 13F | Wedbush Securities Inc | 17,525 | 0.00 | 0 | |||||
| 2025-08-13 | 13F | Navis Wealth Advisors, LLC | 0 | -100.00 | 0 | |||||
| 2025-07-11 | 13F | Farther Finance Advisors, LLC | 48,144 | 2.90 | 508 | -2.12 | ||||
| 2025-07-24 | 13F | Reuter James Wealth Management, Llc | 34,299 | 0.00 | 362 | -4.50 | ||||
| 2025-08-14 | 13F | Bank Of America Corp /de/ | 157,788 | -67.94 | 1,665 | -69.34 | ||||
| 2025-08-11 | 13F | Midwest Professional Planners, LTD. | 150,065 | 3.25 | 1,583 | -1.25 | ||||
| 2025-08-01 | 13F | First National Trust Co | 0 | -100.00 | 0 | |||||
| 2025-08-08 | 13F | Atlantic Trust, LLC | 8,943 | 2.86 | 94 | -1.05 | ||||
| 2025-06-30 | NP | PSP - Invesco Global Listed Private Equity ETF This fund is a listed as child fund of Invesco Ltd. and if that institution has disclosed ownership in this security, then these positions will not be double counted when calculating total shares and total value | 53,482 | -15.63 | 532 | -28.44 | ||||
| 2025-07-25 | 13F | Allspring Global Investments Holdings, LLC | 0 | -100.00 | 0 | |||||
| 2025-07-24 | 13F | IFP Advisors, Inc | 297 | 0.00 | 3 | 0.00 | ||||
| 2025-04-22 | 13F | TrueMark Investments, LLC | 0 | -100.00 | 0 | |||||
| 2025-08-14 | 13F | Citadel Advisors Llc | 0 | -100.00 | 0 | |||||
| 2025-05-14 | 13F | Boston Private Wealth Llc | 0 | -100.00 | 0 | |||||
| 2025-07-22 | 13F | Merit Financial Group, LLC | 143,499 | -44.93 | 1,514 | -47.36 | ||||
| 2025-07-17 | 13F | GraniteShares Advisors LLC | 248,003 | 6.67 | 2,616 | 2.03 | ||||
| 2025-08-12 | 13F | Virtu Financial LLC | 0 | -100.00 | 0 | |||||
| 2025-05-14 | 13F | CI Private Wealth, LLC | 0 | -100.00 | 0 | -100.00 | ||||
| 2025-08-15 | 13F | Captrust Financial Advisors | 51,713 | -56.18 | 546 | -58.11 | ||||
| 2025-08-13 | 13F | Brown Advisory Inc | 10,000 | 0.00 | 106 | -4.55 | ||||
| 2025-08-14 | 13F | GWM Advisors LLC | 2,045 | -1.06 | 22 | -4.55 | ||||
| 2025-05-14 | 13F | Bnp Paribas Arbitrage, Sa | 0 | -100.00 | 0 | |||||
| 2025-04-30 | 13F | Synergy Investment Management, LLC | 0 | -100.00 | 0 | |||||
| 2025-08-14 | 13F | Quarry LP | 11,846 | 46.34 | 125 | 39.33 | ||||
| 2025-08-01 | 13F | Envestnet Asset Management Inc | 45,545 | -24.52 | 480 | -27.82 | ||||
| 2025-09-04 | 13F/A | Advisor Group Holdings, Inc. | 394,174 | 7.84 | 4,159 | 3.13 | ||||
| 2025-08-01 | 13F | Transcend Wealth Collective, Llc | 714,104 | 68.51 | 7,534 | 61.17 | ||||
| 2025-08-08 | 13F | Empower Advisory Group, LLC | 22,206 | -0.85 | 234 | -5.26 | ||||
| 2025-08-13 | 13F | Northwestern Mutual Wealth Management Co | 0 | -100.00 | 0 | |||||
| 2025-08-14 | 13F | UBS Group AG | 1,254,591 | 42.55 | 13,236 | 36.34 | ||||
| 2025-08-14 | 13F | Ares Management Llc | 596,371 | 5.33 | 6,292 | 0.74 | ||||
| 2025-08-14 | 13F | Goldman Sachs Group Inc | 28,425 | 19.43 | 300 | 14.12 | ||||
| 2025-07-31 | 13F | MQS Management LLC | 21,633 | -53.28 | 228 | -55.29 | ||||
| 2025-08-11 | 13F | Rothschild Investment Llc | 19,000 | -2.66 | 200 | -6.98 | ||||
| 2025-08-14 | 13F | Dimension Capital Management Llc | 950,072 | 17.01 | 10,023 | 11.93 | ||||
| 2025-08-01 | 13F | Y-Intercept (Hong Kong) Ltd | 14,772 | -74.13 | 156 | -75.36 | ||||
| 2025-07-31 | 13F | Whipplewood Advisors, LLC | 118 | 81.54 | 1 | 0.00 | ||||
| 2025-07-21 | 13F | Catalina Capital Group, LLC | 19,358 | 204 | ||||||
| 2025-08-28 | NP | SVOAX - Simt Us Managed Volatility Fund Class F | 115,052 | 1,214 | ||||||
| 2025-08-11 | 13F | EMC Capital Management | 13,906 | -24.71 | 0 | |||||
| 2025-08-13 | 13F | Invesco Ltd. | 1,029,661 | -5.66 | 10,863 | -9.77 | ||||
| 2025-05-27 | NP | Brighthouse Funds Trust I - Brighthouse Small Cap Value Portfolio Class A | 193,274 | -1.88 | 2,132 | -3.88 | ||||
| 2025-04-23 | 13F | New World Advisors LLC | 0 | -100.00 | 0 | |||||
| 2025-08-12 | 13F | LPL Financial LLC | 191,338 | 3.97 | 2,019 | -0.54 | ||||
| 2025-08-06 | 13F | First Horizon Advisors, Inc. | 1,000 | 0.00 | 11 | -9.09 | ||||
| 2025-08-14 | 13F | Balyasny Asset Management Llc | 0 | -100.00 | 0 | |||||
| 2025-08-14 | 13F | Kovitz Investment Group Partners, LLC | 188,477 | 1,988 | ||||||
| 2025-04-21 | 13F | Nelson, Van Denburg & Campbell Wealth Management Group, LLC | 0 | -100.00 | 0 | |||||
| 2025-08-05 | 13F | Next Capital Management LLC | 26,150 | 276 | ||||||
| 2025-08-06 | 13F | AE Wealth Management LLC | 10,900 | 0.51 | 115 | -4.20 | ||||
| 2025-05-14 | 13F | Group One Trading, L.p. | Call | 0 | -100.00 | 0 | -100.00 | |||
| 2025-08-13 | 13F | Barclays Plc | 0 | -100.00 | 0 | |||||
| 2025-08-11 | 13F | TD Waterhouse Canada Inc. | 0 | -100.00 | 0 | |||||
| 2025-08-14 | 13F | Qube Research & Technologies Ltd | 48,060 | -50.44 | 507 | -52.57 | ||||
| 2025-08-18 | 13F | Geneos Wealth Management Inc. | 2,854 | 35.65 | 30 | 30.43 | ||||
| 2025-08-29 | NP | GraniteShares ETF Trust - GraniteShares HIPS US High Income ETF | 248,003 | 6.67 | 2,616 | 2.03 | ||||
| 2025-08-08 | 13F | Creative Planning | 13,709 | 0.16 | 145 | -4.00 | ||||
| 2025-08-15 | 13F | Great West Life Assurance Co /can/ | 95,805 | 2.83 | 1 | 0.00 | ||||
| 2025-08-14 | 13F | Two Sigma Investments, Lp | 747,973 | -1.59 | 7,891 | -5.87 |