Mga Batayang Estadistika
| Pemilik Institusional | 242 total, 239 long only, 0 short only, 3 long/short - change of 5.68% MRQ |
| Alokasi Portofolio Rata-rata | 0.0575 % - change of 9.63% MRQ |
| Saham Institusional (Jangka Panjang) | 74,875,890 (ex 13D/G) - change of 0.50MM shares 0.67% MRQ |
| Nilai Institusional (Jangka Panjang) | $ 479,945 USD ($1000) |
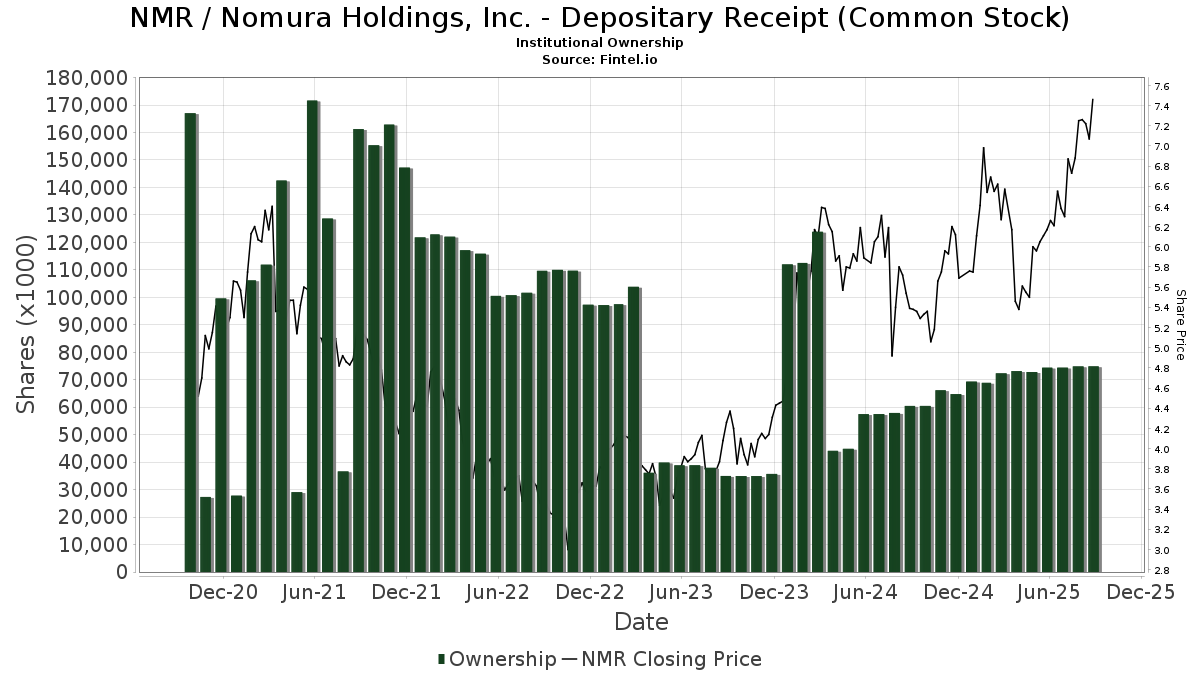
Kepemilikan Institusional dan Pemegang Saham
Nomura Holdings, Inc. - Depositary Receipt (Common Stock) (US:NMR) memiliki 242 pemilik institusional dan pemegang saham yang telah mengajukan formulir 13D/G atau 13F kepada Komisi Bursa Efek (Securities Exchange Commission/SEC). Lembaga-lembaga ini memegang total 74,875,890 saham. Pemegang saham terbesar meliputi Donald Smith & Co., Inc., Fisher Asset Management, LLC, Morgan Stanley, VASVX - Vanguard Selected Value Fund Investor Shares, Goldman Sachs Group Inc, BlackRock, Inc., Dimensional Fund Advisors Lp, Northern Trust Corp, Renaissance Technologies Llc, and Fmr Llc .
Struktur kepemilikan institusional Nomura Holdings, Inc. - Depositary Receipt (Common Stock) (NYSE:NMR) menunjukkan posisi terkini di perusahaan oleh institusi dan dana, serta perubahan terbaru dalam ukuran posisi. Pemegang saham utama dapat mencakup investor individu, reksa dana, dana lindung nilai, atau institusi. Jadwal 13D menunjukkan bahwa investor memegang (atau pernah memegang) lebih dari 5% saham perusahaan dan bermaksud (atau pernah bermaksud) untuk secara aktif mengejar perubahan strategi bisnis. Jadwal 13G menunjukkan investasi pasif lebih dari 5%.
The share price as of September 5, 2025 is 7.20 / share. Previously, on September 9, 2024, the share price was 5.55 / share. This represents an increase of 29.73% over that period.
Skor Sentimen Dana
Skor Sentimen Dana (sebelumnya dikenal sebagai Skor Akumulasi Kepemilikan) menemukan saham-saham yang paling banyak dibeli oleh dana. Ini adalah hasil dari model kuantitatif multi-faktor yang canggih yang mengidentifikasi perusahaan dengan tingkat akumulasi institusional tertinggi. Model penilaian menggunakan kombinasi dari total peningkatan pemilik yang diungkapkan, perubahan dalam alokasi portofolio pada pemilik tersebut, dan metrik lainnya. Angka berkisar dari 0 hingga 100, dengan angka yang lebih tinggi menunjukkan tingkat akumulasi yang lebih tinggi dibandingkan dengan perusahaan sejenisnya, dan 50 adalah rata-ratanya.
Frekuensi Pembaruan: Setiap Hari
Lihat Ownership Explorer, yang menyediakan daftar perusahaan dengan peringkat tertinggi.
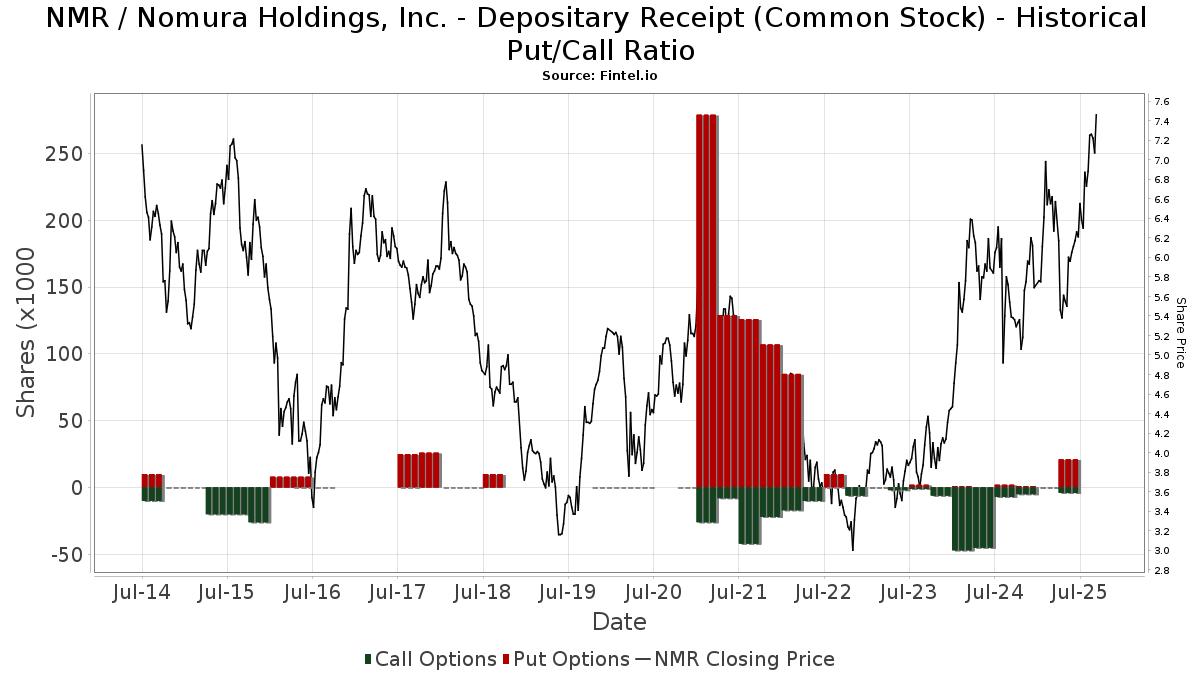
Rasio Put/Call Institusional
Selain melaporkan isu ekuitas dan utang standar, institusi dengan aset di bawah manajemen lebih dari 100 juta dolar AS juga harus mengungkapkan kepemilikan opsi put dan call mereka. Karena opsi put umumnya menunjukkan sentimen negatif, dan opsi call menunjukkan sentimen positif, kita dapat mengetahui sentimen institusional secara keseluruhan dengan memplot rasio put terhadap call. Grafik di sebelah kanan memplot rasio put/call historis untuk instrumen ini.
Menggunakan Rasio Put/Call sebagai indikator sentimen investor mengatasi salah satu kekurangan utama dari penggunaan total kepemilikan institusional, yaitu sejumlah besar aset yang dikelola diinvestasikan secara pasif untuk melacak indeks. Dana yang dikelola secara pasif biasanya tidak membeli opsi, sehingga indikator rasio put/call lebih akurat dalam melacak sentimen dana yang dikelola secara aktif.
Pengajuan 13F dan NPORT
Detail pada pengajuan 13F tersedia gratis. Detail pada pengajuan NP memerlukan keanggotaan premium. Baris berwarna hijau menunjukkan posisi baru. Baris berwarna merah menunjukkan posisi yang sudah ditutup. Klik tautan ini ikon untuk melihat riwayat transaksi selengkapnya.
Tingkatkan
untuk membuka data premium dan mengekspor ke Excel ![]() .
.
| Tanggal File | Sumber | Investor | Ketik | Presyo ng Avg (Silangan) |
Saham | Δ Saham (%) |
Dilaporkan Nilai ($1000) |
Nilai Δ (%) |
Alokasi Port (%) |
|
|---|---|---|---|---|---|---|---|---|---|---|
| 2025-08-12 | 13F | Pathstone Holdings, LLC | 228,696 | -3.28 | 1,505 | 3.44 | ||||
| 2025-07-23 | 13F | DMG Group, LLC | 61,317 | -4.13 | 403 | 2.54 | ||||
| 2025-07-16 | 13F | Formidable Asset Management, LLC | 62,900 | 414 | ||||||
| 2025-08-15 | 13F | Tower Research Capital LLC (TRC) | 1,047 | 7 | ||||||
| 2025-05-15 | 13F | Point72 Asset Management, L.P. | 0 | -100.00 | 0 | |||||
| 2025-08-14 | 13F | Optiver Holding B.V. | 0 | -100.00 | 0 | |||||
| 2025-08-14 | 13F | Mariner, LLC | 300,400 | 14.40 | 1,977 | 22.35 | ||||
| 2025-08-14 | 13F | Wells Fargo & Company/mn | 63,940 | 67.10 | 421 | 78.72 | ||||
| 2025-08-11 | 13F | Cornerstone Planning Group LLC | 849 | 71.17 | 6 | 150.00 | ||||
| 2025-08-13 | 13F | Flow Traders U.s. Llc | 11,445 | 0 | ||||||
| 2025-08-12 | 13F | Manchester Capital Management LLC | 144 | 1 | ||||||
| 2025-08-08 | 13F | Crossmark Global Holdings, Inc. | 217,354 | -0.01 | 1,430 | 7.04 | ||||
| 2025-08-14 | 13F | Boston Private Wealth Llc | 0 | -100.00 | 0 | |||||
| 2025-06-26 | NP | DFA INVESTMENT DIMENSIONS GROUP INC - World ex U.S. Core Equity Portfolio Institutional Class Shares | 9,532 | -53.16 | 53 | -60.31 | ||||
| 2025-07-16 | 13F | Five Oceans Advisors | 13,507 | -9.40 | 89 | -3.30 | ||||
| 2025-08-01 | 13F | Envestnet Asset Management Inc | 34,913 | 6.02 | 230 | 13.37 | ||||
| 2025-08-08 | 13F | Abc Arbitrage Sa | 117,412 | -60.55 | 773 | -57.81 | ||||
| 2025-08-13 | 13F | Russell Investments Group, Ltd. | 91,559 | 23.67 | 602 | 32.31 | ||||
| 2025-08-14 | 13F | Peak6 Llc | Put | 17,800 | 117 | |||||
| 2025-07-08 | 13F | Parallel Advisors, LLC | 21,002 | -16.69 | 138 | -10.97 | ||||
| 2025-08-12 | 13F | Charles Schwab Investment Management Inc | 526,853 | 13.88 | 3,467 | 21.83 | ||||
| 2025-08-14 | 13F | Peak6 Llc | 1,371 | 9 | ||||||
| 2025-08-13 | 13F | Baird Financial Group, Inc. | 0 | -100.00 | 0 | |||||
| 2025-05-15 | 13F | Engineers Gate Manager LP | 0 | -100.00 | 0 | |||||
| 2025-07-25 | 13F | JustInvest LLC | 431,978 | 5.96 | 2,842 | 13.36 | ||||
| 2025-08-13 | 13F | Rsm Us Wealth Management Llc | 32,353 | -18.57 | 213 | -13.11 | ||||
| 2025-07-16 | 13F | Highline Wealth Partners Llc | 319 | 0.00 | 2 | 100.00 | ||||
| 2025-08-13 | 13F | Marshall Wace, Llp | 111,987 | -55.29 | 737 | -52.21 | ||||
| 2025-08-04 | 13F | Hantz Financial Services, Inc. | 8,906 | 828.68 | 0 | |||||
| 2025-08-01 | 13F | SYM FINANCIAL Corp | 14,039 | -13.56 | 92 | -7.07 | ||||
| 2025-07-24 | 13F | PDS Planning, Inc | 35,580 | -9.67 | 234 | -3.31 | ||||
| 2025-08-12 | 13F | O'shaughnessy Asset Management, Llc | 161,568 | 60.55 | 1,063 | 72.01 | ||||
| 2025-05-15 | 13F | Two Sigma Investments, Lp | 0 | -100.00 | 0 | |||||
| 2025-07-18 | 13F | Generali Investments CEE, investicni spolecnost, a.s. | 39,500 | 0.00 | 260 | 7.02 | ||||
| 2025-07-15 | 13F | Ballentine Partners, LLC | 61,361 | -16.33 | 404 | -10.64 | ||||
| 2025-08-19 | 13F | Cape Investment Advisory, Inc. | 865 | 36.44 | 6 | 66.67 | ||||
| 2025-07-17 | 13F | Albion Financial Group /ut | 0 | -100.00 | 0 | |||||
| 2025-08-08 | 13F | Creative Planning | 365,734 | -30.44 | 2,407 | -25.58 | ||||
| 2025-06-26 | NP | DFALX - Large Cap International Portfolio - Institutional Class This fund is a listed as child fund of Dimensional Fund Advisors Lp and if that institution has disclosed ownership in this security, then these positions will not be double counted when calculating total shares and total value | 247,991 | -17.36 | 1,376 | -29.22 | ||||
| 2025-08-12 | 13F | Coldstream Capital Management Inc | 74,327 | 973.16 | 489 | 1,064.29 | ||||
| 2025-07-08 | 13F | Gallacher Capital Management LLC | 77,802 | 5.91 | 512 | 13.30 | ||||
| 2025-08-14 | 13F/A | Skopos Labs, Inc. | 11,589 | 260.24 | 76 | 300.00 | ||||
| 2025-07-30 | 13F | Eqis Capital Management, Inc. | 91,643 | -0.75 | 603 | 6.35 | ||||
| 2025-08-12 | 13F | AlphaCore Capital LLC | 23,584 | 155 | ||||||
| 2025-08-05 | 13F | Bank of New York Mellon Corp | 230,623 | -2.25 | 1,518 | 4.62 | ||||
| 2025-08-06 | NP | LINCOLN VARIABLE INSURANCE PRODUCTS TRUST - LVIP Dimensional International Core Equity Fund Standard Class | 13,054 | 0.00 | 86 | 6.25 | ||||
| 2025-08-11 | 13F | Hexagon Capital Partners LLC | 0 | -100.00 | 0 | |||||
| 2025-08-14 | 13F | Bank Of America Corp /de/ | 288,582 | 13.42 | 1,899 | 21.36 | ||||
| 2025-07-21 | 13F | Successful Portfolios LLC | 15,000 | 0.00 | 99 | 6.52 | ||||
| 2025-04-22 | 13F | Mendota Financial Group, LLC | 0 | -100.00 | 0 | |||||
| 2025-07-23 | 13F | Venturi Wealth Management, LLC | 19,733 | 130 | ||||||
| 2025-08-14 | 13F | ICONIQ Capital, LLC | 23,354 | -45.21 | 154 | -31.39 | ||||
| 2025-07-23 | 13F | Optas, LLC | 31,952 | 2.48 | 210 | 9.95 | ||||
| 2025-08-14 | 13F | GWM Advisors LLC | 154 | 0.00 | 1 | |||||
| 2025-05-15 | 13F | Old Mission Capital Llc | 0 | -100.00 | 0 | -100.00 | ||||
| 2025-08-05 | 13F | Ellevest, Inc. | 62,702 | -10.98 | 413 | -4.85 | ||||
| 2025-07-10 | 13F | Baader Bank INC | 0 | -100.00 | 0 | |||||
| 2025-08-11 | 13F | Citigroup Inc | 20,386 | -13.14 | 134 | -6.94 | ||||
| 2025-08-13 | 13F | Centiva Capital, LP | 22,086 | -11.42 | 145 | -5.23 | ||||
| 2025-08-14 | 13F | Toronto Dominion Bank | 340,000 | 277.78 | 2,237 | 304.52 | ||||
| 2025-08-08 | 13F | Campbell Deegan Wealth Management, LLC | 0 | -100.00 | 0 | |||||
| 2025-08-12 | 13F | Franklin Resources Inc | 36,669 | -1.72 | 241 | 5.24 | ||||
| 2025-08-06 | 13F | Vestmark Advisory Solutions, Inc. | 39,372 | 259 | ||||||
| 2025-08-11 | 13F | Rothschild Investment Llc | 4,549 | -15.32 | 30 | -12.12 | ||||
| 2025-08-05 | 13F | South Dakota Investment Council | 36,300 | 0.00 | 0 | |||||
| 2025-08-13 | 13F | EverSource Wealth Advisors, LLC | 23,936 | 47.73 | 157 | 58.59 | ||||
| 2025-08-06 | 13F | Savant Capital, LLC | 23,810 | 97.10 | 157 | 110.81 | ||||
| 2025-08-13 | 13F | New York State Common Retirement Fund | 0 | -100.00 | 0 | |||||
| 2025-08-14 | 13F | Verition Fund Management LLC | 97,846 | 317.90 | 644 | 349.65 | ||||
| 2025-08-13 | 13F | Lido Advisors, LLC | 15,476 | -0.73 | 102 | 6.32 | ||||
| 2025-08-06 | 13F | First Horizon Advisors, Inc. | 0 | -100.00 | 0 | |||||
| 2025-07-31 | 13F | Carrera Capital Advisors | 730,716 | 109.09 | 4,808 | 123.73 | ||||
| 2025-07-07 | 13F | Versant Capital Management, Inc | 52,973 | 12.14 | 349 | 20.00 | ||||
| 2025-08-27 | NP | JNL SERIES TRUST - JNL/DFA International Core Equity Fund (I) | 3,800 | 0.00 | 25 | 8.70 | ||||
| 2025-08-14 | 13F | Group One Trading, L.p. | Call | 400 | 0.00 | 3 | 0.00 | |||
| 2025-08-13 | 13F | Cerity Partners LLC | 297,480 | -9.64 | 1,957 | -3.31 | ||||
| 2025-08-14 | 13F | XY Capital Ltd | 0 | -100.00 | 0 | |||||
| 2025-06-26 | NP | DFSI - Dimensional International Sustainability Core 1 ETF | 35,600 | 0.00 | 198 | -14.35 | ||||
| 2025-05-01 | 13F | Schechter Investment Advisors, LLC | 20,702 | -30.35 | 127 | -26.16 | ||||
| 2025-08-14 | 13F | Aqr Capital Management Llc | 325,555 | 12.44 | 2,142 | 20.34 | ||||
| 2025-08-07 | 13F | Sierra Ocean, Llc | 1,918 | -2.94 | 13 | 0.00 | ||||
| 2025-08-14 | 13F | Group One Trading, L.p. | Put | 1,900 | 13 | |||||
| 2025-08-14 | 13F | Aquatic Capital Management LLC | 70,237 | 833.63 | 462 | 904.35 | ||||
| 2025-08-14 | 13F | Evergreen Capital Management Llc | 44,470 | -5.74 | 293 | 0.69 | ||||
| 2025-07-22 | 13F | Valeo Financial Advisors, LLC | 13,663 | -0.52 | 90 | 5.95 | ||||
| 2025-07-28 | 13F | Private Wealth Asset Management, LLC | 145 | 0.00 | 1 | |||||
| 2025-07-28 | 13F | Rosenberg Matthew Hamilton | 2,777 | 0.00 | 18 | 5.88 | ||||
| 2025-08-11 | 13F | United Capital Financial Advisers, Llc | 44,526 | -15.81 | 293 | -10.15 | ||||
| 2025-08-12 | 13F | Pacer Advisors, Inc. | 0 | -100.00 | 0 | |||||
| 2025-08-14 | 13F | Group One Trading, L.p. | 0 | -100.00 | 0 | |||||
| 2025-08-14 | 13F | Glenmede Investment Management, LP | 26,688 | 176 | ||||||
| 2025-05-15 | 13F | Graham Capital Management, L.P. | 0 | -100.00 | 0 | |||||
| 2025-07-25 | 13F | Allspring Global Investments Holdings, LLC | 48,181 | -12.31 | 316 | -6.25 | ||||
| 2025-07-18 | 13F | BSW Wealth Partners | 77,363 | -2.52 | 509 | 4.30 | ||||
| 2025-05-15 | 13F | Citadel Advisors Llc | 0 | -100.00 | 0 | |||||
| 2025-03-27 | NP | PTIN - Pacer Trendpilot International ETF | 24,739 | 0.16 | 160 | 5.26 | ||||
| 2025-07-09 | 13F | Sivia Capital Partners, LLC | 19,272 | 35.60 | 127 | 44.83 | ||||
| 2025-08-14 | 13F | Principia Wealth Advisory, LLC | 114 | 1 | ||||||
| 2025-07-25 | 13F | Stephens Consulting, LLC | 518 | 3 | ||||||
| 2025-07-29 | NP | GINX - SGI Enhanced Global Income ETF | 94,534 | 8.06 | 576 | 2.13 | ||||
| 2025-08-14 | 13F | Mangrove Partners | 118,858 | 782 | ||||||
| 2025-05-02 | 13F | Cable Hill Partners, LLC | 68,215 | -2.56 | 379 | -6.67 | ||||
| 2025-07-14 | 13F | U.S. Capital Wealth Advisors, LLC | 11,918 | 78 | ||||||
| 2025-08-13 | 13F/A | StoneX Group Inc. | 11,246 | 72 | ||||||
| 2025-08-13 | 13F | Arrowstreet Capital, Limited Partnership | 1,731,744 | -11.70 | 11,395 | -5.53 | ||||
| 2025-08-14 | 13F | Synovus Financial Corp | 13,789 | 0.00 | 91 | 7.14 | ||||
| 2025-07-31 | 13F | AlTi Global, Inc. | 10,610 | 69 | ||||||
| 2025-07-28 | 13F | BRYN MAWR TRUST Co | 4,700 | 0.00 | 31 | 7.14 | ||||
| 2025-08-13 | 13F | Donald Smith & Co., Inc. | 11,063,436 | 6.25 | 72,797 | 13.68 | ||||
| 2025-07-25 | 13F | Cwm, Llc | 12,768 | -8.34 | 0 | |||||
| 2025-07-25 | 13F | Yousif Capital Management, Llc | 50,350 | 5.46 | 331 | 12.97 | ||||
| 2025-08-13 | 13F | Twin Peaks Wealth Advisors, LLC | 837 | 6 | ||||||
| 2025-07-07 | 13F | Investors Research Corp | 22,000 | 0.00 | 145 | 6.67 | ||||
| 2025-08-01 | 13F | Bessemer Group Inc | 1,507 | 0.00 | 0 | |||||
| 2025-08-14 | 13F | EP Wealth Advisors, Inc. | 10,885 | 72 | ||||||
| 2025-08-14 | 13F | Atomi Financial Group, Inc. | 21,296 | -22.58 | 140 | -17.16 | ||||
| 2025-08-13 | 13F | Northwestern Mutual Wealth Management Co | 814 | 5 | ||||||
| 2025-05-05 | 13F | Lindbrook Capital, Llc | 16,310 | -4.16 | 100 | 2.04 | ||||
| 2025-07-21 | 13F | Qrg Capital Management, Inc. | 219,356 | -0.77 | 1,443 | 6.18 | ||||
| 2025-07-28 | 13F | Harbour Investments, Inc. | 800 | 0.00 | 5 | 25.00 | ||||
| 2025-07-23 | 13F | Canopy Partners, LLC | 14,034 | -19.96 | 92 | -14.02 | ||||
| 2025-08-14 | 13F | Ameriprise Financial Inc | 79,499 | 12.98 | 523 | 21.06 | ||||
| 2025-08-05 | 13F | Bank Of Montreal /can/ | 28,924 | 4.79 | 190 | 12.43 | ||||
| 2025-07-09 | 13F | Baron Wealth Management LLC | 14,487 | 95 | ||||||
| 2025-08-13 | 13F | GeoWealth Management, LLC | 11,055 | 2.73 | 73 | 9.09 | ||||
| 2025-08-13 | 13F | Natixis Advisors, L.p. | 261,818 | 16.52 | 2 | 0.00 | ||||
| 2025-07-31 | 13F | Buckingham Strategic Partners | 14,907 | 29.45 | 98 | 38.57 | ||||
| 2025-05-09 | 13F | R Squared Ltd | 0 | -100.00 | 0 | |||||
| 2025-06-26 | NP | DXIV - Dimensional International Vector Equity ETF | 6,900 | 6.15 | 38 | -9.52 | ||||
| 2025-07-30 | 13F | Forum Financial Management, LP | 92,811 | -12.93 | 611 | -6.87 | ||||
| 2025-08-28 | NP | SAMM - Strategas Macro Momentum ETF | 0 | -100.00 | 0 | -100.00 | ||||
| 2025-08-13 | 13F | M&t Bank Corp | 30,734 | -8.13 | 202 | -1.95 | ||||
| 2025-08-12 | 13F | MAI Capital Management | 6,000 | 1,562.05 | 39 | 1,850.00 | ||||
| 2025-08-12 | 13F | Seeds Investor Llc | 15,387 | -12.46 | 101 | -6.48 | ||||
| 2025-06-26 | NP | DFA INVESTMENT DIMENSIONS GROUP INC - International Vector Equity Portfolio Shares | 8,048 | 0.00 | 45 | -15.38 | ||||
| 2025-08-14 | 13F | Vident Advisory, LLC | 293,595 | 16.74 | 1,932 | 24.90 | ||||
| 2025-08-27 | 13F/A | Brinker Capital Investments, LLC | 43,011 | -12.26 | 283 | -5.98 | ||||
| 2025-07-30 | NP | APIE - ActivePassive International Equity ETF | 200,399 | -9.86 | 1,220 | -14.74 | ||||
| 2025-08-14 | 13F | Mercer Global Advisors Inc /adv | 199,496 | -8.55 | 1,313 | -2.16 | ||||
| 2025-05-15 | 13F | Glenmede Trust Co Na | 27,794 | -7.88 | 171 | -2.30 | ||||
| 2025-08-14 | 13F | Hrt Financial Lp | 0 | -100.00 | 0 | |||||
| 2025-07-29 | 13F | Private Trust Co Na | 48 | 0.00 | 0 | |||||
| 2025-08-25 | 13F/A | Neuberger Berman Group LLC | 20,681 | 32.59 | 136 | 43.16 | ||||
| 2025-08-14 | 13F | Raymond James Financial Inc | 182,942 | 3.54 | 1,204 | 10.77 | ||||
| 2025-05-05 | 13F | IFP Advisors, Inc | 0 | -100.00 | 0 | |||||
| 2025-07-30 | 13F | D.a. Davidson & Co. | 18,500 | 2.78 | 122 | 10.00 | ||||
| 2025-08-13 | 13F | First Trust Advisors Lp | 159,150 | -22.50 | 1,047 | -17.04 | ||||
| 2025-07-28 | 13F | Ritholtz Wealth Management | 34,414 | 1.51 | 226 | 8.65 | ||||
| 2025-08-14 | 13F | Smartleaf Asset Management LLC | 38,050 | -16.08 | 251 | -13.15 | ||||
| 2025-07-30 | NP | IAFEX - Fisher Investments Institutional Group All Foreign Equity Environmental and Social Values Fund | 608 | 38.50 | 4 | 50.00 | ||||
| 2025-08-08 | 13F | Avantax Advisory Services, Inc. | 17,288 | -3.67 | 114 | 2.73 | ||||
| 2025-08-07 | 13F | Addison Advisors LLC | 1,618 | 11 | ||||||
| 2025-08-11 | 13F | Dorsey & Whitney Trust CO LLC | 27,357 | -5.15 | 180 | 1.69 | ||||
| 2025-08-14 | 13F | Toroso Investments, LLC | 62,900 | 414 | ||||||
| 2025-05-15 | 13F | Cubist Systematic Strategies, LLC | 0 | -100.00 | 0 | |||||
| 2025-09-04 | 13F/A | Advisor Group Holdings, Inc. | 6,434 | 1,018.96 | 42 | 1,266.67 | ||||
| 2025-08-14 | 13F | Summit Trail Advisors, Llc | 0 | -100.00 | 0 | |||||
| 2025-07-15 | 13F | Maseco Llp | 1,078 | 7 | ||||||
| 2025-05-05 | 13F | Diversify Advisory Services, LLC | 0 | -100.00 | 0 | |||||
| 2025-05-15 | 13F | Gts Securities Llc | 0 | -100.00 | 0 | |||||
| 2025-08-13 | 13F | Jones Financial Companies Lllp | 550 | 4 | ||||||
| 2025-05-08 | 13F | XTX Topco Ltd | 0 | -100.00 | 0 | |||||
| 2025-08-11 | 13F | Private Advisor Group, LLC | 27,206 | -0.93 | 179 | 6.55 | ||||
| 2025-04-21 | 13F | Nelson, Van Denburg & Campbell Wealth Management Group, LLC | 0 | -100.00 | 0 | |||||
| 2025-08-05 | 13F | NewSquare Capital LLC | 4,402 | 288.53 | 29 | 366.67 | ||||
| 2025-08-14 | 13F | D. E. Shaw & Co., Inc. | 1,062,456 | -22.76 | 6,991 | -17.37 | ||||
| 2025-05-15 | 13F | Citadel Advisors Llc | Call | 0 | -100.00 | 0 | ||||
| 2025-08-12 | 13F | Atlas Capital Advisors Llc | 8,081 | -70.93 | 53 | -68.82 | ||||
| 2025-08-14 | 13F | Syon Capital Llc | 28,249 | 186 | ||||||
| 2025-05-15 | 13F | CAPROCK Group, Inc. | 29,871 | -18.89 | 184 | -14.08 | ||||
| 2025-07-24 | 13F | Us Bancorp \de\ | 163,908 | -3.58 | 1,079 | 3.16 | ||||
| 2025-08-07 | 13F | Vise Technologies, Inc. | 10,638 | 70 | ||||||
| 2025-07-25 | 13F | Sequoia Financial Advisors, LLC | 32,188 | -1.99 | 212 | 4.98 | ||||
| 2025-07-23 | 13F | Prime Capital Investment Advisors, LLC | 0 | -100.00 | 0 | |||||
| 2025-08-11 | 13F | Annis Gardner Whiting Capital Advisors, LLC | 403 | 3 | ||||||
| 2025-05-13 | 13F | Cresset Asset Management, LLC | 0 | -100.00 | 0 | |||||
| 2025-06-26 | NP | DFIC - Dimensional International Core Equity 2 ETF | 458,637 | 0.61 | 2,545 | -13.82 | ||||
| 2025-08-14 | 13F | Colony Group, LLC | 43,933 | 94.62 | 289 | 109.42 | ||||
| 2025-08-11 | 13F | HighTower Advisors, LLC | 29,995 | -3.96 | 197 | 2.60 | ||||
| 2025-08-08 | 13F | Cetera Investment Advisers | 12,936 | 28.12 | 85 | 37.10 | ||||
| 2025-06-26 | NP | DFAX - Dimensional World ex U.S. Core Equity 2 ETF | 246,048 | 0.00 | 1,366 | -14.37 | ||||
| 2025-08-12 | 13F | CIBC Private Wealth Group, LLC | 1 | 0.00 | 0 | |||||
| 2025-08-14 | 13F | Wetherby Asset Management Inc | 126,268 | -5.25 | 831 | 7.65 | ||||
| 2025-08-19 | 13F/A | Pitcairn Co | 23,382 | -23.84 | 154 | -18.62 | ||||
| 2025-05-06 | 13F | Y-Intercept (Hong Kong) Ltd | 0 | -100.00 | 0 | -100.00 | ||||
| 2025-08-12 | 13F | Marietta Investment Partners Llc | 140,338 | 8.73 | 923 | 16.39 | ||||
| 2025-08-07 | 13F | Allworth Financial LP | 1,097 | 0.00 | 7 | 16.67 | ||||
| 2025-03-17 | 13F/A | Wealth Enhancement Advisory Services, Llc | 0 | -100.00 | 0 | |||||
| 2025-07-23 | 13F | Abel Hall, LLC | 0 | -100.00 | 0 | |||||
| 2025-08-14 | 13F | Susquehanna International Group, Llp | 0 | -100.00 | 0 | |||||
| 2025-06-26 | NP | DFIEX - International Core Equity Portfolio - Institutional Class This fund is a listed as child fund of Dimensional Fund Advisors Lp and if that institution has disclosed ownership in this security, then these positions will not be double counted when calculating total shares and total value | 122,223 | 0.00 | 678 | -14.39 | ||||
| 2025-08-14 | 13F | Royal Bank Of Canada | 3,613 | -2.38 | 24 | 9.09 | ||||
| 2025-08-04 | 13F | Haven Private, LLC | 15,110 | 99 | ||||||
| 2025-07-29 | 13F | Werba Rubin Papier Wealth Management | 17,488 | -3.67 | 115 | 3.60 | ||||
| 2025-08-07 | 13F | Campbell & CO Investment Adviser LLC | 164,057 | -9.22 | 1,079 | -2.88 | ||||
| 2025-06-26 | NP | DFIV - Dimensional International Value ETF | 879,257 | 0.17 | 4,880 | -14.21 | ||||
| 2025-08-08 | 13F | Larson Financial Group LLC | 949 | 6 | ||||||
| 2025-07-30 | 13F | Journey Advisory Group, LLC | 617,515 | 3.65 | 4,063 | 10.92 | ||||
| 2025-08-05 | 13F | Simplex Trading, Llc | Call | 4,400 | 0 | |||||
| 2025-08-13 | 13F | West Family Investments, Inc. | 21,449 | 0.00 | 141 | 7.63 | ||||
| 2025-07-17 | 13F | HB Wealth Management, LLC | 16,010 | 105 | ||||||
| 2025-08-07 | 13F | Parkside Financial Bank & Trust | 1,312 | 31.46 | 9 | 33.33 | ||||
| 2025-08-14 | 13F | Sei Investments Co | 10,144 | 67 | ||||||
| 2025-07-14 | 13F | Abound Wealth Management | 33 | 0.00 | 0 | |||||
| 2025-05-21 | 13F/A | Geneos Wealth Management Inc. | 496 | 34.42 | 3 | 50.00 | ||||
| 2025-07-14 | 13F | GAMMA Investing LLC | 18,033 | 0.62 | 119 | 7.27 | ||||
| 2025-08-14 | 13F | LMR Partners LLP | 0 | -100.00 | 0 | |||||
| 2025-07-24 | 13F | Ronald Blue Trust, Inc. | 17,632 | 14.66 | 116 | 23.40 | ||||
| 2025-08-12 | 13F | BlackRock, Inc. | 3,829,166 | -13.42 | 25,196 | -7.37 | ||||
| 2025-08-11 | 13F | Brown Brothers Harriman & Co | 412 | 3 | ||||||
| 2025-08-12 | 13F | Proequities, Inc. | Put | 0 | 0 | |||||
| 2025-08-12 | 13F | Proequities, Inc. | Call | 0 | 0 | |||||
| 2025-08-12 | 13F | Proequities, Inc. | 0 | 0 | ||||||
| 2025-08-04 | 13F | Capital Performance Advisors Llp | 11,136 | 73 | ||||||
| 2025-07-30 | 13F | Drive Wealth Management, Llc | 31,726 | -2.24 | 209 | 4.52 | ||||
| 2025-07-22 | 13F | Clarius Group, LLC | 11,739 | 77 | ||||||
| 2025-04-09 | 13F | Wallace Advisory Group, LLC | 0 | -100.00 | 0 | |||||
| 2025-08-13 | 13F | Northern Trust Corp | 2,419,553 | 5.98 | 15,921 | 13.39 | ||||
| 2025-07-11 | 13F/A | Umb Bank N A/mo | 1,452 | 0.00 | 10 | 12.50 | ||||
| 2025-08-15 | 13F | Morgan Stanley | 9,166,692 | -6.83 | 60,317 | -0.32 | ||||
| 2025-07-21 | 13F | Cromwell Holdings LLC | 12,467 | 0.00 | 82 | 7.89 | ||||
| 2025-05-01 | 13F | Diversify Wealth Management, Llc | 0 | -100.00 | 0 | |||||
| 2025-08-12 | 13F | Rhumbline Advisers | 96,609 | -0.90 | 636 | 6.01 | ||||
| 2025-07-15 | 13F | Fifth Third Bancorp | 668 | 4 | ||||||
| 2025-08-07 | 13F | Zions Bancorporation, National Association /ut/ | 1,432 | -0.14 | 9 | 12.50 | ||||
| 2025-08-04 | 13F | Simon Quick Advisors, Llc | 28,968 | 48.15 | 191 | 58.33 | ||||
| 2025-08-14 | 13F | Goldman Sachs Group Inc | 4,866,605 | 5.39 | 32,022 | 12.75 | ||||
| 2025-08-12 | 13F | Global Retirement Partners, LLC | 2,222 | -30.06 | 15 | -22.22 | ||||
| 2025-08-06 | 13F | Fox Run Management, L.l.c. | 0 | -100.00 | 0 | |||||
| 2025-07-29 | 13F | Wealthstream Advisors, Inc. | 12,507 | -14.00 | 82 | -7.87 | ||||
| 2025-08-11 | 13F | Principal Securities, Inc. | 2,549 | -20.37 | 17 | -11.11 | ||||
| 2025-05-08 | 13F | Empirical Financial Services, LLC d.b.a. Empirical Wealth Management | 0 | -100.00 | 0 | |||||
| 2025-07-11 | 13F | Pinnacle Bancorp, Inc. | 325 | -59.17 | 2 | -50.00 | ||||
| 2025-05-15 | 13F | Squarepoint Ops LLC | 0 | -100.00 | 0 | |||||
| 2025-08-12 | 13F | SRS Capital Advisors, Inc. | 2,661 | 18 | ||||||
| 2025-05-15 | 13F/A | Orion Portfolio Solutions, LLC | 49,019 | 8.84 | 301 | 15.77 | ||||
| 2025-04-11 | 13F | First Affirmative Financial Network | 22,593 | 9.22 | 139 | 15.97 | ||||
| 2025-07-09 | 13F | Bruce G. Allen Investments, LLC | 5,402 | 1.75 | 36 | 9.38 | ||||
| 2025-08-14 | 13F | Ieq Capital, Llc | 25,448 | 20.71 | 167 | 29.46 | ||||
| 2025-08-13 | 13F | Quadrant Capital Group Llc | 248,314 | -5.91 | 1,634 | 0.62 | ||||
| 2025-08-14 | 13F | Spears Abacus Advisors LLC | 0 | -100.00 | 0 | |||||
| 2025-06-26 | NP | DFA INVESTMENT DIMENSIONS GROUP INC - International Sustainability Core 1 Portfolio Shares | 30,971 | 0.00 | 172 | -14.50 | ||||
| 2025-07-30 | 13F | Ethic Inc. | 980,292 | -6.83 | 6,470 | 0.81 | ||||
| 2025-08-14 | 13F | Mml Investors Services, Llc | 98,251 | 3.86 | 1 | |||||
| 2025-07-30 | NP | ENDW - Cambria Endowment Style ETF | 72 | 0 | ||||||
| 2025-08-14 | 13F | Quantinno Capital Management LP | 779,036 | 49.85 | 5,126 | 60.34 | ||||
| 2025-07-22 | 13F | Checchi Capital Advisers, LLC | 10,759 | 71 | ||||||
| 2025-07-11 | 13F | UMA Financial Services, Inc. | 0 | -100.00 | 0 | |||||
| 2025-08-04 | 13F | Assetmark, Inc | 35,767 | 153.77 | 235 | 173.26 | ||||
| 2025-08-08 | 13F | Pnc Financial Services Group, Inc. | 178,842 | 17.06 | 1,177 | 25.24 | ||||
| 2025-07-16 | 13F | Perigon Wealth Management, LLC | 20,113 | -1.69 | 132 | 5.60 | ||||
| 2025-06-26 | NP | DFAI - Dimensional International Core Equity Market ETF | 694,000 | 0.00 | 3,852 | -14.37 | ||||
| 2025-06-26 | NP | SNTKX - Steward International Enhanced Index Fund Class A | 85,620 | 0.00 | 475 | -14.26 | ||||
| 2025-07-11 | 13F | Diversified Trust Co | 13,773 | -31.00 | 91 | -26.23 | ||||
| 2025-08-27 | NP | FORH - Formidable ETF | 62,900 | 414 | ||||||
| 2025-08-15 | 13F | Captrust Financial Advisors | 26,272 | -12.51 | 173 | -6.52 | ||||
| 2025-07-24 | 13F | Jfs Wealth Advisors, Llc | 2,303 | 9.25 | 15 | 25.00 | ||||
| 2025-06-27 | NP | DFA INVESTMENT DIMENSIONS GROUP INC - International Social Core Equity Portfolio Institutional Class This fund is a listed as child fund of Dimensional Fund Advisors Lp and if that institution has disclosed ownership in this security, then these positions will not be double counted when calculating total shares and total value | 61,247 | 0.00 | 340 | -14.39 | ||||
| 2025-05-15 | 13F | Citadel Advisors Llc | Put | 0 | -100.00 | 0 | ||||
| 2025-08-11 | 13F | GW&K Investment Management, LLC | 578 | -16.35 | 0 | |||||
| 2025-08-14 | 13F | UBS Group AG | 312,716 | 86.08 | 2,058 | 99.13 | ||||
| 2025-08-12 | 13F | Jpmorgan Chase & Co | 172,723 | 40.41 | 1,137 | 50.26 | ||||
| 2025-08-15 | 13F | WealthCollab, LLC | 677 | 203.59 | 4 | 300.00 | ||||
| 2025-08-05 | 13F | Simplex Trading, Llc | Put | 1,900 | 171.43 | 0 | ||||
| 2025-08-07 | 13F | Acadian Asset Management Llc | 63,998 | 37.20 | 0 | |||||
| 2025-07-14 | 13F | Abacus Wealth Partners, LLC | 11,114 | -37.79 | 73 | -33.03 | ||||
| 2025-08-05 | 13F | Simplex Trading, Llc | 0 | -100.00 | 0 | |||||
| 2025-08-14 | 13F | Fmr Llc | 2,168,124 | 16.05 | 14,266 | 24.17 | ||||
| 2025-08-04 | 13F | Syverson Strege & Co | 17,030 | 112 | ||||||
| 2025-07-11 | 13F | Farther Finance Advisors, LLC | 768 | -0.39 | 5 | 25.00 | ||||
| 2025-08-13 | 13F | Renaissance Technologies Llc | 2,211,337 | 12.20 | 14,551 | 20.04 | ||||
| 2025-08-13 | 13F | Fisher Asset Management, LLC | 9,829,802 | 0.34 | 64,680 | 7.35 | ||||
| 2025-08-12 | 13F | Dimensional Fund Advisors Lp | 3,182,173 | -0.11 | 20,939 | 6.88 | ||||
| 2025-07-17 | 13F | Sage Rhino Capital Llc | 18,593 | -3.89 | 122 | 3.39 | ||||
| 2025-08-12 | 13F | Summit Global Investments | 91,593 | 16.89 | 1 | |||||
| 2025-07-30 | 13F | Rnc Capital Management Llc | 57,574 | 13.25 | 379 | 21.15 | ||||
| 2025-05-07 | 13F | LPL Financial LLC | 0 | -100.00 | 0 | |||||
| 2025-08-11 | 13F | Bell Investment Advisors, Inc | 139 | 0.00 | 1 | |||||
| 2025-07-15 | 13F | Td Private Client Wealth Llc | 0 | -100.00 | 0 | |||||
| 2025-08-14 | 13F | Millennium Management Llc | 733,981 | 15.08 | 4,830 | 23.13 | ||||
| 2025-07-24 | 13F | Callan Family Office, LLC | 129,895 | 152.43 | 855 | 170.25 | ||||
| 2025-06-30 | NP | VASVX - Vanguard Selected Value Fund Investor Shares | 5,298,530 | 0.00 | 29,407 | -14.35 | ||||
| 2025-08-08 | 13F | Bailard, Inc. | 0 | -100.00 | 0 | |||||
| 2025-08-11 | 13F | EntryPoint Capital, LLC | 13,562 | -26.97 | 89 | -21.93 | ||||
| 2025-07-17 | 13F | Clean Yield Group | 2,019 | 0.00 | 13 | 8.33 | ||||
| 2025-08-15 | 13F | CI Private Wealth, LLC | 58,028 | 4.87 | 382 | 12.06 | ||||
| 2025-06-25 | NP | GENW - Genter Capital International Dividend ETF | 2,879 | 16 | ||||||
| 2025-08-11 | 13F | Pinnacle Wealth Planning Services, Inc. | 32,099 | -6.06 | 211 | 0.48 | ||||
| 2025-08-14 | 13F | Xponance, Inc. | 19,116 | 1.64 | 126 | 8.70 | ||||
| 2025-08-14 | 13F | Jane Street Group, Llc | 39,896 | -37.20 | 263 | -32.82 | ||||
| 2025-04-17 | 13F | Vista Wealth Management Group, LLC | 12,006 | 18.19 | 74 | 25.86 | ||||
| 2025-07-09 | 13F | Aaron Wealth Advisors LLC | 77,276 | -5.66 | 508 | 0.99 | ||||
| 2025-07-24 | 13F | Lester Murray Antman dba SimplyRich | 72,942 | -31.01 | 0 | |||||
| 2025-08-12 | 13F | Putnam Fl Investment Management Co | 11,386 | 75 | ||||||
| 2025-08-13 | 13F | Townsquare Capital Llc | 0 | -100.00 | 0 | |||||
| 2025-04-29 | 13F | Callan Capital, LLC | 155,985 | 13.16 | 959 | 20.18 | ||||
| 2025-07-16 | 13F | Signaturefd, Llc | 104,136 | -11.28 | 685 | -4.99 | ||||
| 2025-07-17 | 13F | Greenleaf Trust | 19,108 | -6.69 | 126 | 0.00 | ||||
| 2025-08-11 | 13F | Integrated Quantitative Investments LLC | 0 | -100.00 | 0 |
Other Listings
| DE:NSEA | € 5.95 |