Mga Batayang Estadistika
| Pemilik Institusional | 202 total, 197 long only, 0 short only, 5 long/short - change of 10.27% MRQ |
| Alokasi Portofolio Rata-rata | 1.0087 % - change of 2.45% MRQ |
| Saham Institusional (Jangka Panjang) | 18,251,411 (ex 13D/G) - change of 5.73MM shares 45.73% MRQ |
| Nilai Institusional (Jangka Panjang) | $ 2,137,289 USD ($1000) |
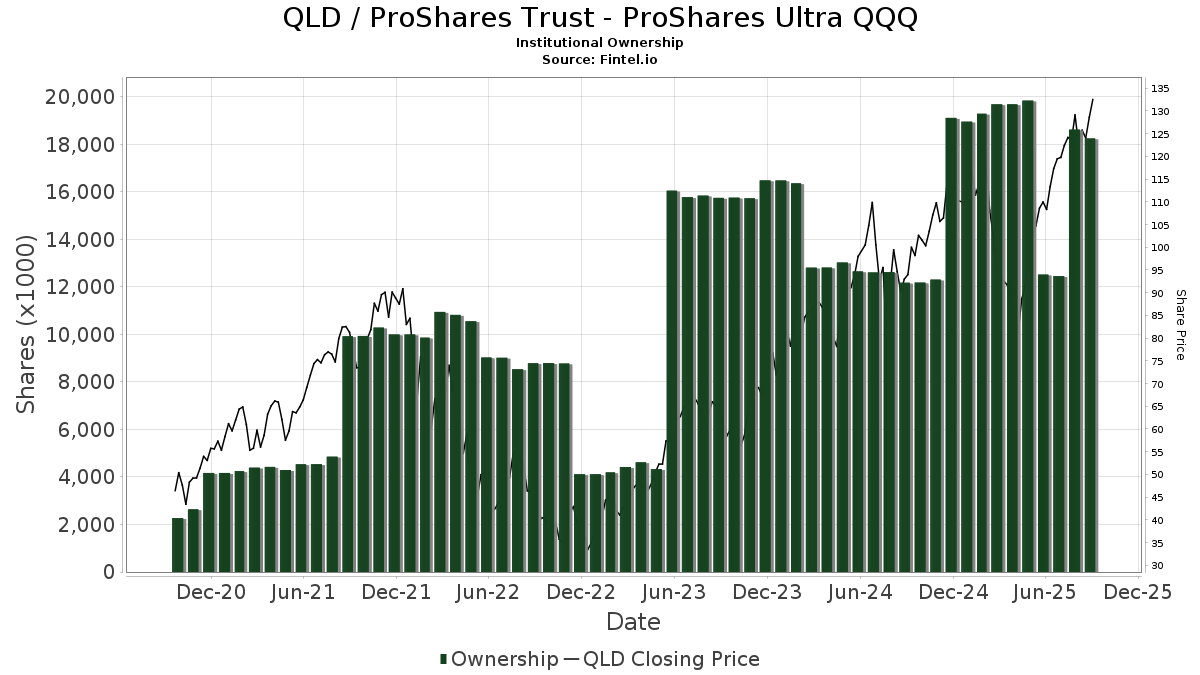
Kepemilikan Institusional dan Pemegang Saham
ProShares Trust - ProShares Ultra QQQ (US:QLD) memiliki 202 pemilik institusional dan pemegang saham yang telah mengajukan formulir 13D/G atau 13F kepada Komisi Bursa Efek (Securities Exchange Commission/SEC). Lembaga-lembaga ini memegang total 18,251,411 saham. Pemegang saham terbesar meliputi Howard Capital Management Inc., HCMGX - HCM Tactical Growth Fund Class A Shares, HCMNX - HCM Dividend Sector Plus Fund Class A Shares, HCMEX - HCM Income Plus Fund Class A Shares, Global View Capital Management LLC, Susquehanna International Group, Llp, Main Street Group, LTD, Atlantic Trust, LLC, Quadrature Capital Ltd, and Citadel Advisors Llc .
Struktur kepemilikan institusional ProShares Trust - ProShares Ultra QQQ (ARCA:QLD) menunjukkan posisi terkini di perusahaan oleh institusi dan dana, serta perubahan terbaru dalam ukuran posisi. Pemegang saham utama dapat mencakup investor individu, reksa dana, dana lindung nilai, atau institusi. Jadwal 13D menunjukkan bahwa investor memegang (atau pernah memegang) lebih dari 5% saham perusahaan dan bermaksud (atau pernah bermaksud) untuk secara aktif mengejar perubahan strategi bisnis. Jadwal 13G menunjukkan investasi pasif lebih dari 5%.
The share price as of September 5, 2025 is 126.56 / share. Previously, on September 9, 2024, the share price was 87.58 / share. This represents an increase of 44.51% over that period.
Skor Sentimen Dana
Skor Sentimen Dana (sebelumnya dikenal sebagai Skor Akumulasi Kepemilikan) menemukan saham-saham yang paling banyak dibeli oleh dana. Ini adalah hasil dari model kuantitatif multi-faktor yang canggih yang mengidentifikasi perusahaan dengan tingkat akumulasi institusional tertinggi. Model penilaian menggunakan kombinasi dari total peningkatan pemilik yang diungkapkan, perubahan dalam alokasi portofolio pada pemilik tersebut, dan metrik lainnya. Angka berkisar dari 0 hingga 100, dengan angka yang lebih tinggi menunjukkan tingkat akumulasi yang lebih tinggi dibandingkan dengan perusahaan sejenisnya, dan 50 adalah rata-ratanya.
Frekuensi Pembaruan: Setiap Hari
Lihat Ownership Explorer, yang menyediakan daftar perusahaan dengan peringkat tertinggi.
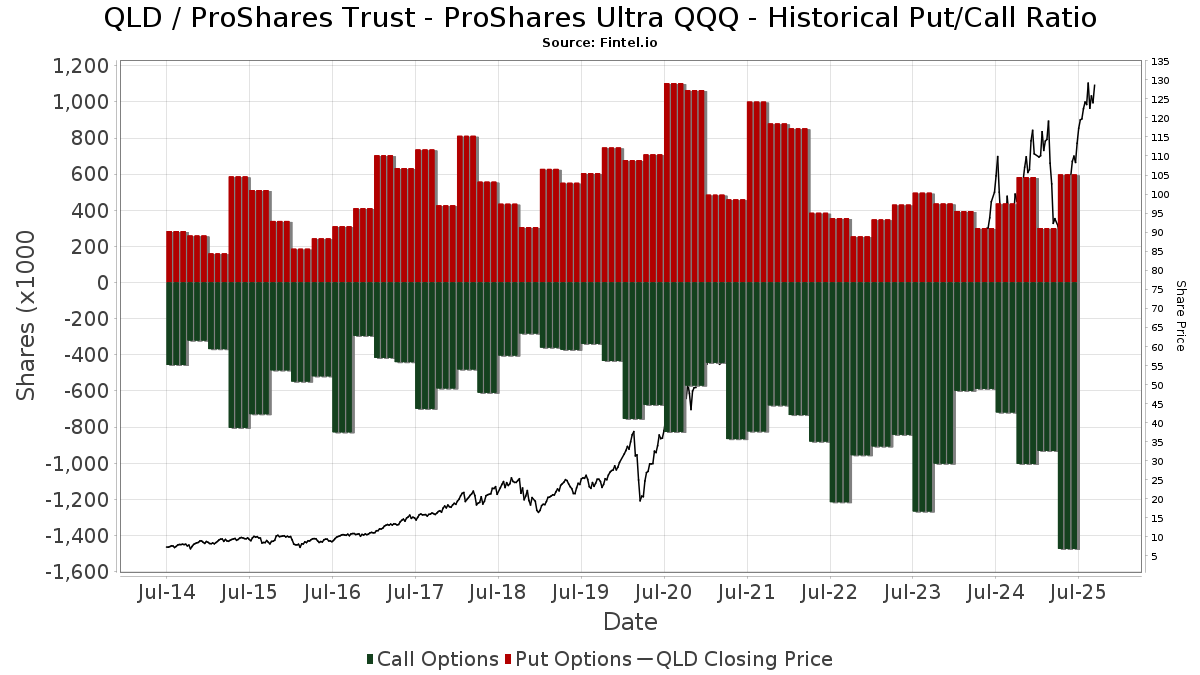
Rasio Put/Call Institusional
Selain melaporkan isu ekuitas dan utang standar, institusi dengan aset di bawah manajemen lebih dari 100 juta dolar AS juga harus mengungkapkan kepemilikan opsi put dan call mereka. Karena opsi put umumnya menunjukkan sentimen negatif, dan opsi call menunjukkan sentimen positif, kita dapat mengetahui sentimen institusional secara keseluruhan dengan memplot rasio put terhadap call. Grafik di sebelah kanan memplot rasio put/call historis untuk instrumen ini.
Menggunakan Rasio Put/Call sebagai indikator sentimen investor mengatasi salah satu kekurangan utama dari penggunaan total kepemilikan institusional, yaitu sejumlah besar aset yang dikelola diinvestasikan secara pasif untuk melacak indeks. Dana yang dikelola secara pasif biasanya tidak membeli opsi, sehingga indikator rasio put/call lebih akurat dalam melacak sentimen dana yang dikelola secara aktif.
Pengajuan 13F dan NPORT
Detail pada pengajuan 13F tersedia gratis. Detail pada pengajuan NP memerlukan keanggotaan premium. Baris berwarna hijau menunjukkan posisi baru. Baris berwarna merah menunjukkan posisi yang sudah ditutup. Klik tautan ini ikon untuk melihat riwayat transaksi selengkapnya.
Tingkatkan
untuk membuka data premium dan mengekspor ke Excel ![]() .
.
| Tanggal File | Sumber | Investor | Ketik | Presyo ng Avg (Silangan) |
Saham | Δ Saham (%) |
Dilaporkan Nilai ($1000) |
Nilai Δ (%) |
Alokasi Port (%) |
|
|---|---|---|---|---|---|---|---|---|---|---|
| 2025-05-07 | 13F | Sheaff Brock Investment Advisors, LLC | 7,000 | 0.00 | 622 | -17.83 | ||||
| 2025-08-05 | 13F | Westwood Wealth Management | 148,615 | 7.88 | 17,493 | 42.87 | ||||
| 2025-08-14 | 13F | CoreCap Advisors, LLC | 0 | 0 | ||||||
| 2025-07-16 | 13F | GenWealth Group, Inc. | 79,730 | 23.11 | 9,385 | 63.05 | ||||
| 2025-08-08 | 13F | Financial Gravity Companies, Inc. | 1 | -50.00 | 0 | |||||
| 2025-07-18 | 13F | Institute for Wealth Management, LLC. | 4,391 | 0.00 | 517 | 32.31 | ||||
| 2025-08-25 | 13F | BLVD Private Wealth, LLC | 1,980 | 233 | ||||||
| 2025-08-28 | NP | TFAQX - TFA Quantitative Fund Class I | 50,500 | -41.89 | 5,944 | -23.04 | ||||
| 2025-07-23 | 13F | SpringVest Wealth Management LLC | 4,003 | 0.02 | 472 | 32.68 | ||||
| 2025-08-11 | 13F | FineMark National Bank & Trust | 2,590 | 0.00 | 305 | 32.17 | ||||
| 2025-08-06 | 13F | Legacy Investment Solutions, LLC | 16,228 | 2,439.59 | 1,910 | 2,590.14 | ||||
| 2025-08-08 | 13F | Atlantic Trust, LLC | 362,025 | 1.69 | 42,614 | 34.67 | ||||
| 2025-05-29 | NP | Connetic Venture Capital Access Fund | 17,178 | 11.71 | 1,527 | -8.29 | ||||
| 2025-08-21 | 13F | Aveo Capital Partners, LLC | 0 | -100.00 | 0 | |||||
| 2025-08-13 | 13F | Flow Traders U.s. Llc | 4,604 | -87.92 | 1 | -100.00 | ||||
| 2025-08-08 | 13F | Empower Advisory Group, LLC | 4,348 | -51.10 | 512 | -35.32 | ||||
| 2025-08-20 | 13F/A | Coppell Advisory Solutions LLC | 1,960 | 228 | ||||||
| 2025-08-11 | 13F | HighTower Advisors, LLC | 60,849 | 5.02 | 7,163 | 39.09 | ||||
| 2025-08-12 | 13F | Global Retirement Partners, LLC | 12 | 1 | ||||||
| 2025-07-09 | 13F | Lbmc Investment Advisors, Llc | 3,556 | 0.00 | 419 | 32.28 | ||||
| 2025-08-11 | 13F | Aptus Capital Advisors, LLC | 305 | 0.00 | 36 | 29.63 | ||||
| 2025-08-14 | 13F | Modern Wealth Management, LLC | 6,999 | 824 | ||||||
| 2025-08-14 | 13F | Colony Group, LLC | 30,610 | 7.82 | 3,603 | 42.81 | ||||
| 2025-07-11 | 13F | SILVER OAK SECURITIES, Inc | 0 | -100.00 | 0 | -100.00 | ||||
| 2025-08-14 | 13F | Ieq Capital, Llc | 19,338 | 24.26 | 2,276 | 64.57 | ||||
| 2025-08-28 | NP | TFAZX - TFA Tactical Income Fund Class I | 6,200 | 87.88 | 730 | 148.81 | ||||
| 2025-07-16 | 13F | Castleview Partners, Llc | 15,603 | 28.46 | 1,837 | 70.16 | ||||
| 2025-08-14 | 13F | Apriem Advisors | 2,442 | 0.00 | 287 | 32.26 | ||||
| 2025-08-19 | 13F | Cape Investment Advisory, Inc. | 348 | -11.22 | 41 | 17.65 | ||||
| 2025-08-28 | NP | TFAFX - Tactical Growth Allocation Fund Class I | 10,900 | -31.88 | 1,283 | -9.77 | ||||
| 2025-07-24 | 13F | Blair William & Co/il | 1,636 | 0.00 | 193 | 32.41 | ||||
| 2025-07-14 | 13F | CRA Financial Services, LLC | 2,754 | 3.77 | 324 | 37.87 | ||||
| 2025-06-04 | 13F | Legacy Capital Wealth Management, Llc | 3,964 | 429 | ||||||
| 2025-08-08 | 13F | Capital Investment Advisory Services, LLC | 3,200 | 0.00 | 377 | 32.39 | ||||
| 2025-07-09 | 13F | Central Valley Advisors, Llc | 4,800 | 0.00 | 565 | 32.63 | ||||
| 2025-07-24 | 13F | Us Bancorp \de\ | 2,808 | -19.45 | 331 | 6.80 | ||||
| 2025-08-15 | 13F | Global View Capital Management LLC | 816,412 | 45.17 | 96,100 | 92.26 | ||||
| 2025-08-14 | 13F/A | Barclays Plc | 800 | 247.83 | 0 | |||||
| 2025-07-07 | 13F | Wesbanco Bank Inc | 9,600 | 0.00 | 1,130 | 32.47 | ||||
| 2025-07-10 | 13F | PMV Capital Advisers, LLC | 13,723 | 100.42 | 1,615 | 165.63 | ||||
| 2025-07-10 | 13F | Global Financial Private Client, LLC | 6,432 | 0.00 | 757 | 32.57 | ||||
| 2025-08-13 | 13F | Northwestern Mutual Wealth Management Co | 2,626 | 0.00 | 309 | 32.62 | ||||
| 2025-08-12 | 13F | Tradition Wealth Management, LLC | 2,000 | 235 | ||||||
| 2025-09-04 | 13F | Beacon Capital Management, Inc. | 231 | 27 | ||||||
| 2025-08-01 | 13F | Howard Capital Management Inc. | 6,471,937 | 7,370.87 | 762,617 | 9,805.40 | ||||
| 2025-08-12 | 13F | Proequities, Inc. | 0 | 0 | ||||||
| 2025-07-07 | 13F | Discipline Wealth Solutions, LLC | 10,660 | -2.35 | 1,255 | 29.28 | ||||
| 2025-07-25 | 13F | Hazlett, Burt & Watson, Inc. | 100 | 0.00 | 0 | |||||
| 2025-07-28 | 13F | Innova Wealth Partners | 11,582 | 45.50 | 1,363 | 92.79 | ||||
| 2025-07-16 | 13F | Crowley Wealth Management, Inc. | 43,555 | 0.00 | 5,127 | 32.42 | ||||
| 2025-08-13 | 13F | StoneX Group Inc. | 2,655 | 313 | ||||||
| 2025-08-08 | 13F | Meridian Wealth Management, LLC | 14,905 | 3.25 | 1,754 | 36.71 | ||||
| 2025-07-09 | 13F | VisionPoint Advisory Group, LLC | 3,210 | -78.85 | 378 | -72.03 | ||||
| 2025-07-09 | 13F | Massmutual Trust Co Fsb/adv | 949 | 38.14 | 112 | 81.97 | ||||
| 2025-08-14 | 13F | Two Sigma Securities, Llc | 0 | -100.00 | 0 | |||||
| 2025-05-13 | 13F | Roanoke Asset Management Corp/ Ny | 48,000 | 0.00 | 4 | -20.00 | ||||
| 2025-08-14 | 13F | Bank Of America Corp /de/ | 6,202 | 181.65 | 730 | 274.36 | ||||
| 2025-07-22 | 13F | CPR Investments Inc. | 0 | -100.00 | 0 | |||||
| 2025-08-15 | 13F | Kestra Advisory Services, LLC | 1,827 | 215 | ||||||
| 2025-08-27 | 13F/A | Squarepoint Ops LLC | 3,357 | -5.62 | 395 | 25.00 | ||||
| 2025-07-29 | 13F | Regions Financial Corp | 74,572 | -23.62 | 8,778 | 1.15 | ||||
| 2025-08-13 | 13F | Virtue Capital Management, LLC | 5,548 | 653 | ||||||
| 2025-05-07 | 13F | Prosperity Consulting Group, LLC | 0 | -100.00 | 0 | |||||
| 2025-08-18 | 13F | Tactive Advisors, LLC | 0 | -100.00 | 0 | |||||
| 2025-08-27 | 13F/A | Squarepoint Ops LLC | Put | 2,300 | -8.00 | 271 | 21.62 | |||
| 2025-07-24 | 13F | Galvin, Gaustad & Stein, LLC | 6,405 | 0.00 | 754 | 32.34 | ||||
| 2025-07-15 | 13F | Accurate Wealth Management, LLC | 2,180 | 260 | ||||||
| 2025-07-22 | 13F | Miracle Mile Advisors, LLC | 26,670 | -6.69 | 3,139 | 23.58 | ||||
| 2025-07-30 | 13F | Brookstone Capital Management | 7,020 | 26.37 | 826 | 67.55 | ||||
| 2025-08-27 | 13F/A | Squarepoint Ops LLC | Call | 4,000 | 0.00 | 471 | 32.39 | |||
| 2025-07-25 | 13F | Second Half Financial Partners, LLC | 2,400 | 0.00 | 283 | 32.39 | ||||
| 2025-08-27 | NP | HCMEX - HCM Income Plus Fund Class A Shares | 1,294,125 | -16.47 | 152,331 | -9.16 | ||||
| 2025-08-14 | 13F | Group One Trading, L.p. | 47,958 | 116.42 | 5,645 | 186.69 | ||||
| 2025-07-10 | 13F | Capital Advisory Group Advisory Services, LLC | 7,100 | 0.00 | 836 | 32.33 | ||||
| 2025-07-22 | 13F | Chung Wu Investment Group, LLC | 2,000 | 235 | ||||||
| 2025-08-13 | 13F | GeoWealth Management, LLC | 12,256 | -15.88 | 1,443 | 11.44 | ||||
| 2025-08-01 | 13F | Wealth Watch Advisors, INC | 2,613 | -21.53 | 308 | 4.07 | ||||
| 2025-04-23 | 13F | Financial Life Planners | 0 | -100.00 | 0 | |||||
| 2025-07-10 | 13F | Focus Financial Network, Inc. | 299,166 | 0.03 | 35,252 | 32.58 | ||||
| 2025-07-30 | 13F | Schnieders Capital Management Llc | 2,300 | 271 | ||||||
| 2025-08-14 | 13F | Bnp Paribas Arbitrage, Sa | 16 | 2 | ||||||
| 2025-08-13 | 13F | Mount Yale Investment Advisors, LLC | 322 | 38 | ||||||
| 2025-08-05 | 13F | Simplex Trading, Llc | 0 | -100.00 | 0 | |||||
| 2025-08-05 | 13F | Once Capital Management, LLC | 0 | -100.00 | 0 | |||||
| 2025-08-07 | 13F | Allworth Financial LP | 8,132 | 615.22 | 957 | 886.60 | ||||
| 2025-08-08 | 13F | Gts Securities Llc | 0 | -100.00 | 0 | |||||
| 2025-07-10 | 13F | Marshall Financial Group LLC | 256,981 | 40.12 | 30,247 | 85.56 | ||||
| 2025-08-07 | 13F | Donaldson Capital Management, Llc | 14,000 | 0.00 | 1,648 | 32.40 | ||||
| 2025-08-18 | 13F | Wolverine Trading, Llc | Put | 56,300 | 98.24 | 6,544 | 159.13 | |||
| 2025-08-18 | 13F | Wolverine Trading, Llc | 4,750 | 552 | ||||||
| 2025-08-18 | 13F | Wolverine Trading, Llc | Call | 129,900 | 44.65 | 15,098 | 89.06 | |||
| 2025-08-14 | 13F | Integrated Wealth Concepts LLC | 0 | -100.00 | 0 | |||||
| 2025-05-14 | 13F | Huntington National Bank | 3 | -25.00 | ||||||
| 2025-08-14 | 13F | Royal Bank Of Canada | 1,638 | 193 | ||||||
| 2025-08-12 | 13F | Manchester Capital Management LLC | 1,000 | 118 | ||||||
| 2025-08-14 | 13F | Headlands Technologies LLC | 0 | -100.00 | 0 | -100.00 | ||||
| 2025-08-05 | 13F | Milestone Asset Management, Llc | 1,852 | 218 | ||||||
| 2025-08-13 | 13F | Safe Harbor Fiduciary, LLC | 2,481 | 3.46 | 292 | 37.09 | ||||
| 2025-08-14 | 13F | Susquehanna International Group, Llp | Put | 297,200 | 45.47 | 34,983 | 92.66 | |||
| 2025-08-27 | NP | HCMNX - HCM Dividend Sector Plus Fund Class A Shares | 2,418,041 | 28.76 | 284,628 | 40.03 | ||||
| 2025-08-14 | 13F | Susquehanna International Group, Llp | 28,469 | -58.76 | 3,351 | -45.39 | ||||
| 2025-08-14 | 13F | Susquehanna International Group, Llp | Call | 784,200 | 60.73 | 92,308 | 112.87 | |||
| 2025-08-15 | 13F | Morgan Stanley | 6,564 | 149.20 | 773 | 229.91 | ||||
| 2025-07-29 | 13F | Chicago Partners Investment Group LLC | 2,235 | 274 | ||||||
| 2025-08-05 | 13F | Cassaday & Co Wealth Management LLC | 10,311 | -10.10 | 1,214 | 19.04 | ||||
| 2025-05-13 | 13F | HighTower Advisors, LLC | Put | 0 | -100.00 | 0 | -100.00 | |||
| 2025-08-06 | 13F | Savant Capital, LLC | 2,424 | 0.00 | 285 | 32.56 | ||||
| 2025-08-08 | 13F | Emerald Investment Partners, Llc | 1,524 | 179 | ||||||
| 2025-08-08 | 13F | Altfest L J & Co Inc | 0 | -100.00 | 0 | |||||
| 2025-07-14 | 13F | Sowell Financial Services LLC | 23,702 | -6.63 | 2,790 | 23.63 | ||||
| 2025-04-30 | 13F | Sofos Investments, Inc. | 2 | 0 | ||||||
| 2025-07-18 | 13F | Woodward Diversified Capital, Llc | 5,104 | 601 | ||||||
| 2025-08-14 | 13F | Citadel Advisors Llc | 117,648 | 18,998.70 | 13,848 | 25,544.44 | ||||
| 2025-08-14 | 13F | Citadel Advisors Llc | Put | 169,400 | 239.48 | 19,940 | 349.61 | |||
| 2025-08-14 | 13F | Citadel Advisors Llc | Call | 318,000 | 27.20 | 37,432 | 68.46 | |||
| 2025-08-08 | 13F | Pnc Financial Services Group, Inc. | 22,750 | 0.00 | 2,678 | 32.39 | ||||
| 2025-05-12 | 13F | Independent Advisor Alliance | 0 | -100.00 | 0 | |||||
| 2025-07-24 | 13F | Brandywine Oak Private Wealth Llc | 2,456 | 289 | ||||||
| 2025-08-13 | 13F | Rosenblum Silverman Sutton S F Inc /ca | 4,080 | -3.77 | 480 | 27.66 | ||||
| 2025-08-27 | NP | HCMGX - HCM Tactical Growth Fund Class A Shares | 2,697,550 | -30.78 | 317,529 | -24.72 | ||||
| 2025-08-13 | 13F | Lido Advisors, LLC | 12,801 | 88.25 | 1,508 | 149.67 | ||||
| 2025-08-14 | 13F | Wells Fargo & Company/mn | 2,430 | 1.25 | 286 | 34.27 | ||||
| 2025-09-04 | 13F/A | Advisor Group Holdings, Inc. | 46,923 | -4.68 | 5,523 | 26.24 | ||||
| 2025-07-10 | 13F | Oliver Lagore Vanvalin Investment Group | 1,742 | 23.63 | 155 | 1.32 | ||||
| 2025-08-28 | NP | TFAGX - TFA AlphaGen Growth Fund Class I | 49,000 | -46.09 | 5,768 | -28.62 | ||||
| 2025-08-14 | 13F | Quantinno Capital Management LP | 2,234 | 263 | ||||||
| 2025-05-12 | 13F | Citigroup Inc | 0 | -100.00 | 0 | |||||
| 2025-07-17 | 13F | Beacon Capital Management, LLC | 3 | 0.00 | 0 | |||||
| 2025-07-31 | 13F | 180 Wealth Advisors, Llc | 23,135 | 2,723 | ||||||
| 2025-07-11 | 13F | Farther Finance Advisors, LLC | 9,558 | 90.02 | 1,125 | 147.80 | ||||
| 2025-07-14 | 13F/A | Seek First Inc. | 2,333 | 2.10 | 275 | 34.98 | ||||
| 2025-08-12 | 13F | Wealthbridge Capital Management, Llc | 4,423 | 521 | ||||||
| 2025-07-22 | 13F | IMC-Chicago, LLC | 0 | -100.00 | 0 | |||||
| 2025-08-11 | 13F | Brown Brothers Harriman & Co | 10,640 | -5.34 | 1,252 | 25.33 | ||||
| 2025-08-06 | 13F | Legacy Wealth Managment, LLC/ID | 16,228 | 2,153.89 | 1,910 | 2,931.75 | ||||
| 2025-08-07 | 13F | Nwam Llc | 4,321 | 0.00 | 536 | 39.58 | ||||
| 2025-05-15 | 13F | Johnson Financial Group, Inc. | 0 | -100.00 | 0 | -100.00 | ||||
| 2025-04-29 | 13F | DT Investment Partners, LLC | 0 | -100.00 | 0 | |||||
| 2025-08-14 | 13F | Harvest Investment Services, LLC | 15,528 | 5.10 | 1,828 | 39.15 | ||||
| 2025-05-09 | 13F | Exencial Wealth Advisors, Llc | 0 | -100.00 | 0 | -100.00 | ||||
| 2025-05-15 | 13F/A | Orion Portfolio Solutions, LLC | 9,559 | -5.89 | 850 | -22.75 | ||||
| 2025-08-14 | 13F | Mariner, LLC | 29,403 | 3.27 | 3,461 | 36.80 | ||||
| 2025-08-15 | 13F | CI Private Wealth, LLC | 2,720 | -22.84 | 320 | 2.24 | ||||
| 2025-08-14 | 13F | Jane Street Group, Llc | 0 | -100.00 | 0 | |||||
| 2025-07-21 | 13F | Empirical Financial Services, LLC d.b.a. Empirical Wealth Management | 1,974 | 232 | ||||||
| 2025-07-10 | 13F | Wealth Enhancement Advisory Services, Llc | 3,087 | 369 | ||||||
| 2025-08-14 | 13F | CIBC World Markets Inc. | 29,779 | 0.00 | 3,505 | 32.46 | ||||
| 2025-08-13 | 13F | RIA Advisory Group LLC | 57,163 | 6,729 | ||||||
| 2025-08-05 | 13F | Prosperity Wealth Management, Inc. | 25,609 | 211.66 | 3,014 | 312.88 | ||||
| 2025-08-13 | 13F | Townsquare Capital Llc | 0 | -100.00 | 0 | |||||
| 2025-08-07 | 13F | Davidson Capital Management Inc. | 3 | 0.00 | 0 | |||||
| 2025-08-04 | 13F | Spire Wealth Management | 1,624 | 41.96 | 191 | 89.11 | ||||
| 2025-05-15 | 13F | MAI Capital Management | 0 | -100.00 | 0 | |||||
| 2025-08-14 | 13F | Jane Street Group, Llc | Put | 73,500 | 317.61 | 8,652 | 453.13 | |||
| 2025-08-14 | 13F | Jane Street Group, Llc | Call | 237,500 | 138.69 | 27,956 | 216.14 | |||
| 2025-07-30 | 13F | Drive Wealth Management, Llc | 8,363 | 985 | ||||||
| 2025-04-29 | NP | EBI - Longview Advantage ETF | 3,843 | 405 | ||||||
| 2025-07-15 | 13F | Fifth Third Bancorp | 0 | -100.00 | 0 | |||||
| 2025-07-24 | 13F | CarsonAllaria Wealth Management, Ltd. | 480 | 0.00 | 57 | 33.33 | ||||
| 2025-07-14 | 13F | Toth Financial Advisory Corp | 160,564 | -16.19 | 18,900 | 10.99 | ||||
| 2025-07-16 | 13F | Signaturefd, Llc | 0 | -100.00 | 0 | |||||
| 2025-05-05 | 13F | Formidable Asset Management, LLC | 0 | -100.00 | 0 | |||||
| 2025-08-08 | 13F | SBI Securities Co., Ltd. | 22,018 | -3.60 | 2,592 | 27.64 | ||||
| 2025-05-13 | 13F | Klingman & Associates, LLC | 0 | -100.00 | 0 | |||||
| 2025-08-27 | 13F/A | Brinker Capital Investments, LLC | 10,488 | 9.72 | 1,235 | 45.35 | ||||
| 2025-08-06 | 13F | Wsfs Capital Management, Llc | 44,931 | -0.74 | 5,289 | 31.44 | ||||
| 2025-08-13 | 13F | EverSource Wealth Advisors, LLC | 24 | 0.00 | 3 | 0.00 | ||||
| 2025-08-01 | 13F | Envestnet Asset Management Inc | 16,851 | -9.85 | 1,983 | 19.39 | ||||
| 2025-05-09 | 13F | Commonwealth Equity Services, Llc | 0 | -100.00 | 0 | |||||
| 2025-08-05 | 13F | American Capital Advisory, LLC | 164 | 0.00 | 19 | 35.71 | ||||
| 2025-08-07 | 13F | Vise Technologies, Inc. | 2,681 | 316 | ||||||
| 2025-08-11 | 13F | Wealthspire Advisors, LLC | 1,804 | 212 | ||||||
| 2025-07-24 | 13F | IFP Advisors, Inc | 249 | -72.30 | 29 | -63.29 | ||||
| 2025-08-12 | 13F | XTX Topco Ltd | 0 | -100.00 | 0 | |||||
| 2025-07-25 | 13F | Envestnet Portfolio Solutions, Inc. | 2,494 | -68.59 | 294 | -58.44 | ||||
| 2025-08-13 | 13F | Quadrature Capital Ltd | 339,321 | 39,925 | ||||||
| 2025-07-25 | 13F | Sequoia Financial Advisors, LLC | 2,396 | -3.97 | 282 | 27.60 | ||||
| 2025-04-25 | 13F | Wall Street Financial Group, Inc. | 3,153 | 23.74 | 280 | 1.82 | ||||
| 2025-07-17 | 13F | Nelson, Van Denburg & Campbell Wealth Management Group, LLC | 10,285 | 0.00 | 1,211 | 32.39 | ||||
| 2025-08-12 | 13F | Change Path, LLC | 2,559 | 0.00 | 301 | 32.60 | ||||
| 2025-05-07 | 13F | Robinson Value Management, Ltd. | 0 | -100.00 | 0 | |||||
| 2025-08-13 | 13F | Renaissance Technologies Llc | 18,200 | 2,142 | ||||||
| 2025-07-15 | 13F | James J. Burns & Company, LLC | 2,844 | 0.00 | 335 | 32.54 | ||||
| 2025-07-17 | 13F | Grandview Asset Management LLC | 3,200 | 0.00 | 0 | |||||
| 2025-08-11 | 13F | Outlook Wealth Advisors, LLC | 1,832 | 216 | ||||||
| 2025-08-11 | 13F | Mindset Wealth Management, Llc | 7,014 | 0.00 | 826 | 32.42 | ||||
| 2025-07-21 | 13F | Compass Planning Associates Inc | 372 | 0.00 | 44 | 30.30 | ||||
| 2025-07-08 | 13F | D. Scott Neal, Inc. | 24,928 | 0.00 | 2,934 | 32.46 | ||||
| 2025-07-24 | 13F | Zullo Investment Group, Inc. | 1,800 | 212 | ||||||
| 2025-07-31 | 13F | Ground Swell Capital, LLC | 0 | -100.00 | 0 | |||||
| 2025-07-31 | 13F | Cambridge Investment Research Advisors, Inc. | 10,684 | -20.23 | 1 | 0.00 | ||||
| 2025-08-12 | 13F | Walled Lake Planning & Wealth Management, Llc | 0 | -100.00 | 0 | |||||
| 2025-08-04 | 13F | Mesirow Financial Investment Management, Inc. | 47,100 | 0.00 | 5,544 | 32.44 | ||||
| 2025-07-29 | 13F | Aire Advisors, Llc | 3,001 | 0.00 | 353 | 32.71 | ||||
| 2025-08-04 | 13F | Horizon Wealth Management, LLC | 4,406 | 0.00 | 519 | 32.48 | ||||
| 2025-08-14 | 13F | UBS Group AG | 13,039 | -81.69 | 1,535 | -75.77 | ||||
| 2025-07-08 | 13F | Silverleafe Capital Partners, LLC | 2,339 | -22.75 | 275 | 2.23 | ||||
| 2025-07-08 | 13F | Parallel Advisors, LLC | 461 | 0.00 | 54 | 31.71 | ||||
| 2025-07-14 | 13F | Farmers & Merchants Investments Inc | 400 | 0.00 | 47 | 34.29 | ||||
| 2025-08-04 | 13F | Adell Harriman & Carpenter Inc | 6,830 | 8.07 | 804 | 43.14 | ||||
| 2025-08-14 | 13F | Mercer Global Advisors Inc /adv | 9,556 | 0.01 | 1,125 | 32.39 | ||||
| 2025-08-13 | 13F | Cresset Asset Management, LLC | 26,780 | 0.00 | 3,156 | 32.56 | ||||
| 2025-07-15 | 13F | Main Street Group, LTD | 535,088 | 4.91 | 62,985 | 38.94 | ||||
| 2025-05-15 | 13F | Optiver Holding B.V. | 0 | -100.00 | 0 | |||||
| 2025-08-14 | 13F | TCG Advisory Services, LLC | 57,010 | 6,711 | ||||||
| 2025-08-14 | 13F | Hrt Financial Lp | 3,862 | 0 | ||||||
| 2025-05-05 | 13F | Hollencrest Capital Management | 0 | -100.00 | 0 | |||||
| 2025-05-12 | 13F | Sandy Spring Bank | 990 | 0.00 | 88 | -18.69 | ||||
| 2025-05-14 | 13F | Jump Financial, LLC | 0 | -100.00 | 0 | -100.00 | ||||
| 2025-05-13 | 13F | Watts Gwilliam & Co., LLC | 34,899 | 0.28 | 3,102 | -18.78 | ||||
| 2025-07-31 | 13F | Burke & Herbert Bank & Trust Co | 10,000 | 0.00 | 1,177 | 32.55 | ||||
| 2025-08-04 | 13F | Keybank National Association/oh | 3,414 | 402 | ||||||
| 2025-08-15 | 13F | AlpenGlobal Capital LLC | 9,678 | 13.30 | 1,139 | 50.07 | ||||
| 2025-07-18 | 13F | Lowery Thomas, Llc | 3,834 | 3.54 | 451 | 37.08 | ||||
| 2025-05-15 | 13F | Parallax Volatility Advisers, L.P. | Call | 0 | -100.00 | 0 | -100.00 | |||
| 2025-07-09 | 13F | Client First Investment Management LLC | 31,139 | 3,665 | ||||||
| 2025-08-12 | 13F | Spectrum Wealth Advisory Group, LLC | 4,180 | 0.00 | 492 | 32.61 | ||||
| 2025-07-08 | 13F | First National Corp /ma/ /adv | 78,869 | 9.20 | 9,284 | 44.62 | ||||
| 2025-05-05 | 13F | Lindbrook Capital, Llc | 60 | 5 | ||||||
| 2025-08-12 | 13F | SRS Capital Advisors, Inc. | 17,596 | 5.04 | 2,071 | 39.18 | ||||
| 2025-08-08 | 13F | Creative Planning | 32,934 | -19.09 | 3,877 | 7.13 | ||||
| 2025-08-15 | 13F | Tower Research Capital LLC (TRC) | 1,596 | -91.20 | 188 | -87.98 | ||||
| 2025-07-29 | 13F | Koshinski Asset Management, Inc. | 4,754 | 0.00 | 560 | 32.46 | ||||
| 2025-08-14 | 13F | Financial Engines Advisors L.L.C. | 16,391 | -0.76 | 1,929 | 31.40 | ||||
| 2025-05-15 | 13F | Parallax Volatility Advisers, L.P. | Put | 0 | -100.00 | 0 | -100.00 | |||
| 2025-08-05 | 13F | Bank Of Montreal /can/ | 19,192 | 296.69 | 2,259 | 425.35 | ||||
| 2025-08-06 | 13F | Atlantic Union Bankshares Corp | 990 | 117 | ||||||
| 2025-08-07 | 13F | Rollins Financial Advisors, LLC | 13,116 | -2.32 | 1,544 | 29.34 | ||||
| 2025-07-21 | 13F | Segment Wealth Management, LLC | 0 | -100.00 | 0 | |||||
| 2025-07-31 | 13F | Fedenia Advisers LLC | 6,024 | -0.46 | 709 | 32.03 | ||||
| 2025-08-07 | 13F | Efficient Advisors, LLC | 0 | -100.00 | 0 | |||||
| 2025-05-15 | 13F | Parallax Volatility Advisers, L.P. | 0 | -100.00 | 0 | -100.00 | ||||
| 2025-08-25 | 13F | Hilltop Partners LLC | 2,336 | 0.00 | 275 | 32.37 | ||||
| 2025-08-08 | 13F | Capital Investment Counsel, Inc | 1,890 | 4,100.00 | 222 | 5,450.00 | ||||
| 2025-05-15 | 13F | Beck Capital Management, Llc | 0 | -100.00 | 0 | |||||
| 2025-05-02 | 13F | Edgestream Partners, L.P. | 0 | -100.00 | 0 | |||||
| 2025-07-29 | 13F | Dale Q Rice Investment Management Ltd | 116,416 | -43.04 | 13,942 | -23.25 | ||||
| 2025-06-17 | 13F | Ridgepath Capital Management LLC | 31,856 | -68.03 | 2,831 | -73.75 | ||||
| 2025-08-12 | 13F | CIBC Private Wealth Group, LLC | 10,669 | 0.00 | 1,256 | 69.82 | ||||
| 2025-04-25 | 13F | Clay Northam Wealth Management, LLC | 0 | -100.00 | 0 | |||||
| 2025-07-23 | 13F | Foresight Capital Management Advisors, Inc. | 0 | -100.00 | 0 | |||||
| 2025-07-17 | 13F | Tempus Wealth Planning, LLC | 52,293 | 6,155 | ||||||
| 2025-07-28 | 13F | Axxcess Wealth Management, Llc | 0 | -100.00 | 0 | |||||
| 2025-07-25 | 13F | Atria Wealth Solutions, Inc. | 1,922 | -63.82 | 227 | -52.12 | ||||
| 2025-08-14 | 13F | Millennium Management Llc | 6,844 | 806 | ||||||
| 2025-08-08 | 13F | Foundations Investment Advisors, LLC | 9,342 | -7.09 | 1,100 | 23.07 | ||||
| 2025-08-13 | 13F | Natixis | 280 | 33 | ||||||
| 2025-08-12 | 13F | LPL Financial LLC | 54,675 | 28.93 | 6,436 | 70.73 | ||||
| 2025-07-23 | 13F | Steel Peak Wealth Management LLC | 26,115 | 0.00 | 3,077 | 32.57 | ||||
| 2025-08-11 | 13F | Banque Cantonale Vaudoise | 4,800 | 0.00 | 1 | |||||
| 2025-07-08 | 13F | Goldstone Financial Group, LLC | 3,608 | 0.00 | 431 | 34.69 | ||||
| 2025-07-15 | 13F | Norden Group Llc | 3,006 | 32.72 | 354 | 75.62 | ||||
| 2025-08-12 | 13F | Jpmorgan Chase & Co | 11,714 | 41,735.71 | 1,379 | 68,800.00 | ||||
| 2025-08-13 | 13F | Connective Capital Management, LLC | 52,959 | 0.00 | 6,234 | 32.45 | ||||
| 2025-08-19 | 13F | Anchor Investment Management, LLC | 1,740 | 3.14 | 205 | 36.91 | ||||
| 2025-08-14 | 13F | Qube Research & Technologies Ltd | 0 | -100.00 | 0 | |||||
| 2025-08-13 | 13F | West Chester Capital Advisors, Inc | 7,577 | -34.73 | 892 | -13.58 | ||||
| 2025-04-18 | 13F | Optivise Advisory Services LLC | 0 | -100.00 | 0 | |||||
| 2025-08-07 | 13F | Sollinda Capital Management LLC | 0 | -100.00 | 0 | |||||
| 2025-08-07 | 13F | Traynor Capital Management, Inc. | 1,860 | 215 | ||||||
| 2025-07-02 | 13F | HBW Advisory Services LLC | 2,034 | 239 | ||||||
| 2025-08-13 | 13F | Van Hulzen Asset Management, LLC | 3,600 | 424 |