Mga Batayang Estadistika
| Pemilik Institusional | 236 total, 236 long only, 0 short only, 0 long/short - change of 9.77% MRQ |
| Alokasi Portofolio Rata-rata | 0.4839 % - change of -31.87% MRQ |
| Saham Institusional (Jangka Panjang) | 20,910,587 (ex 13D/G) - change of -1.63MM shares -7.24% MRQ |
| Nilai Institusional (Jangka Panjang) | $ 948,916 USD ($1000) |
Kepemilikan Institusional dan Pemegang Saham
SPDR Series Trust - SPDR S&P 500 Fossil Fuel Reserves Free ETF (US:SPYX) memiliki 236 pemilik institusional dan pemegang saham yang telah mengajukan formulir 13D/G atau 13F kepada Komisi Bursa Efek (Securities Exchange Commission/SEC). Lembaga-lembaga ini memegang total 20,910,587 saham. Pemegang saham terbesar meliputi Windmill Hill Asset Management Ltd, Choate Investment Advisors, Betterment LLC, Bank of New York Mellon Corp, Bank Of America Corp /de/, Pnc Financial Services Group, Inc., LPL Financial LLC, Morgan Stanley, Gemmer Asset Management LLC, and Sensible Financial Planning & Management, LLC. .
Struktur kepemilikan institusional SPDR Series Trust - SPDR S&P 500 Fossil Fuel Reserves Free ETF (ARCA:SPYX) menunjukkan posisi terkini di perusahaan oleh institusi dan dana, serta perubahan terbaru dalam ukuran posisi. Pemegang saham utama dapat mencakup investor individu, reksa dana, dana lindung nilai, atau institusi. Jadwal 13D menunjukkan bahwa investor memegang (atau pernah memegang) lebih dari 5% saham perusahaan dan bermaksud (atau pernah bermaksud) untuk secara aktif mengejar perubahan strategi bisnis. Jadwal 13G menunjukkan investasi pasif lebih dari 5%.
The share price as of September 5, 2025 is 53.26 / share. Previously, on September 9, 2024, the share price was 44.85 / share. This represents an increase of 18.75% over that period.

Skor Sentimen Dana
Skor Sentimen Dana (sebelumnya dikenal sebagai Skor Akumulasi Kepemilikan) menemukan saham-saham yang paling banyak dibeli oleh dana. Ini adalah hasil dari model kuantitatif multi-faktor yang canggih yang mengidentifikasi perusahaan dengan tingkat akumulasi institusional tertinggi. Model penilaian menggunakan kombinasi dari total peningkatan pemilik yang diungkapkan, perubahan dalam alokasi portofolio pada pemilik tersebut, dan metrik lainnya. Angka berkisar dari 0 hingga 100, dengan angka yang lebih tinggi menunjukkan tingkat akumulasi yang lebih tinggi dibandingkan dengan perusahaan sejenisnya, dan 50 adalah rata-ratanya.
Frekuensi Pembaruan: Setiap Hari
Lihat Ownership Explorer, yang menyediakan daftar perusahaan dengan peringkat tertinggi.
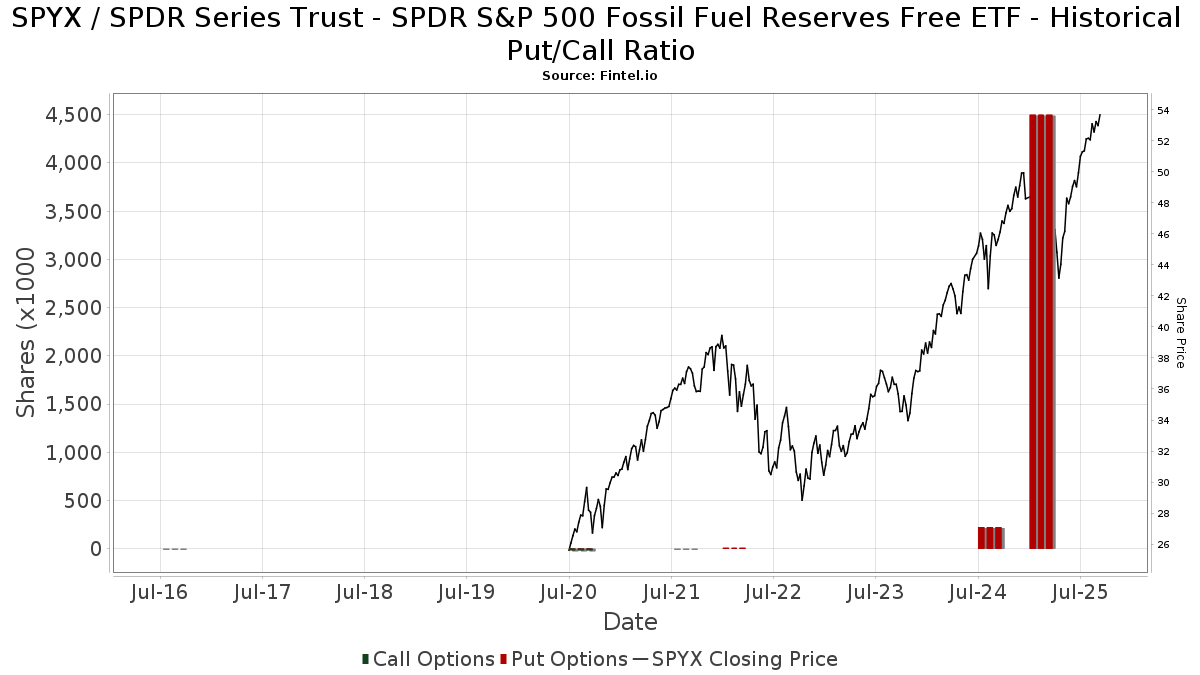
Rasio Put/Call Institusional
Selain melaporkan isu ekuitas dan utang standar, institusi dengan aset di bawah manajemen lebih dari 100 juta dolar AS juga harus mengungkapkan kepemilikan opsi put dan call mereka. Karena opsi put umumnya menunjukkan sentimen negatif, dan opsi call menunjukkan sentimen positif, kita dapat mengetahui sentimen institusional secara keseluruhan dengan memplot rasio put terhadap call. Grafik di sebelah kanan memplot rasio put/call historis untuk instrumen ini.
Menggunakan Rasio Put/Call sebagai indikator sentimen investor mengatasi salah satu kekurangan utama dari penggunaan total kepemilikan institusional, yaitu sejumlah besar aset yang dikelola diinvestasikan secara pasif untuk melacak indeks. Dana yang dikelola secara pasif biasanya tidak membeli opsi, sehingga indikator rasio put/call lebih akurat dalam melacak sentimen dana yang dikelola secara aktif.
Pengajuan 13F dan NPORT
Detail pada pengajuan 13F tersedia gratis. Detail pada pengajuan NP memerlukan keanggotaan premium. Baris berwarna hijau menunjukkan posisi baru. Baris berwarna merah menunjukkan posisi yang sudah ditutup. Klik tautan ini ikon untuk melihat riwayat transaksi selengkapnya.
Tingkatkan
untuk membuka data premium dan mengekspor ke Excel ![]() .
.
| Tanggal File | Sumber | Investor | Ketik | Presyo ng Avg (Silangan) |
Saham | Δ Saham (%) |
Dilaporkan Nilai ($1000) |
Nilai Δ (%) |
Alokasi Port (%) |
|
|---|---|---|---|---|---|---|---|---|---|---|
| 2025-08-08 | 13F | Larson Financial Group LLC | 678 | 0.15 | 35 | 13.33 | ||||
| 2025-07-23 | 13F | Proffitt & Goodson Inc | 1,816 | 2.83 | 92 | 15.00 | ||||
| 2025-04-24 | 13F | Decker Retirement Planning Inc. | 0 | -100.00 | 0 | |||||
| 2025-08-08 | 13F | Tortoise Investment Management, LLC | 4,835 | 0.83 | 246 | 12.33 | ||||
| 2025-08-12 | 13F | Putnam Fl Investment Management Co | 74,757 | 2.66 | 3,807 | 14.29 | ||||
| 2025-08-13 | 13F | Continuum Advisory, LLC | 0 | -100.00 | 0 | |||||
| 2025-08-25 | 13F | BLVD Private Wealth, LLC | 10,822 | 551 | ||||||
| 2025-08-15 | 13F | Kestra Advisory Services, LLC | 13,340 | 124.58 | 679 | 150.55 | ||||
| 2025-08-05 | 13F | GPS Wealth Strategies Group, LLC | 1,940 | 179.14 | 99 | 216.13 | ||||
| 2025-07-14 | 13F | Painted Porch Advisors LLC | 569 | 0.00 | 29 | 7.69 | ||||
| 2025-07-18 | 13F | Trust Co Of Vermont | 11,371 | 2.26 | 579 | 13.98 | ||||
| 2025-05-12 | 13F | Red Crane Wealth Management, Llc | 0 | -100.00 | 0 | |||||
| 2025-08-14 | 13F | Toroso Investments, LLC | 30,469 | 1,552 | ||||||
| 2025-07-30 | 13F | Princeton Global Asset Management LLC | 1,171 | 0.26 | 60 | 11.32 | ||||
| 2025-07-11 | 13F | Diversified Trust Co | 7,932 | 0.00 | 404 | 11.33 | ||||
| 2025-08-07 | 13F | Addison Advisors LLC | 6,135 | -25.59 | 312 | -17.24 | ||||
| 2025-07-22 | 13F | Iron Horse Wealth Management, LLC | 38 | 0.00 | 2 | 0.00 | ||||
| 2025-08-19 | 13F | Asset Dedication, LLC | 780 | 0.00 | 40 | 11.43 | ||||
| 2025-07-22 | 13F | IMC-Chicago, LLC | 23,830 | -26.10 | 1,214 | -17.76 | ||||
| 2025-07-29 | 13F | Private Trust Co Na | 471 | 0.00 | 24 | 9.52 | ||||
| 2025-08-01 | 13F | Schmidt P J Investment Management Inc | 8,925 | 0.00 | 455 | 11.27 | ||||
| 2025-08-06 | 13F | Modera Wealth Management, LLC | 48,732 | 0.78 | 2,482 | 12.16 | ||||
| 2025-07-25 | 13F | Cwm, Llc | 11,920 | -0.35 | 1 | |||||
| 2025-08-11 | 13F | Heritage Wealth Advisors | 0 | -100.00 | 0 | |||||
| 2025-05-05 | 13F | Private Advisor Group, LLC | 0 | -100.00 | 0 | |||||
| 2025-07-31 | 13F | Cambridge Investment Research Advisors, Inc. | 125,644 | -1.84 | 6 | 20.00 | ||||
| 2025-08-12 | 13F | Global Retirement Partners, LLC | 2,417 | 170.96 | 123 | 192.86 | ||||
| 2025-08-11 | 13F | WPG Advisers, LLC | 29 | 0.00 | 1 | 0.00 | ||||
| 2025-07-07 | 13F | Investors Research Corp | 1,557 | 0.00 | 79 | 11.27 | ||||
| 2025-08-13 | 13F | Cerity Partners LLC | 147,038 | 30.41 | 7,489 | 45.17 | ||||
| 2025-08-14 | 13F | Riggs Asset Managment Co. Inc. | 0 | -100.00 | 0 | |||||
| 2025-08-14 | 13F | Goldman Sachs Group Inc | 29,753 | 2.03 | 1,515 | 13.57 | ||||
| 2025-07-31 | 13F | FSM Wealth Advisors, LLC | 4,386 | 224 | ||||||
| 2025-07-17 | 13F | Hanson & Doremus Investment Management | 26,511 | 0.00 | 1 | 0.00 | ||||
| 2025-07-24 | 13F | Forefront Analytics, LLC | 0 | -100.00 | 0 | |||||
| 2025-08-12 | 13F | Foster Dykema Cabot & Partners, Llc | 114,546 | -0.57 | 5,834 | 10.68 | ||||
| 2025-08-07 | 13F | WESCAP Management Group, Inc. | 24,803 | 21.97 | 1,263 | 35.81 | ||||
| 2025-07-18 | 13F | Institute for Wealth Management, LLC. | 131,654 | -2.16 | 6,705 | 8.94 | ||||
| 2025-08-14 | 13F | CIBC World Markets Inc. | 11,543 | -3.83 | 588 | 6.92 | ||||
| 2025-07-25 | 13F | Northwest Capital Management Inc | 0 | -100.00 | 0 | |||||
| 2025-08-08 | 13F | Bailard, Inc. | 15,616 | -51.74 | 795 | -46.28 | ||||
| 2025-08-14 | 13F | Fiduciary Trust Co | 5,770 | -40.43 | 294 | -33.86 | ||||
| 2025-08-14 | 13F | Partners Capital Investment Group, Llp | 192,077 | -77.12 | 9,782 | -74.53 | ||||
| 2025-08-04 | 13F | Human Investing LLC | 10,329 | 5.52 | 526 | 17.67 | ||||
| 2025-08-14 | 13F | IHT Wealth Management, LLC | 5,558 | -7.92 | 283 | 2.54 | ||||
| 2025-07-28 | 13F | BRYN MAWR TRUST Co | 4,500 | -60.00 | 229 | -55.45 | ||||
| 2025-07-22 | 13F | Capital City Trust Co/fl | 24,183 | -0.49 | 1,232 | 10.80 | ||||
| 2025-08-12 | 13F | Steward Partners Investment Advisory, Llc | 1,755 | 0.00 | 89 | 11.25 | ||||
| 2025-05-15 | 13F | Two Sigma Investments, Lp | 0 | -100.00 | 0 | |||||
| 2025-08-11 | 13F | TD Waterhouse Canada Inc. | 1,297 | 3.43 | 66 | 14.04 | ||||
| 2025-08-11 | 13F | Western Wealth Management, LLC | 14,498 | 2.46 | 738 | 14.06 | ||||
| 2025-07-01 | 13F | Stonehearth Capital Management, LLC | 72,472 | 4.08 | 3,691 | 15.86 | ||||
| 2025-08-11 | 13F | Johnson Financial Group, LLC | 4,077 | 208 | ||||||
| 2025-08-14 | 13F | Bank Of America Corp /de/ | 846,160 | 6.65 | 43,095 | 18.72 | ||||
| 2025-08-14 | 13F | Comerica Bank | 6,619 | -3.39 | 337 | 7.67 | ||||
| 2025-08-06 | 13F | Prospera Financial Services Inc | 7,420 | 0.00 | 378 | 11.50 | ||||
| 2025-08-14 | 13F | Smartleaf Asset Management LLC | 690 | -3.23 | 35 | 6.25 | ||||
| 2025-07-21 | 13F | Ameritas Advisory Services, LLC | 321 | 16 | ||||||
| 2025-07-23 | 13F | Hager Investment Management Services, Llc | 770 | 1.72 | 39 | 14.71 | ||||
| 2025-07-18 | 13F | Truist Financial Corp | 18,625 | -28.54 | 949 | -20.47 | ||||
| 2025-07-29 | 13F | Harbor Asset Planning, Inc. | 531 | 27 | ||||||
| 2025-08-14 | 13F/A | Skopos Labs, Inc. | 1,084 | 55 | ||||||
| 2025-08-26 | 13F/A | Thrivent Financial For Lutherans | 9,171 | 0 | ||||||
| 2025-07-30 | 13F | MEMBERS Trust Co | 3,930 | 200 | ||||||
| 2025-07-29 | 13F | TFC Financial Management | 308 | 0.33 | 16 | 7.14 | ||||
| 2025-07-09 | 13F | Affinity Capital Advisors, LLC | 19,830 | -1.02 | 1,010 | 14.92 | ||||
| 2025-07-23 | 13F | Northern Financial Advisors Inc | 5,892 | 0.26 | 300 | 11.94 | ||||
| 2025-08-12 | 13F | Jpmorgan Chase & Co | 26,971 | 13.85 | 1,374 | 26.78 | ||||
| 2025-08-14 | 13F | Warren Averett Asset Management, LLC | 4,311 | 220 | ||||||
| 2025-07-15 | 13F | Evanson Asset Management, LLC | 5,648 | 0.00 | 288 | 11.24 | ||||
| 2025-07-16 | 13F | Essex Financial Services, Inc. | 24,553 | 0.03 | 1,250 | 11.41 | ||||
| 2025-08-04 | 13F | Bristlecone Advisors, LLC | 327 | 0.00 | 17 | 14.29 | ||||
| 2025-08-05 | 13F | Simplex Trading, Llc | 1 | 0 | ||||||
| 2025-08-18 | 13F | Geneos Wealth Management Inc. | 86 | 7.50 | 4 | 33.33 | ||||
| 2025-08-12 | 13F | Walled Lake Planning & Wealth Management, Llc | 7,308 | 0.26 | 372 | 11.71 | ||||
| 2025-07-30 | 13F | Evermay Wealth Management Llc | 2,310 | 0.00 | 118 | 11.43 | ||||
| 2025-07-22 | 13F | Rockingstone Advisors LLC | 4,510 | 0.00 | 230 | 11.17 | ||||
| 2025-08-13 | 13F | Jones Financial Companies Lllp | 19,965 | 21.68 | 1,009 | 35.25 | ||||
| 2025-08-13 | 13F | Johnson Financial Group, Inc. | 2,826 | -17.66 | 144 | -8.92 | ||||
| 2025-08-13 | 13F | Fiduciary Group LLC | 9,972 | 6.25 | 508 | 18.18 | ||||
| 2025-07-17 | 13F | Investment Research & Advisory Group, Inc. | 2,920 | 2.64 | 1,804 | 13.39 | ||||
| 2025-08-14 | 13F | Operose Advisors LLC | 13,536 | -14.76 | 689 | -5.10 | ||||
| 2025-07-28 | 13F | Harbour Investments, Inc. | 91,072 | 0.60 | 4,638 | 12.00 | ||||
| 2025-08-04 | 13F | Spinnaker Trust | 298,944 | -0.76 | 15,225 | 10.48 | ||||
| 2025-08-06 | 13F | Atlantic Union Bankshares Corp | 5,419 | 276 | ||||||
| 2025-07-31 | 13F | Trademark Financial Management, LLC | 7,785 | 0.00 | 396 | 11.24 | ||||
| 2025-08-13 | 13F | Brown Advisory Inc | 5,467 | 0.00 | 278 | 11.20 | ||||
| 2025-08-14 | 13F | Sei Investments Co | 138,231 | 2.48 | 7,040 | 14.08 | ||||
| 2025-08-14 | 13F | GWM Advisors LLC | 4,627 | -2.75 | 236 | 8.29 | ||||
| 2025-08-13 | 13F | Baird Financial Group, Inc. | 44,208 | -11.68 | 2,252 | -1.70 | ||||
| 2025-08-04 | 13F | Creative Financial Designs Inc /adv | 219 | 0.00 | 11 | 10.00 | ||||
| 2025-08-07 | 13F | Allworth Financial LP | 1,656 | 0.06 | 84 | 13.51 | ||||
| 2025-08-08 | 13F | Sensible Financial Planning & Management, LLC. | 385,557 | -0.34 | 19,636 | 10.95 | ||||
| 2025-08-14 | 13F | Betterment LLC | 1,934,222 | 0.01 | 99 | 11.36 | ||||
| 2025-08-12 | 13F | Ameritas Investment Partners, Inc. | 15,169 | 0.30 | 773 | 11.72 | ||||
| 2025-08-13 | 13F | North Berkeley Wealth Management, LLC | 7,098 | 27.73 | 362 | 42.13 | ||||
| 2025-07-08 | 13F | Parallel Advisors, LLC | 1,200 | -28.19 | 61 | -19.74 | ||||
| 2025-07-23 | 13F | Ironwood Financial, llc | 6,293 | 0.00 | 288 | 0.00 | ||||
| 2025-07-10 | 13F | Focus Financial Network, Inc. | 14,343 | -15.03 | 730 | -5.44 | ||||
| 2025-07-25 | 13F | Atria Wealth Solutions, Inc. | 0 | -100.00 | 0 | |||||
| 2025-07-15 | 13F | Boyd Wealth Management, LLC | 37,365 | 19.67 | 1,903 | 33.19 | ||||
| 2025-08-14 | 13F | Stifel Financial Corp | 12,875 | -76.94 | 656 | -74.35 | ||||
| 2025-08-13 | 13F | Scotia Capital Inc. | 4,447 | 0.00 | 226 | 11.33 | ||||
| 2025-07-22 | 13F | Wealthcare Advisory Partners LLC | 5,465 | -7.78 | 278 | 2.58 | ||||
| 2025-07-11 | 13F | Farther Finance Advisors, LLC | 627 | 84.96 | 32 | 106.67 | ||||
| 2025-08-05 | 13F | Bridgewater Advisors Inc. | 19,231 | -35.80 | 1,004 | -26.36 | ||||
| 2025-08-12 | 13F | Seeds Investor Llc | 14,541 | 741 | ||||||
| 2025-08-12 | 13F | Fortis Capital Management LLC | 31,893 | -44.38 | 1,624 | -38.09 | ||||
| 2025-08-14 | 13F | Moneta Group Investment Advisors Llc | 12,649 | -0.12 | 644 | 11.23 | ||||
| 2025-07-22 | 13F | Gemmer Asset Management LLC | 407,142 | 1.68 | 20,736 | 13.19 | ||||
| 2025-07-24 | 13F | Eastern Bank | 3,411 | 174 | ||||||
| 2025-08-14 | 13F | Jane Street Group, Llc | 11,024 | 561 | ||||||
| 2025-05-13 | 13F | Keystone Financial Group | 0 | -100.00 | 0 | |||||
| 2025-07-15 | 13F | Ballentine Partners, LLC | 4,734 | -13.14 | 241 | -3.21 | ||||
| 2025-08-14 | 13F | Royal Bank Of Canada | 218,923 | 4.10 | 11,150 | 15.89 | ||||
| 2025-08-14 | 13F | Mariner, LLC | 89,228 | -2.38 | 4,544 | 8.68 | ||||
| 2025-07-31 | 13F | Washington Trust Advisors, Inc. | 2,544 | 0.00 | 130 | 11.21 | ||||
| 2025-08-05 | 13F | Plante Moran Financial Advisors, LLC | 109 | 6 | ||||||
| 2025-08-08 | 13F | Allianz Se | 273,508 | 0.00 | 13,930 | 11.33 | ||||
| 2025-08-05 | 13F | Tiaa Trust, National Association | 6,186 | 0.00 | 315 | 11.31 | ||||
| 2025-08-08 | 13F | Avantax Advisory Services, Inc. | 0 | -100.00 | 0 | |||||
| 2025-08-14 | 13F | Appaloosa Lp | Put | 0 | -100.00 | 0 | ||||
| 2025-07-31 | 13F | AlTi Global, Inc. | 23,289 | -2.78 | 1,186 | 8.31 | ||||
| 2025-04-18 | 13F | Wolf Group Capital Advisors | 0 | -100.00 | 0 | -100.00 | ||||
| 2025-08-13 | 13F | Oxler Private Wealth LLC | 36,981 | 0.20 | 1,883 | 11.55 | ||||
| 2025-08-14 | 13F | CoreCap Advisors, LLC | 356 | 18 | ||||||
| 2025-08-13 | 13F | Capital Analysts, Inc. | 1,809 | 0.00 | 0 | |||||
| 2025-07-29 | 13F | Horst & Graben Wealth Management LLC | 8,747 | -3.23 | 446 | 7.75 | ||||
| 2025-07-17 | 13F | Enclave Advisors LLC | 12,705 | -2.28 | 647 | 8.92 | ||||
| 2025-07-30 | 13F | Crewe Advisors LLC | 385 | 0.26 | 20 | 11.76 | ||||
| 2025-08-12 | 13F | Choate Investment Advisors | 2,516,995 | -1.34 | 128,191 | 9.84 | ||||
| 2025-08-08 | 13F | Smithfield Trust Co | 4,647 | 0.00 | 0 | |||||
| 2025-05-15 | 13F | Glen Eagle Advisors, LLC | 0 | -100.00 | 0 | -100.00 | ||||
| 2025-08-06 | 13F | Commonwealth Equity Services, Llc | 143,825 | 8.61 | 7 | 16.67 | ||||
| 2025-07-14 | 13F | Clear Harbor Asset Management, LLC | 27,645 | 0.00 | 1,408 | 11.31 | ||||
| 2025-07-15 | 13F | Retirement Income Solutions, Inc | 178,080 | -6.83 | 9,070 | 3.72 | ||||
| 2025-08-11 | 13F | United Capital Financial Advisers, Llc | 27,839 | 0.17 | 1,418 | 11.49 | ||||
| 2025-07-11 | 13F/A | Umb Bank N A/mo | 4,680 | 0.00 | 238 | 11.21 | ||||
| 2025-08-12 | 13F | Proequities, Inc. | 0 | 0 | ||||||
| 2025-08-12 | 13F | TCTC Holdings, LLC | 3,000 | 0.00 | 153 | 10.95 | ||||
| 2025-07-30 | 13F | Bleakley Financial Group, LLC | 14,342 | -0.31 | 730 | 10.94 | ||||
| 2025-08-08 | 13F | JFG Wealth Management, LLC | 14,234 | -75.56 | 725 | -72.82 | ||||
| 2025-08-07 | 13F | Commerce Bank | 15,330 | -8.40 | 781 | 1.96 | ||||
| 2025-08-05 | 13F | Bank Of Montreal /can/ | 8,295 | 422 | ||||||
| 2025-08-14 | 13F | UBS Group AG | 98,152 | -2.40 | 4,999 | 8.65 | ||||
| 2025-07-17 | 13F | Sound Income Strategies, LLC | 202 | 10 | ||||||
| 2025-08-01 | 13F | Envestnet Asset Management Inc | 32,578 | -19.91 | 1,659 | -10.81 | ||||
| 2025-08-11 | 13F | Bradley Foster & Sargent Inc/ct | 19,115 | -28.35 | 974 | -20.25 | ||||
| 2025-08-06 | 13F | AE Wealth Management LLC | 1,920 | 0.00 | 98 | 11.49 | ||||
| 2025-07-21 | 13F | Kennebec Savings Bank | 1,823 | 0.00 | 93 | 10.84 | ||||
| 2025-08-08 | 13F | IMA Wealth, Inc. | 13,307 | 0.26 | 678 | 11.53 | ||||
| 2025-07-23 | 13F | Values Added Financial LLC | 11,537 | -13.75 | 588 | -3.93 | ||||
| 2025-07-24 | 13F | Blair William & Co/il | 1,128 | 0.00 | 57 | 11.76 | ||||
| 2025-08-14 | 13F | Federation des caisses Desjardins du Quebec | 0 | -100.00 | 0 | |||||
| 2025-08-05 | 13F | Gould Asset Management Llc /ca/ | 173,579 | -1.99 | 8,840 | 9.11 | ||||
| 2025-08-14 | 13F | Bragg Financial Advisors, Inc | 19,931 | -1.47 | 1,015 | 9.73 | ||||
| 2025-08-14 | 13F | Qube Research & Technologies Ltd | 0 | -100.00 | 0 | |||||
| 2025-08-08 | 13F | Citizens Financial Group Inc/ri | 31,200 | 0.00 | 1,589 | 11.35 | ||||
| 2025-07-29 | 13F | Chicago Partners Investment Group LLC | 8,654 | 0.00 | 451 | 12.78 | ||||
| 2025-07-09 | 13F | Alesco Advisors Llc | 23,180 | 0.56 | 1,181 | 11.95 | ||||
| 2025-08-05 | 13F | Dunhill Financial, LLC | 12 | 1 | ||||||
| 2025-08-14 | 13F | Ameriprise Financial Inc | 185,338 | 8.05 | 9,441 | 19.74 | ||||
| 2025-08-14 | 13F | Great Valley Advisor Group, Inc. | 8,090 | 412 | ||||||
| 2025-08-11 | 13F | Rothschild Investment Llc | 1,920 | 0.00 | 98 | 11.49 | ||||
| 2025-05-15 | 13F | Colton Groome Financial Advisors, Llc | 0 | -100.00 | 0 | |||||
| 2025-08-05 | 13F | Bank of New York Mellon Corp | 1,426,657 | 0.30 | 72,660 | 11.66 | ||||
| 2025-08-11 | 13F | Tidemark, LLC | 2,793 | -20.92 | 142 | -11.80 | ||||
| 2025-07-18 | 13F | First Pacific Financial | 7,448 | 0.16 | 379 | 11.47 | ||||
| 2025-08-14 | 13F | West Coast Financial LLC | 0 | -100.00 | 0 | |||||
| 2025-08-15 | 13F | Koesten, Hirschmann & Crabtree, INC. | 0 | -100.00 | 0 | |||||
| 2025-07-10 | 13F | Burns J W & Co Inc/ny | 10,500 | 3.96 | 535 | 15.58 | ||||
| 2025-07-15 | 13F | Maseco Llp | 36,672 | 1,863 | ||||||
| 2025-07-24 | 13F | Us Bancorp \de\ | 5,459 | 0.00 | 278 | 11.65 | ||||
| 2025-08-08 | 13F | eCIO, Inc. | 23,356 | 0.26 | 1,190 | 11.64 | ||||
| 2025-08-11 | 13F | Citigroup Inc | 2,550 | 0.00 | 130 | 11.21 | ||||
| 2025-08-14 | 13F/A | Rockefeller Capital Management L.P. | 158,132 | -37.95 | 8,054 | -30.93 | ||||
| 2025-08-14 | 13F | Holt Capital Advisors, L.L.C. dba Holt Capital Partners, L.P. | 5,331 | -18.37 | 272 | -9.06 | ||||
| 2025-08-06 | 13F | Golden State Wealth Management, LLC | 7,779 | -2.27 | 396 | 8.79 | ||||
| 2025-08-05 | 13F | Sigma Planning Corp | 8,396 | 18.54 | 428 | 31.79 | ||||
| 2025-08-04 | 13F | Hantz Financial Services, Inc. | 1,084 | 0 | ||||||
| 2025-08-15 | 13F | Equitable Holdings, Inc. | 4,186 | 213 | ||||||
| 2025-07-17 | 13F | Nelson, Van Denburg & Campbell Wealth Management Group, LLC | 11,579 | 590 | ||||||
| 2025-07-28 | 13F | Axxcess Wealth Management, Llc | 13,513 | 3.44 | 688 | 15.24 | ||||
| 2025-08-15 | 13F | Morgan Stanley | 413,854 | 2.50 | 21,078 | 14.10 | ||||
| 2025-09-04 | 13F/A | Advisor Group Holdings, Inc. | 32,513 | -17.28 | 1,656 | -7.90 | ||||
| 2025-08-18 | 13F/A | National Bank Of Canada /fi/ | 1,392 | 71 | ||||||
| 2025-08-05 | 13F | Westside Investment Management, Inc. | 300 | 0.00 | 15 | 15.38 | ||||
| 2025-07-17 | 13F | Cornerstone Wealth Advisors, Inc. | 8,204 | 1.48 | 418 | 13.01 | ||||
| 2025-07-08 | 13F | Morris Retirement Advisors, LLC | 7,227 | 32.63 | 368 | 47.79 | ||||
| 2025-08-14 | 13F | Foronjy Financial Llc | 5,158 | 263 | ||||||
| 2025-08-13 | 13F | Milestone Investment Advisors LLC | 64,048 | -6.31 | 3,262 | 4.29 | ||||
| 2025-05-12 | 13F | Sandy Spring Bank | 5,419 | 0.00 | 248 | -5.00 | ||||
| 2025-08-07 | 13F | Rollins Financial Advisors, LLC | 8,079 | 0.00 | 411 | 11.38 | ||||
| 2025-08-06 | 13F | Agf Management Ltd | 47,625 | 1.71 | 2,426 | 13.21 | ||||
| 2025-08-07 | 13F | PFG Advisors | 47,075 | -3.99 | 2,398 | 6.87 | ||||
| 2025-07-29 | 13F | Signature Estate & Investment Advisors Llc | 5,331 | -3.81 | 272 | 7.11 | ||||
| 2025-07-23 | 13F | Dohj, Llc | 7,804 | 0.00 | 344 | -3.92 | ||||
| 2025-07-28 | 13F | Windmill Hill Asset Management Ltd | 5,932,425 | 0.00 | 302,138 | 11.32 | ||||
| 2025-08-06 | 13F | Savant Capital, LLC | 4,455 | 0.00 | 227 | 11.33 | ||||
| 2025-08-13 | 13F | Cresset Asset Management, LLC | 18,481 | 0.00 | 941 | 11.36 | ||||
| 2025-07-08 | 13F | Nbc Securities, Inc. | 960 | 0.00 | 0 | |||||
| 2025-08-13 | 13F | Ally Invest Advisors Inc. | 11,397 | -14.73 | 580 | -5.07 | ||||
| 2025-08-14 | 13F | Citadel Advisors Llc | 9,392 | 478 | ||||||
| 2025-08-15 | 13F | CI Private Wealth, LLC | 60,822 | 307.05 | 3,981 | 410.26 | ||||
| 2025-04-15 | 13F | Accurate Wealth Management, LLC | 0 | -100.00 | 0 | |||||
| 2025-08-14 | 13F | Douglass Winthrop Advisors, LLC | 8,000 | 0.00 | 407 | 11.20 | ||||
| 2025-07-10 | 13F | Sovran Advisors, LLC | 7,690 | 0.00 | 392 | 17.77 | ||||
| 2025-07-15 | 13F | Alpha Omega Wealth Management LLC | 4,550 | 0.00 | 232 | 11.06 | ||||
| 2025-07-24 | 13F | Trevian Wealth Management LLC | 15,589 | 0.00 | 1 | |||||
| 2025-07-17 | 13F | Willow Creek Wealth Management Inc. | 4,417 | -0.92 | 225 | 10.34 | ||||
| 2025-08-07 | 13F | Rathbone Brothers plc | 336,612 | -19.68 | 17,144 | -10.59 | ||||
| 2025-07-22 | 13F | 4Thought Financial Group Inc. | 4,942 | 5.33 | 252 | 17.29 | ||||
| 2025-07-31 | 13F | Sentinel Trust Co Lba | 23,805 | 6.37 | 1 | 0.00 | ||||
| 2025-08-11 | 13F | Farrow Financial Inc. | 16,100 | 0.00 | 820 | 11.28 | ||||
| 2025-07-23 | 13F | Sachetta, LLC | 130 | 0.00 | 7 | 20.00 | ||||
| 2025-08-11 | 13F | HighTower Advisors, LLC | 39,267 | -1.56 | 2,000 | 9.53 | ||||
| 2025-08-13 | 13F/A | Matrix Asset Advisors Inc/ny | 13,348 | 0.00 | 680 | 11.31 | ||||
| 2025-07-25 | 13F | PrairieView Partners, LLC | 798 | 0.00 | 0 | |||||
| 2025-07-15 | 13F | North Star Investment Management Corp. | 34 | 0.00 | 2 | 0.00 | ||||
| 2025-08-07 | 13F | Resources Investment Advisors, LLC. | 31,422 | -4.99 | 1,600 | 5.75 | ||||
| 2025-07-16 | 13F | Dakota Wealth Management | 4,619 | 0.00 | 235 | 11.37 | ||||
| 2025-08-15 | 13F | Urban Financial Advisory Corp | 0 | -100.00 | 0 | |||||
| 2025-07-29 | 13F | Crux Wealth Advisors | 85,108 | 4,335 | ||||||
| 2025-07-22 | 13F | Financial Insights, Inc. | 7,266 | 370 | ||||||
| 2025-07-08 | 13F | First National Corp /ma/ /adv | 22,986 | 3.51 | 1,171 | 15.27 | ||||
| 2025-07-10 | 13F | Wealth Enhancement Advisory Services, Llc | 17,595 | -3.94 | 905 | 8.00 | ||||
| 2025-08-14 | 13F | Mml Investors Services, Llc | 27,103 | -0.68 | 1 | 0.00 | ||||
| 2025-08-14 | 13F | Fmr Llc | 20,342 | -27.62 | 1,036 | -19.38 | ||||
| 2025-08-14 | 13F | Evergreen Capital Management Llc | 5,298 | -66.04 | 270 | -62.27 | ||||
| 2025-07-30 | 13F | Wbh Advisory Inc | 5,454 | 0.00 | 278 | 11.24 | ||||
| 2025-07-18 | 13F | PFG Investments, LLC | 25,603 | -2.28 | 1,304 | 8.76 | ||||
| 2025-08-07 | 13F | Flagship Wealth Advisors, Llc | 2,032 | -2.59 | 103 | 8.42 | ||||
| 2025-07-31 | 13F | Wealthfront Advisers Llc | 25,712 | 5.78 | 1,310 | 17.72 | ||||
| 2025-08-14 | 13F | Wells Fargo & Company/mn | 85,546 | 17.14 | 4,357 | 30.38 | ||||
| 2025-08-13 | 13F | Northwestern Mutual Wealth Management Co | 4,052 | 40.74 | 206 | 57.25 | ||||
| 2025-08-11 | 13F | CBIZ Investment Advisory Services, LLC | 8,470 | 0.26 | 431 | 11.66 | ||||
| 2025-08-11 | 13F | Highview Capital Management LLC/DE/ | 5,777 | 2.63 | 294 | 14.40 | ||||
| 2025-08-18 | 13F | Pacific Center for Financial Services | 6,320 | 0.13 | 322 | 11.46 | ||||
| 2025-08-05 | 13F | Key FInancial Inc | 4,540 | 0.00 | 231 | 11.59 | ||||
| 2025-08-12 | 13F | LPL Financial LLC | 464,003 | -1.83 | 23,632 | 9.28 | ||||
| 2025-08-08 | 13F | Pnc Financial Services Group, Inc. | 503,283 | 4.92 | 25,632 | 16.80 | ||||
| 2025-05-12 | 13F | Independent Advisor Alliance | 0 | -100.00 | 0 | |||||
| 2025-08-08 | 13F | Cetera Investment Advisers | 15,087 | -14.00 | 768 | -4.24 | ||||
| 2025-07-25 | 13F | Apollon Wealth Management, LLC | 4,646 | 0.04 | 237 | 11.32 | ||||
| 2025-08-08 | 13F | Creative Planning | 45,144 | 78.87 | 2,299 | 99.22 | ||||
| 2025-08-14 | 13F | EP Wealth Advisors, Inc. | 17,736 | 6.01 | 903 | 18.04 | ||||
| 2025-07-14 | 13F | AdvisorNet Financial, Inc | 1,071 | 5.93 | 55 | 17.39 | ||||
| 2025-07-15 | 13F | Cranbrook Wealth Management, LLC | 540 | 0.00 | 28 | 12.50 | ||||
| 2025-08-14 | 13F | Susquehanna International Group, Llp | 22,565 | 200.59 | 1,149 | 234.99 | ||||
| 2025-07-18 | 13F | Marino, Stram & Associates Llc | 42,335 | 17.28 | 2,156 | 30.59 | ||||
| 2025-08-11 | 13F | Bell Investment Advisors, Inc | 20,617 | -1.89 | 1,050 | 9.26 | ||||
| 2025-08-12 | 13F | Pathstone Holdings, LLC | 333,841 | -0.70 | 17,003 | 10.55 | ||||
| 2025-08-12 | 13F | Atlas Capital Advisors Llc | 325 | 0.00 | 17 | 14.29 | ||||
| 2025-07-25 | 13F | NorthRock Partners, LLC | 7,154 | 0.00 | 364 | 11.31 | ||||
| 2025-08-12 | 13F | SRS Capital Advisors, Inc. | 26,762 | 1,363 | ||||||
| 2025-08-14 | 13F | Raymond James Financial Inc | 32,878 | 7.11 | 1,674 | 19.23 | ||||
| 2025-08-14 | 13F | Mercer Global Advisors Inc /adv | 7,020 | -1.58 | 358 | 9.51 | ||||
| 2025-07-11 | 13F | Grove Bank & Trust | 100 | 5 | ||||||
| 2025-08-18 | 13F | N.E.W. Advisory Services LLC | 5,894 | 0.27 | 300 | 11.94 | ||||
| 2025-08-13 | 13F | Twin Peaks Wealth Advisors, LLC | 262 | 14 |