Mga Batayang Estadistika
| Pemilik Institusional | 345 total, 344 long only, 0 short only, 1 long/short - change of 3.27% MRQ |
| Alokasi Portofolio Rata-rata | 0.1122 % - change of 7.61% MRQ |
| Saham Institusional (Jangka Panjang) | 93,879,102 (ex 13D/G) - change of 6.42MM shares 7.33% MRQ |
| Nilai Institusional (Jangka Panjang) | $ 1,407,856 USD ($1000) |
Kepemilikan Institusional dan Pemegang Saham
Takeda Pharmaceutical Company Limited - Depositary Receipt (Common Stock) (US:TAK) memiliki 345 pemilik institusional dan pemegang saham yang telah mengajukan formulir 13D/G atau 13F kepada Komisi Bursa Efek (Securities Exchange Commission/SEC). Lembaga-lembaga ini memegang total 93,879,102 saham. Pemegang saham terbesar meliputi Capital Research Global Investors, AMRMX - AMERICAN MUTUAL FUND Class A, Morgan Stanley, Goldman Sachs Group Inc, Fmr Llc, UBS Group AG, Brandes Investment Partners, Lp, BlackRock, Inc., Renaissance Technologies Llc, and Millennium Management Llc .
Struktur kepemilikan institusional Takeda Pharmaceutical Company Limited - Depositary Receipt (Common Stock) (NYSE:TAK) menunjukkan posisi terkini di perusahaan oleh institusi dan dana, serta perubahan terbaru dalam ukuran posisi. Pemegang saham utama dapat mencakup investor individu, reksa dana, dana lindung nilai, atau institusi. Jadwal 13D menunjukkan bahwa investor memegang (atau pernah memegang) lebih dari 5% saham perusahaan dan bermaksud (atau pernah bermaksud) untuk secara aktif mengejar perubahan strategi bisnis. Jadwal 13G menunjukkan investasi pasif lebih dari 5%.
The share price as of September 5, 2025 is 15.40 / share. Previously, on September 6, 2024, the share price was 14.81 / share. This represents an increase of 3.98% over that period.

Skor Sentimen Dana
Skor Sentimen Dana (sebelumnya dikenal sebagai Skor Akumulasi Kepemilikan) menemukan saham-saham yang paling banyak dibeli oleh dana. Ini adalah hasil dari model kuantitatif multi-faktor yang canggih yang mengidentifikasi perusahaan dengan tingkat akumulasi institusional tertinggi. Model penilaian menggunakan kombinasi dari total peningkatan pemilik yang diungkapkan, perubahan dalam alokasi portofolio pada pemilik tersebut, dan metrik lainnya. Angka berkisar dari 0 hingga 100, dengan angka yang lebih tinggi menunjukkan tingkat akumulasi yang lebih tinggi dibandingkan dengan perusahaan sejenisnya, dan 50 adalah rata-ratanya.
Frekuensi Pembaruan: Setiap Hari
Lihat Ownership Explorer, yang menyediakan daftar perusahaan dengan peringkat tertinggi.
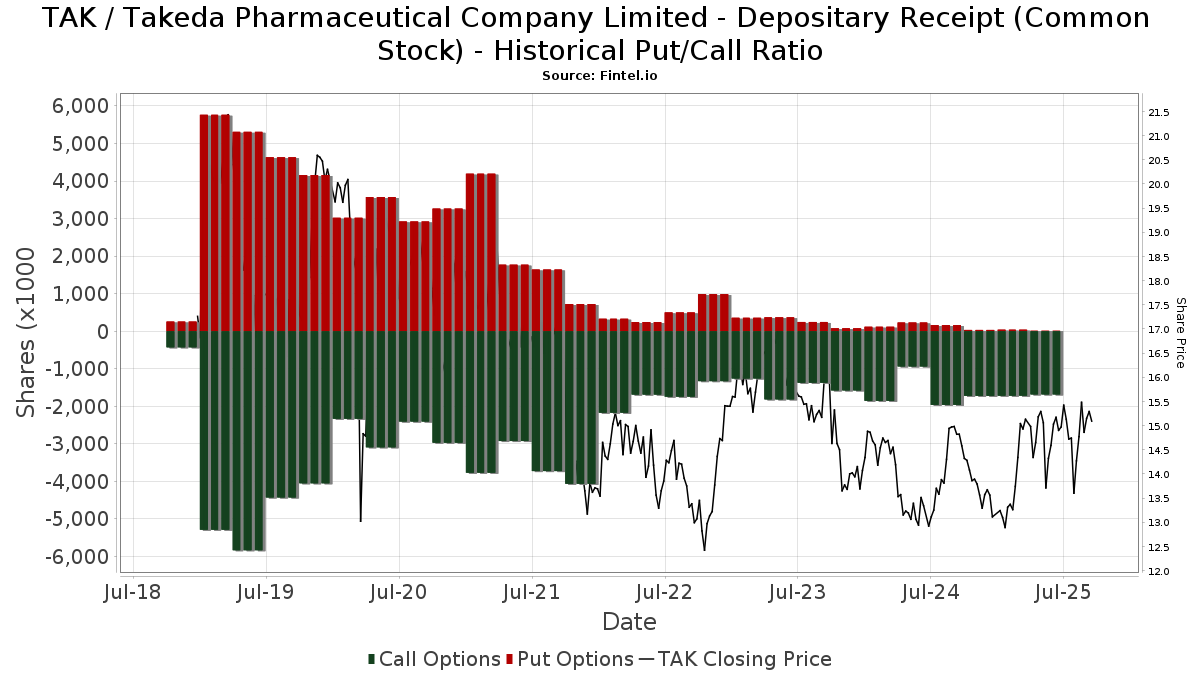
Rasio Put/Call Institusional
Selain melaporkan isu ekuitas dan utang standar, institusi dengan aset di bawah manajemen lebih dari 100 juta dolar AS juga harus mengungkapkan kepemilikan opsi put dan call mereka. Karena opsi put umumnya menunjukkan sentimen negatif, dan opsi call menunjukkan sentimen positif, kita dapat mengetahui sentimen institusional secara keseluruhan dengan memplot rasio put terhadap call. Grafik di sebelah kanan memplot rasio put/call historis untuk instrumen ini.
Menggunakan Rasio Put/Call sebagai indikator sentimen investor mengatasi salah satu kekurangan utama dari penggunaan total kepemilikan institusional, yaitu sejumlah besar aset yang dikelola diinvestasikan secara pasif untuk melacak indeks. Dana yang dikelola secara pasif biasanya tidak membeli opsi, sehingga indikator rasio put/call lebih akurat dalam melacak sentimen dana yang dikelola secara aktif.
Pengajuan 13F dan NPORT
Detail pada pengajuan 13F tersedia gratis. Detail pada pengajuan NP memerlukan keanggotaan premium. Baris berwarna hijau menunjukkan posisi baru. Baris berwarna merah menunjukkan posisi yang sudah ditutup. Klik tautan ini ikon untuk melihat riwayat transaksi selengkapnya.
Tingkatkan
untuk membuka data premium dan mengekspor ke Excel ![]() .
.
| Tanggal File | Sumber | Investor | Ketik | Presyo ng Avg (Silangan) |
Saham | Δ Saham (%) |
Dilaporkan Nilai ($1000) |
Nilai Δ (%) |
Alokasi Port (%) |
|
|---|---|---|---|---|---|---|---|---|---|---|
| 2025-08-14 | 13F | Fmr Llc | 4,101,661 | 6.12 | 63,412 | 10.33 | ||||
| 2025-08-14 | 13F | Jain Global LLC | 138,146 | 2,136 | ||||||
| 2025-07-15 | 13F | Td Private Client Wealth Llc | 253 | -20.19 | 4 | -25.00 | ||||
| 2025-08-25 | 13F/A | Neuberger Berman Group LLC | 34,242 | 11.50 | 529 | 16.01 | ||||
| 2025-08-14 | 13F | Wells Fargo & Company/mn | 1,013,022 | 4.67 | 15,661 | 8.82 | ||||
| 2025-08-14 | 13F | Vident Advisory, LLC | 78,329 | 277.82 | 1,211 | 292.86 | ||||
| 2025-07-22 | 13F | Checchi Capital Advisers, LLC | 12,136 | 1.88 | 188 | 5.65 | ||||
| 2025-05-15 | 13F | Soleus Capital Management, L.P. | 0 | -100.00 | 0 | |||||
| 2025-05-15 | 13F | Cubist Systematic Strategies, LLC | 0 | -100.00 | 0 | |||||
| 2025-08-12 | 13F | MAI Capital Management | 5,177 | 212.43 | 80 | 233.33 | ||||
| 2025-07-25 | 13F | Envestnet Portfolio Solutions, Inc. | 15,112 | 29.14 | 234 | 33.91 | ||||
| 2025-08-08 | 13F | Financial Gravity Companies, Inc. | 0 | -100.00 | 0 | |||||
| 2025-08-14 | 13F | Corient IA LLC | 40,000 | 0.00 | 618 | 4.04 | ||||
| 2025-08-14 | 13F | Engineers Gate Manager LP | 13,562 | -8.30 | 210 | -4.57 | ||||
| 2025-07-29 | 13F | Arista Wealth Management, LLC | 10,961 | 169 | ||||||
| 2025-08-08 | 13F | Hartland & Co., LLC | 25 | -78.99 | 0 | -100.00 | ||||
| 2025-07-24 | 13F | Ronald Blue Trust, Inc. | 14,108 | 45.07 | 218 | 51.39 | ||||
| 2025-08-05 | 13F | Tsfg, Llc | 16,019 | -28.96 | 0 | |||||
| 2025-08-26 | NP | FVD - First Trust Value Line Dividend Index Fund This fund is a listed as child fund of First Trust Advisors Lp and if that institution has disclosed ownership in this security, then these positions will not be double counted when calculating total shares and total value | 2,562,916 | -5.75 | 39,623 | -2.01 | ||||
| 2025-07-29 | 13F | Angeles Wealth Management, Llc | 12,950 | 200 | ||||||
| 2025-07-28 | 13F | Sagespring Wealth Partners, Llc | 13,758 | 26.45 | 213 | 31.68 | ||||
| 2025-08-14 | 13F | UBS Group AG | 4,024,646 | 129.38 | 62,221 | 138.49 | ||||
| 2025-05-15 | 13F | Janus Henderson Group Plc | 0 | -100.00 | 0 | |||||
| 2025-08-12 | 13F | Proequities, Inc. | 0 | 0 | ||||||
| 2025-07-08 | 13F | Nbc Securities, Inc. | 55,446 | -0.37 | 1 | |||||
| 2025-07-29 | 13F | Salomon & Ludwin, LLC | 41 | 1 | ||||||
| 2025-08-27 | 13F/A | Putney Financial Group LLC | 15 | 0 | ||||||
| 2025-08-14 | 13F | Axa S.a. | 2,862 | 0.00 | 44 | 4.76 | ||||
| 2025-08-12 | 13F | BlackRock, Inc. | 3,550,877 | 34.97 | 54,897 | 40.33 | ||||
| 2025-08-13 | 13F | Arrowstreet Capital, Limited Partnership | 1,218,690 | -12.98 | 18,841 | -9.53 | ||||
| 2025-07-14 | 13F | Park Avenue Securities Llc | 34,363 | 7.96 | 1 | |||||
| 2025-07-16 | 13F | Five Oceans Advisors | 12,521 | 1.96 | 194 | 6.04 | ||||
| 2025-08-14 | 13F | Sunbelt Securities, Inc. | 1,987 | 427.06 | 26 | 420.00 | ||||
| 2025-08-18 | 13F | Rexford Capital Inc | 9,233 | 143 | ||||||
| 2025-08-13 | 13F | GeoWealth Management, LLC | 0 | -100.00 | 0 | |||||
| 2025-07-11 | 13F | Pinnacle Bancorp, Inc. | 1,195 | 0.00 | 18 | 5.88 | ||||
| 2025-07-29 | 13F | Beverly Hills Private Wealth, LLC | 22,704 | -8.37 | 351 | -4.89 | ||||
| 2025-07-14 | 13F | Abound Wealth Management | 20 | 25.00 | 0 | |||||
| 2025-08-13 | 13F | Congress Wealth Management LLC / DE / | 13,378 | 207 | ||||||
| 2025-08-08 | 13F | Creative Planning | 372,055 | 24.20 | 5,752 | 29.12 | ||||
| 2025-08-12 | 13F | LPL Financial LLC | 225,438 | 11.92 | 3,485 | 16.36 | ||||
| 2025-07-17 | 13F | HB Wealth Management, LLC | 12,899 | 199 | ||||||
| 2025-08-11 | 13F | Vanguard Group Inc | 101,870 | 0.00 | 1,575 | 3.96 | ||||
| 2025-08-11 | 13F | GW&K Investment Management, LLC | 504 | 0.00 | 0 | |||||
| 2025-07-28 | 13F | BRYN MAWR TRUST Co | 3,910 | 39.69 | 60 | 46.34 | ||||
| 2025-08-14 | 13F | Ameriprise Financial Inc | 264,092 | 210.75 | 4,083 | 223.20 | ||||
| 2025-07-29 | 13F | Harbor Asset Planning, Inc. | 235 | 4 | ||||||
| 2025-07-21 | 13F | Ameriflex Group, Inc. | 503 | 0.00 | 8 | 0.00 | ||||
| 2025-07-21 | 13F | Fortis Capital Advisors, LLC | 0 | -100.00 | 0 | |||||
| 2025-07-25 | 13F | Sequoia Financial Advisors, LLC | 98,050 | 51.78 | 1,516 | 57.81 | ||||
| 2025-07-24 | 13F | Us Bancorp \de\ | 112,474 | 6.07 | 1,739 | 10.28 | ||||
| 2025-07-31 | 13F | Carrera Capital Advisors | 139,145 | 2,153 | ||||||
| 2025-08-14 | 13F/A | Skopos Labs, Inc. | 28,122 | 130.96 | 435 | 139.78 | ||||
| 2025-03-17 | 13F/A | American Assets Investment Management, LLC | 0 | -100.00 | 0 | |||||
| 2025-07-28 | NP | AVDE - Avantis International Equity ETF This fund is a listed as child fund of American Century Companies Inc and if that institution has disclosed ownership in this security, then these positions will not be double counted when calculating total shares and total value | 316,924 | 9.16 | 4,763 | 13.87 | ||||
| 2025-08-13 | 13F | Federated Hermes, Inc. | 534,027 | -1.46 | 8,256 | 2.46 | ||||
| 2025-08-14 | 13F | Qube Research & Technologies Ltd | 349,661 | 19.05 | 5,406 | 23.77 | ||||
| 2025-07-29 | NP | SGLIX - SGI Global Equity Fund Class I Shares | 66,442 | -70.74 | 999 | -69.50 | ||||
| 2025-07-25 | 13F | Concord Wealth Partners | 20 | 0.00 | 0 | |||||
| 2025-05-15 | 13F | Hall Laurie J Trustee | 0 | -100.00 | 0 | |||||
| 2025-04-24 | 13F | Decker Retirement Planning Inc. | 0 | -100.00 | 0 | |||||
| 2025-07-29 | 13F | Private Trust Co Na | 1,035 | 0.00 | 16 | 6.67 | ||||
| 2025-08-13 | 13F | First Trust Advisors Lp | 2,601,808 | -5.59 | 40,224 | -1.85 | ||||
| 2025-07-24 | 13F | PDS Planning, Inc | 17,885 | -9.79 | 277 | -6.12 | ||||
| 2025-04-29 | 13F | Lee Danner & Bass Inc | 0 | -100.00 | 0 | -100.00 | ||||
| 2025-08-11 | 13F | Principal Securities, Inc. | 4,634 | 19.87 | 72 | 39.22 | ||||
| 2025-08-08 | 13F | Avantax Advisory Services, Inc. | 137,959 | 20.70 | 2,133 | 25.49 | ||||
| 2025-07-24 | 13F | Callan Family Office, LLC | 47,762 | 738 | ||||||
| 2025-08-13 | 13F | Fisher Asset Management, LLC | 98,635 | 89.16 | 1,525 | 96.65 | ||||
| 2025-07-23 | 13F | Venturi Wealth Management, LLC | 12,452 | 193 | ||||||
| 2025-08-01 | 13F | Bessemer Group Inc | 926 | 0.65 | 0 | |||||
| 2025-08-14 | 13F | Van Eck Associates Corp | 1,331,432 | -38.71 | 21 | -37.50 | ||||
| 2025-08-11 | 13F | Bellwether Advisors, LLC | 36 | 0.00 | 1 | |||||
| 2025-07-16 | 13F | Signaturefd, Llc | 79,631 | 17.83 | 1,231 | 22.61 | ||||
| 2025-07-23 | 13F | High Note Wealth, LLC | 13 | 0.00 | 0 | |||||
| 2025-08-11 | 13F | Traub Capital Management LLC | 307 | 5 | ||||||
| 2025-08-14 | 13F | Hrt Financial Lp | 40,773 | 86.11 | 1 | |||||
| 2025-08-21 | NP | PPH - VanEck Vectors Pharmaceutical ETF | 1,185,341 | -41.26 | 18,325 | -38.92 | ||||
| 2025-07-16 | 13F | Highline Wealth Partners Llc | 271 | 0.00 | 4 | 0.00 | ||||
| 2025-08-14 | 13F | Hudson Bay Capital Management LP | 0 | -100.00 | 0 | |||||
| 2025-07-16 | 13F/A | CX Institutional | 42 | 0.00 | 0 | |||||
| 2025-08-13 | 13F | Kayne Anderson Rudnick Investment Management Llc | 21 | 0.00 | 0 | |||||
| 2025-07-16 | 13F | Crowley Wealth Management, Inc. | 3,927 | 0.00 | 61 | 3.45 | ||||
| 2025-08-11 | 13F | Hexagon Capital Partners LLC | 11,360 | 30.60 | 176 | 35.66 | ||||
| 2025-08-05 | 13F | Carolinas Wealth Consulting Llc | 0 | -100.00 | 0 | |||||
| 2025-08-14 | 13F | Colony Group, LLC | 89,776 | 8.51 | 1,388 | 12.76 | ||||
| 2025-08-12 | 13F | Dimensional Fund Advisors Lp | 159,716 | -9.77 | 2,469 | -6.19 | ||||
| 2025-08-13 | 13F | Rsm Us Wealth Management Llc | 24,801 | 16.64 | 383 | 21.20 | ||||
| 2025-05-15 | 13F | Old Mission Capital Llc | 0 | -100.00 | 0 | |||||
| 2025-08-13 | 13F | Employees Retirement System of Texas | 0 | -100.00 | 0 | |||||
| 2025-08-14 | 13F | Ancora Advisors, LLC | 1,413 | 22 | ||||||
| 2025-08-14 | 13F | Nomura Holdings Inc | 0 | -100.00 | 0 | |||||
| 2025-08-15 | 13F | CI Private Wealth, LLC | 171,719 | 136.91 | 2,655 | 146.43 | ||||
| 2025-08-14 | 13F | Group One Trading, L.p. | 147 | -40.49 | 2 | -33.33 | ||||
| 2025-08-14 | 13F | American Trust Investment Advisors, LLC | 0 | -100.00 | 0 | |||||
| 2025-08-13 | 13F | Walleye Capital LLC | 31,780 | 491 | ||||||
| 2025-07-10 | 13F | Exchange Traded Concepts, Llc | 0 | -100.00 | 0 | |||||
| 2025-08-12 | 13F | SRS Capital Advisors, Inc. | 773 | 230.34 | 88 | 2,833.33 | ||||
| 2025-08-14 | 13F | Graham Capital Management, L.P. | 49,286 | -68.96 | 762 | -67.75 | ||||
| 2025-08-14 | 13F | Bridgefront Capital, LLC | 48,483 | -1.93 | 750 | 1.90 | ||||
| 2025-08-05 | 13F | Huntington National Bank | 1 | 0.00 | 0 | |||||
| 2025-07-28 | NP | AVDEX - Avantis International Equity Fund Institutional Class This fund is a listed as child fund of American Century Companies Inc and if that institution has disclosed ownership in this security, then these positions will not be double counted when calculating total shares and total value | 11,069 | 0.00 | 166 | 4.40 | ||||
| 2025-07-21 | 13F | Riverview Trust Co | 432 | 7 | ||||||
| 2025-08-06 | 13F | SOUTH STATE Corp | 1,000 | 15 | ||||||
| 2025-06-27 | NP | DSEFX - Domini Impact Equity Fund Investor Shares | 98,900 | -3.04 | 1,512 | 10.77 | ||||
| 2025-08-12 | 13F/A | Boston Partners | 105,735 | -19.96 | 1,635 | -16.80 | ||||
| 2025-07-15 | 13F | Ballentine Partners, LLC | 48,034 | 25.16 | 743 | 30.18 | ||||
| 2025-08-12 | 13F | Charles Schwab Investment Management Inc | 358,046 | 15.05 | 5,535 | 19.62 | ||||
| 2025-08-13 | 13F | West Family Investments, Inc. | 36,207 | 8.18 | 560 | 12.47 | ||||
| 2025-08-14 | 13F | Two Sigma Advisers, Lp | 152,500 | -1.36 | 2,358 | 2.57 | ||||
| 2025-06-26 | NP | AMRMX - AMERICAN MUTUAL FUND Class A | 12,888,047 | -0.28 | 197,058 | 13.87 | ||||
| 2025-07-15 | 13F | Mather Group, Llc. | 0 | -100.00 | 0 | |||||
| 2025-04-22 | 13F | Synergy Financial Management, LLC | 0 | -100.00 | 0 | |||||
| 2025-08-07 | 13F | Sierra Ocean, Llc | 1,363 | 28.71 | 21 | 40.00 | ||||
| 2025-08-14 | 13F | GWM Advisors LLC | 396 | 4.21 | 6 | 20.00 | ||||
| 2025-07-29 | NP | GINX - SGI Enhanced Global Income ETF | 134,094 | -23.28 | 2,015 | -19.98 | ||||
| 2025-08-13 | 13F | Arjuna Capital | 55,222 | 854 | ||||||
| 2025-08-13 | 13F | Renaissance Technologies Llc | 3,299,200 | 4.48 | 51,006 | 8.63 | ||||
| 2025-08-11 | 13F | Citigroup Inc | 23,975 | 33.66 | 371 | 39.10 | ||||
| 2025-07-11 | 13F/A | Umb Bank N A/mo | 350 | 0.00 | 5 | 0.00 | ||||
| 2025-08-13 | 13F | Bare Financial Services, Inc | 411 | 1,041.67 | 6 | |||||
| 2025-08-07 | 13F | Hughes Financial Services, LLC | 145 | 0.00 | 2 | 0.00 | ||||
| 2025-07-17 | 13F | Oakworth Capital, Inc. | 0 | -100.00 | 0 | |||||
| 2025-07-31 | 13F | Catalyst Capital Advisors LLC | 181,000 | 0.00 | 2,798 | 3.98 | ||||
| 2025-05-01 | 13F | Cromwell Holdings LLC | 0 | -100.00 | 0 | |||||
| 2025-05-08 | 13F | XTX Topco Ltd | 0 | -100.00 | 0 | |||||
| 2025-08-14 | 13F | Aqr Capital Management Llc | 369,142 | 88.59 | 5,707 | 96.08 | ||||
| 2025-08-14 | 13F | Gould Capital, LLC | 70 | 0.00 | 1 | 0.00 | ||||
| 2025-08-14 | 13F | Royal Bank Of Canada | 464,851 | 5.40 | 7,188 | 9.61 | ||||
| 2025-05-14 | 13F | Causeway Capital Management Llc | 0 | -100.00 | 0 | |||||
| 2025-06-26 | NP | DFIC - Dimensional International Core Equity 2 ETF | 7,000 | 0.00 | 107 | 15.05 | ||||
| 2025-08-15 | 13F | Morgan Stanley | 7,619,590 | 33.62 | 117,799 | 38.92 | ||||
| 2025-07-25 | 13F | Cwm, Llc | 6,822 | -8.03 | 0 | |||||
| 2025-07-30 | NP | APIE - ActivePassive International Equity ETF | 368,678 | 6.88 | 5,541 | 11.49 | ||||
| 2025-07-11 | 13F | Farther Finance Advisors, LLC | 5,623 | 21.71 | 87 | 26.47 | ||||
| 2025-07-23 | 13F | Vontobel Holding Ltd. | 17,619 | 0.00 | 272 | 4.21 | ||||
| 2025-08-14 | 13F | Bank Of America Corp /de/ | 1,037,163 | 225.79 | 16,035 | 238.77 | ||||
| 2025-08-14 | 13F | Smartleaf Asset Management LLC | 10,829 | 4.34 | 164 | 4.49 | ||||
| 2025-05-01 | 13F | Schechter Investment Advisors, LLC | 104,974 | -12.28 | 1,561 | -1.52 | ||||
| 2025-08-12 | 13F | Jpmorgan Chase & Co | 179,759 | -35.67 | 2,779 | -33.12 | ||||
| 2025-07-14 | 13F | UMA Financial Services, Inc. | 108 | 63.64 | 2 | |||||
| 2025-07-24 | 13F | Standard Life Aberdeen plc | 0 | -100.00 | 0 | |||||
| 2025-07-30 | 13F | Bleakley Financial Group, LLC | 359,366 | 10.04 | 5,556 | 14.39 | ||||
| 2025-08-11 | 13F | Cornerstone Planning Group LLC | 602 | 30.30 | 9 | 14.29 | ||||
| 2025-07-08 | 13F | Parallel Advisors, LLC | 24,338 | 22.59 | 376 | 27.46 | ||||
| 2025-07-24 | 13F | Jfs Wealth Advisors, Llc | 933 | 15.47 | 14 | 16.67 | ||||
| 2025-08-13 | 13F | Mount Yale Investment Advisors, LLC | 117 | 2 | ||||||
| 2025-08-14 | 13F | Sei Investments Co | 159,937 | 6.76 | 2,472 | 11.00 | ||||
| 2025-08-06 | 13F | Hallmark Capital Management Inc | 0 | -100.00 | 0 | |||||
| 2025-07-31 | 13F | Caitong International Asset Management Co., Ltd | 0 | -100.00 | 0 | |||||
| 2025-08-12 | 13F | Steward Partners Investment Advisory, Llc | 991 | 0.00 | 15 | 7.14 | ||||
| 2025-08-08 | 13F | Smithfield Trust Co | 1,869 | 0.00 | 0 | |||||
| 2025-05-02 | 13F | Cullen/frost Bankers, Inc. | 0 | -100.00 | 0 | |||||
| 2025-08-14 | 13F | Optiver Holding B.V. | 0 | -100.00 | 0 | |||||
| 2025-04-29 | 13F | Callan Capital, LLC | 49,425 | 735 | ||||||
| 2025-04-21 | 13F | Old Second National Bank Of Aurora | 0 | -100.00 | 0 | |||||
| 2025-08-12 | 13F | AlphaCore Capital LLC | 12,425 | 192 | ||||||
| 2025-08-14 | 13F | Federation des caisses Desjardins du Quebec | 9,637 | 17.22 | 149 | 21.31 | ||||
| 2025-07-14 | 13F | U.S. Capital Wealth Advisors, LLC | 11,927 | 184 | ||||||
| 2025-08-08 | 13F | Islay Capital Management, Llc | 25 | 0 | ||||||
| 2025-05-15 | 13F | Voloridge Investment Management, Llc | 0 | -100.00 | 0 | |||||
| 2025-08-11 | 13F | Dorsey & Whitney Trust CO LLC | 15,897 | -21.07 | 246 | -18.06 | ||||
| 2025-08-06 | 13F | Paradigm Asset Management Co Llc | 2,500 | 0.00 | 39 | 2.70 | ||||
| 2025-07-30 | 13F | Forum Financial Management, LP | 91,934 | -19.58 | 1,421 | -16.36 | ||||
| 2025-03-24 | 13F | Mascagni Wealth Management, Inc. | 11 | 0 | ||||||
| 2025-05-14 | 13F | Credit Agricole S A | 574 | 0.00 | 9 | 14.29 | ||||
| 2025-08-14 | 13F | Glenmede Investment Management, LP | 30,853 | 477 | ||||||
| 2025-08-06 | 13F | First Horizon Advisors, Inc. | 821 | 19.85 | 13 | 20.00 | ||||
| 2025-08-12 | 13F | Jefferies Financial Group Inc. | 0 | -100.00 | 0 | |||||
| 2025-08-01 | 13F | Envestnet Asset Management Inc | 879,874 | -1.27 | 13,603 | 2.65 | ||||
| 2025-07-16 | 13F | Strategic Investment Solutions, Inc. /IL | 125 | 0.00 | 2 | 0.00 | ||||
| 2025-08-13 | 13F | Marshall Wace, Llp | 0 | -100.00 | 0 | |||||
| 2025-08-06 | 13F | Commonwealth Equity Services, Llc | 19,682 | -9.01 | 0 | |||||
| 2025-08-12 | 13F | Pacer Advisors, Inc. | 0 | -100.00 | 0 | -100.00 | ||||
| 2025-08-13 | 13F | Northwestern Mutual Wealth Management Co | 3,586 | 56.32 | 55 | 61.76 | ||||
| 2025-07-24 | 13F | IFP Advisors, Inc | 951 | -62.08 | 15 | -62.16 | ||||
| 2025-07-21 | 13F | Empirical Financial Services, LLC d.b.a. Empirical Wealth Management | 28,361 | 105.35 | 438 | 113.66 | ||||
| 2025-08-11 | 13F | Tidemark, LLC | 126 | 0.00 | 2 | 0.00 | ||||
| 2025-07-28 | 13F | Private Wealth Asset Management, LLC | 53 | 0.00 | 1 | |||||
| 2025-08-14 | 13F | Wiley Bros.-aintree Capital, Llc | 21,198 | 14.90 | 331 | 19.49 | ||||
| 2025-08-13 | 13F | Townsquare Capital Llc | 0 | -100.00 | 0 | |||||
| 2025-08-12 | 13F | Advisors Asset Management, Inc. | 38,029 | -19.54 | 588 | -16.38 | ||||
| 2025-05-09 | 13F | CoreCap Advisors, LLC | 0 | -100.00 | 0 | |||||
| 2025-08-04 | 13F | Assetmark, Inc | 95,720 | 10.61 | 1,480 | 15.01 | ||||
| 2025-08-14 | 13F | Stifel Financial Corp | 454,019 | 13.00 | 7,019 | 17.49 | ||||
| 2025-08-14 | 13F | Bnp Paribas Arbitrage, Sa | 11,845 | 1,652.22 | 183 | 1,730.00 | ||||
| 2025-05-21 | 13F | McAdam, LLC | 0 | -100.00 | 0 | |||||
| 2025-08-06 | 13F | Savant Capital, LLC | 32,824 | 121.81 | 507 | 130.45 | ||||
| 2025-08-14 | 13F | Principia Wealth Advisory, LLC | 7,200 | 0.78 | 111 | 8.82 | ||||
| 2025-08-13 | 13F | Lido Advisors, LLC | 26,548 | -0.17 | 419 | 6.08 | ||||
| 2025-06-26 | NP | DFAX - Dimensional World ex U.S. Core Equity 2 ETF | 5,264 | 0.00 | 80 | 14.29 | ||||
| 2025-08-14 | 13F | Mercer Global Advisors Inc /adv | 225,234 | -3.59 | 3,482 | 0.26 | ||||
| 2025-08-05 | 13F | Bank of New York Mellon Corp | 140,755 | 8.71 | 2,176 | 13.04 | ||||
| 2025-08-11 | 13F | HighTower Advisors, LLC | 96,325 | 9.78 | 1,489 | 14.19 | ||||
| 2025-08-13 | 13F | Walleye Trading LLC | Call | 0 | -100.00 | 0 | ||||
| 2025-07-30 | 13F | Ethic Inc. | 267,456 | 21.83 | 4,039 | 23.45 | ||||
| 2025-08-14 | 13F | Erste Asset Management GmbH | 3,674 | 0.00 | 57 | 2,700.00 | ||||
| 2025-07-25 | 13F | JustInvest LLC | 202,312 | 29.39 | 3,128 | 34.55 | ||||
| 2025-08-04 | 13F | Hantz Financial Services, Inc. | 227,241 | 3.53 | 4 | 0.00 | ||||
| 2025-08-14 | 13F | Verition Fund Management LLC | 397,464 | -52.70 | 6,145 | -50.83 | ||||
| 2025-05-09 | 13F | NewEdge Wealth, LLC | 0 | -100.00 | 0 | |||||
| 2025-08-12 | 13F | O'shaughnessy Asset Management, Llc | 131,722 | 0.75 | 2,036 | 4.73 | ||||
| 2025-08-12 | 13F | Evelyn Partners Investment Management LLP | 2,515 | 163.35 | 3 | 0.00 | ||||
| 2025-05-07 | 13F | Zurcher Kantonalbank (Zurich Cantonalbank) | 0 | -100.00 | 0 | -100.00 | ||||
| 2025-08-25 | 13F/A | Promus Capital, LLC | 0 | 0 | ||||||
| 2025-07-31 | 13F | Buckingham Strategic Partners | 10,225 | 158 | ||||||
| 2025-08-14 | 13F | LMR Partners LLP | 34,600 | -69.49 | 535 | -68.33 | ||||
| 2025-08-07 | 13F | Addison Advisors LLC | 2,170 | 4.68 | 34 | 10.00 | ||||
| 2025-07-17 | 13F | Sage Rhino Capital Llc | 12,604 | 7.86 | 195 | 12.14 | ||||
| 2025-07-22 | 13F | Old National Bancorp /in/ | 0 | -100.00 | 0 | |||||
| 2025-07-22 | 13F | Belpointe Asset Management LLC | 0 | -100.00 | 0 | |||||
| 2025-07-25 | 13F | Allspring Global Investments Holdings, LLC | 22,088 | 3.35 | 341 | 6.92 | ||||
| 2025-08-13 | 13F | Cerity Partners LLC | 159,863 | 0.36 | 2,471 | 4.35 | ||||
| 2025-08-15 | 13F | Binnacle Investments Inc | 276 | 4 | ||||||
| 2025-04-24 | 13F | BSW Wealth Partners | 0 | -100.00 | 0 | -100.00 | ||||
| 2025-08-07 | 13F | CENTRAL TRUST Co | 1 | 0.00 | 0 | |||||
| 2025-07-08 | 13F | Rise Advisors, LLC | 1 | 0.00 | 0 | |||||
| 2025-07-08 | 13F | Arlington Trust Co LLC | 90 | 1 | ||||||
| 2025-07-15 | 13F | Financial Management Professionals, Inc. | 125 | 0.00 | 2 | 0.00 | ||||
| 2025-08-13 | 13F | Financial Avengers, Inc. | 3,355 | -16.12 | 52 | -13.56 | ||||
| 2025-07-30 | NP | FILFX - Strategic Advisers International Fund This fund is a listed as child fund of Fmr Llc and if that institution has disclosed ownership in this security, then these positions will not be double counted when calculating total shares and total value | 65,699 | 107.90 | 987 | 116.92 | ||||
| 2025-05-15 | 13F/A | Orion Portfolio Solutions, LLC | 43,318 | 233.27 | 644 | 274.42 | ||||
| 2025-07-15 | 13F | Cranbrook Wealth Management, LLC | 1,313 | 0.00 | 20 | 5.26 | ||||
| 2025-08-13 | 13F | Manning & Napier Advisors Llc | 245,241 | -17.57 | 3,791 | -14.31 | ||||
| 2025-07-30 | 13F | Legacy Wealth Asset Management, LLC | 164,785 | -11.15 | 2,548 | -7.62 | ||||
| 2025-08-28 | NP | TRXAX - Catalyst/MAP Global Balanced Fund Class A | 23,000 | 0.00 | 356 | 3.80 | ||||
| 2025-08-08 | 13F | Thoroughbred Financial Services, Llc | 21,772 | 0 | ||||||
| 2025-08-12 | 13F | Coldstream Capital Management Inc | 10,063 | 18.58 | 156 | 23.02 | ||||
| 2025-08-27 | 13F/A | Brinker Capital Investments, LLC | 56,436 | 30.28 | 873 | 35.40 | ||||
| 2025-08-14 | 13F | Raymond James Financial Inc | 143,693 | 74.85 | 2,221 | 81.75 | ||||
| 2025-07-10 | 13F | Wealth Enhancement Advisory Services, Llc | 67,649 | 1.77 | 1,038 | 4.96 | ||||
| 2025-08-15 | 13F | Tower Research Capital LLC (TRC) | 26,300 | 108.73 | 407 | 117.11 | ||||
| 2025-08-14 | 13F | ICONIQ Capital, LLC | 54,703 | 10.23 | 846 | 14.65 | ||||
| 2025-04-15 | 13F | Collier Financial | 50 | 0.00 | 1 | |||||
| 2025-08-12 | 13F | Entropy Technologies, LP | 0 | -100.00 | 0 | |||||
| 2025-08-12 | 13F | Legal & General Group Plc | 136,715 | 0.00 | 2,113 | 3.89 | ||||
| 2025-08-12 | 13F | Pathstone Holdings, LLC | 221,852 | 3.30 | 3,437 | 7.68 | ||||
| 2025-08-11 | 13F | Bell Investment Advisors, Inc | 280 | 33.33 | 4 | 33.33 | ||||
| 2025-05-13 | 13F | Mondrian Investment Partners LTD | 1,438 | -6.74 | 21 | 5.00 | ||||
| 2025-08-11 | 13F | Managed Asset Portfolios, Llc | 1,488,843 | 1.30 | 23,018 | 5.33 | ||||
| 2025-08-15 | 13F | Captrust Financial Advisors | 38,440 | 6.04 | 594 | 10.20 | ||||
| 2025-05-15 | 13F | Gts Securities Llc | 0 | -100.00 | 0 | |||||
| 2025-08-14 | 13F | Toroso Investments, LLC | 91,646 | 1,417 | ||||||
| 2025-07-09 | 13F | Aaron Wealth Advisors LLC | 31,267 | 28.15 | 483 | 33.43 | ||||
| 2025-08-14 | 13F | Syon Capital Llc | 33,981 | 21.55 | 525 | 26.51 | ||||
| 2025-07-08 | 13F | Gallacher Capital Management LLC | 22,000 | 12.86 | 340 | 17.65 | ||||
| 2025-08-14 | 13F | Quantinno Capital Management LP | 797,036 | 54.45 | 12,322 | 60.59 | ||||
| 2025-08-18 | 13F/A | National Bank Of Canada /fi/ | 5,111 | 2.92 | 79 | 6.85 | ||||
| 2025-08-01 | 13F | SYM FINANCIAL Corp | 20,094 | 10.39 | 311 | 14.81 | ||||
| 2025-08-04 | 13F | Keybank National Association/oh | 13,376 | 13.62 | 207 | 17.71 | ||||
| 2025-08-07 | 13F | Vise Technologies, Inc. | 80,641 | 132.83 | 1,247 | 172.05 | ||||
| 2025-07-30 | 13F | Probity Advisors, Inc. | 41,328 | 6.10 | 639 | 10.19 | ||||
| 2025-08-08 | 13F | Cetera Investment Advisers | 74,501 | -0.98 | 1,152 | 2.95 | ||||
| 2025-04-28 | NP | CABNX - AB GLOBAL RISK ALLOCATION FUND, INC. Class A | 0 | -100.00 | 0 | -100.00 | ||||
| 2025-08-05 | 13F | GPS Wealth Strategies Group, LLC | 19 | 216.67 | 0 | |||||
| 2025-08-08 | 13F/A | Sterling Capital Management LLC | 1,369 | 0.00 | 21 | 5.00 | ||||
| 2025-08-14 | 13F | Wetherby Asset Management Inc | 44,868 | 14.40 | 694 | 33.53 | ||||
| 2025-05-15 | 13F | CAPROCK Group, Inc. | 28,398 | 9.59 | 422 | 23.03 | ||||
| 2025-08-12 | 13F | Global Retirement Partners, LLC | 50,474 | 8,978.06 | 780 | 11,042.86 | ||||
| 2025-08-29 | 13F | Evolution Wealth Management Inc. | 15 | 0 | ||||||
| 2025-08-12 | 13F | Wood Tarver Financial Group, LLC | 45 | 0.00 | 0 | |||||
| 2025-08-05 | 13F | Ellevest, Inc. | 42,949 | 51.57 | 664 | 57.48 | ||||
| 2025-08-13 | 13F | Twin Peaks Wealth Advisors, LLC | 1,927 | 28 | ||||||
| 2025-08-11 | 13F | Rothschild Investment Llc | 19,295 | -0.53 | 298 | 3.47 | ||||
| 2025-07-28 | 13F | Bayforest Capital Ltd | 16,005 | 247 | ||||||
| 2025-08-08 | 13F | Abc Arbitrage Sa | 0 | -100.00 | 0 | |||||
| 2025-05-15 | 13F | Aquatic Capital Management LLC | 0 | -100.00 | 0 | |||||
| 2025-05-19 | 13F/A | Kovitz Investment Group Partners, LLC | 0 | -100.00 | 0 | -100.00 | ||||
| 2025-08-14 | 13F | Goldman Sachs Group Inc | 4,500,965 | -15.41 | 69,585 | -12.05 | ||||
| 2025-08-14 | 13F | Balyasny Asset Management Llc | 12,217 | 3.77 | 189 | 7.43 | ||||
| 2025-08-14 | 13F | Citadel Advisors Llc | Put | 0 | -100.00 | 0 | ||||
| 2025-08-14 | 13F | Citadel Advisors Llc | 0 | -100.00 | 0 | |||||
| 2025-05-29 | NP | OZEM - Roundhill GLP-1 & Weight Loss ETF | 59,201 | -3.74 | 880 | 8.11 | ||||
| 2025-08-28 | NP | Tekla World Healthcare Fund | 0 | -100.00 | 0 | -100.00 | ||||
| 2025-08-11 | 13F | WPG Advisers, LLC | 63 | 0.00 | 1 | |||||
| 2025-09-04 | 13F/A | Advisor Group Holdings, Inc. | 20,876 | 68.71 | 320 | 73.37 | ||||
| 2025-07-18 | 13F | Generali Investments CEE, investicni spolecnost, a.s. | 10,000 | 0.00 | 155 | 4.05 | ||||
| 2025-07-15 | 13F | Public Employees Retirement System Of Ohio | 0 | -100.00 | 0 | |||||
| 2025-07-21 | 13F | Ameritas Advisory Services, LLC | 110 | 2 | ||||||
| 2025-07-30 | 13F | FNY Investment Advisers, LLC | 0 | -100.00 | 0 | |||||
| 2025-08-07 | 13F/A | Tortoise Investment Management, LLC | 0 | -100.00 | 0 | -100.00 | ||||
| 2025-06-26 | NP | SNTKX - Steward International Enhanced Index Fund Class A | 325,292 | 72.82 | 4,974 | 97.34 | ||||
| 2025-08-18 | 13F | Front Row Advisors LLC | 86 | -40.69 | 1 | -50.00 | ||||
| 2025-06-30 | NP | CVY - Invesco Zacks Multi-Asset Income ETF This fund is a listed as child fund of Invesco Ltd. and if that institution has disclosed ownership in this security, then these positions will not be double counted when calculating total shares and total value | 47,725 | 29.18 | 730 | 19.12 | ||||
| 2025-08-12 | 13F | Rhumbline Advisers | 67,900 | -3.87 | 1,050 | -0.10 | ||||
| 2025-08-07 | 13F | Allworth Financial LP | 11,357 | 5.19 | 176 | 7.36 | ||||
| 2025-07-09 | 13F | Sivia Capital Partners, LLC | 22,734 | 351 | ||||||
| 2025-08-08 | 13F | Pnc Financial Services Group, Inc. | 69,114 | 18.00 | 1,069 | 22.76 | ||||
| 2025-08-12 | 13F | Wayfinding Financial, LLC | 0 | -100.00 | 0 | |||||
| 2025-05-14 | 13F | EntryPoint Capital, LLC | 0 | -100.00 | 0 | |||||
| 2025-08-12 | 13F | Franklin Resources Inc | 18,745 | 11.63 | 290 | 16.06 | ||||
| 2025-08-13 | 13F | IAG Wealth Partners, LLC | 0 | -100.00 | 0 | |||||
| 2025-08-14 | 13F | Toronto Dominion Bank | 0 | -100.00 | 0 | |||||
| 2025-08-06 | 13F | Vestmark Advisory Solutions, Inc. | 63,862 | 987 | ||||||
| 2025-05-05 | 13F | Lindbrook Capital, Llc | 4,292 | -16.68 | 64 | -7.35 | ||||
| 2025-05-01 | 13F | Cutter & CO Brokerage, Inc. | 0 | -100.00 | 0 | |||||
| 2025-07-31 | 13F | Whipplewood Advisors, LLC | 1,551 | 8,063.16 | 24 | 0.00 | ||||
| 2025-04-29 | 13F | Hm Payson & Co | 100 | 0.00 | 1 | 0.00 | ||||
| 2025-07-14 | 13F | AdvisorNet Financial, Inc | 20 | 0.00 | 0 | |||||
| 2025-07-28 | NP | AVSD - Avantis Responsible International Equity ETF | 8,257 | 0.00 | 124 | 5.08 | ||||
| 2025-08-12 | 13F | Coston, McIsaac & Partners | 259 | 0.00 | 0 | |||||
| 2025-08-13 | 13F | Capital Fund Management S.a. | 126,279 | 216.12 | 1,952 | 229.17 | ||||
| 2025-08-28 | NP | JINTX - Johnson International Fund | 9,340 | 0.00 | 144 | 4.35 | ||||
| 2025-07-25 | 13F | Yousif Capital Management, Llc | 32,394 | 8.45 | 501 | 12.61 | ||||
| 2025-08-08 | 13F | Larson Financial Group LLC | 5,444 | -0.44 | 84 | 3.70 | ||||
| 2025-07-30 | 13F | Financial Perspectives, Inc | 1,437 | 0.00 | 22 | 4.76 | ||||
| 2025-08-14 | 13F | Macquarie Group Ltd | 324 | 0.00 | 5 | 25.00 | ||||
| 2025-08-08 | 13F | IMA Wealth, Inc. | 251 | 0.00 | 4 | 0.00 | ||||
| 2025-05-15 | 13F | Point72 Hong Kong Ltd | 0 | -100.00 | 0 | -100.00 | ||||
| 2025-07-29 | 13F | FLC Capital Advisors | 11,372 | 176 | ||||||
| 2025-07-22 | 13F | Valeo Financial Advisors, LLC | 11,741 | 182 | ||||||
| 2025-08-14 | 13F | Citadel Advisors Llc | Call | 850,900 | 1,581.62 | 13,155 | 1,649.20 | |||
| 2025-07-18 | 13F | Gold Investment Management Ltd. | 100,048 | 2.55 | 1,540 | 6.21 | ||||
| 2025-07-28 | 13F | Naviter Wealth, LLC | 46,560 | 327.67 | 723 | 343.56 | ||||
| 2025-08-08 | 13F | Crossmark Global Holdings, Inc. | 727,194 | 83.25 | 11,242 | 90.54 | ||||
| 2025-07-18 | 13F | Truist Financial Corp | 65,137 | -2.31 | 1,007 | 1.61 | ||||
| 2025-07-14 | 13F | Armstrong Advisory Group, Inc | 25 | 0.00 | 0 | |||||
| 2025-08-13 | 13F | Invesco Ltd. | 35,977 | -27.97 | 556 | -25.07 | ||||
| 2025-08-13 | 13F | Colonial Trust Advisors | 352 | 0.00 | 5 | 0.00 | ||||
| 2025-08-12 | 13F | Manchester Capital Management LLC | 2,427 | 8.45 | 38 | 12.12 | ||||
| 2025-08-07 | 13F | Montag A & Associates Inc | 1,238 | 0.00 | 19 | 5.56 | ||||
| 2025-08-18 | 13F | Geneos Wealth Management Inc. | 2,208 | 17.26 | 34 | 21.43 | ||||
| 2025-07-28 | 13F | Fairman Group, LLC | 45 | 0.00 | 1 | |||||
| 2025-08-14 | 13F | XY Capital Ltd | 0 | -100.00 | 0 | |||||
| 2025-08-27 | 13F/A | Squarepoint Ops LLC | 44,105 | -30.69 | 682 | -28.01 | ||||
| 2025-07-18 | 13F | Bartlett & Co. Wealth Management Llc | 25,326 | 0.00 | 400 | 6.38 | ||||
| 2025-08-12 | 13F | Inscription Capital, LLC | 18,659 | -14.48 | 288 | -4.95 | ||||
| 2025-04-22 | 13F | Mendota Financial Group, LLC | 0 | -100.00 | 0 | |||||
| 2025-08-05 | 13F | NewSquare Capital LLC | 3,451 | 182.41 | 53 | 194.44 | ||||
| 2025-08-14 | 13F | Ieq Capital, Llc | 41,502 | 86.76 | 642 | 94.24 | ||||
| 2025-08-13 | 13F | Brandes Investment Partners, Lp | 3,712,278 | 5.94 | 57,392 | 10.14 | ||||
| 2025-08-08 | 13F | SG Americas Securities, LLC | 0 | -100.00 | 0 | |||||
| 2025-08-11 | 13F | Brown Brothers Harriman & Co | 313 | 5 | ||||||
| 2025-08-14 | 13F | Schonfeld Strategic Advisors LLC | 0 | -100.00 | 0 | |||||
| 2025-03-27 | NP | PTIN - Pacer Trendpilot International ETF | 27,192 | -0.67 | 364 | -3.96 | ||||
| 2025-08-14 | 13F | Jane Street Group, Llc | 14,972 | -68.22 | 231 | -67.00 | ||||
| 2025-08-14 | 13F | Susquehanna International Group, Llp | Call | 832,300 | 3,649.10 | 12,867 | 3,799.09 | |||
| 2025-07-17 | 13F | Clean Yield Group | 275,016 | -4.03 | 4,252 | -0.23 | ||||
| 2025-07-22 | 13F | Merit Financial Group, LLC | 18,232 | 282 | ||||||
| 2025-07-24 | 13F | Blair William & Co/il | 10,306 | -2.98 | 159 | 1.27 | ||||
| 2025-08-12 | 13F | Summit Global Investments | 181,653 | -48.21 | 3 | -60.00 | ||||
| 2025-08-13 | 13F | Northern Trust Corp | 2,029,885 | 23.78 | 31,382 | 28.69 | ||||
| 2025-08-12 | 13F | TCTC Holdings, LLC | 372 | 0.00 | 6 | 0.00 | ||||
| 2025-05-12 | 13F | Richard W. Paul & Associates, LLC | 0 | -100.00 | 0 | |||||
| 2025-08-13 | 13F | Baird Financial Group, Inc. | 11,765 | -36.69 | 182 | -34.42 | ||||
| 2025-08-14 | 13F | Susquehanna International Group, Llp | Put | 13,800 | -34.60 | 213 | -31.95 | |||
| 2025-08-11 | 13F | United Capital Financial Advisers, Llc | 30,254 | -5.23 | 468 | -1.48 | ||||
| 2025-08-14 | 13F | Susquehanna International Group, Llp | 10,810 | -77.01 | 167 | -76.11 | ||||
| 2025-07-25 | 13F | Natural Investments, Llc | 12,563 | 0 | ||||||
| 2025-07-09 | 13F | Intelligence Driven Advisers, LLC | 14,535 | 7.21 | 225 | 11.44 | ||||
| 2025-08-13 | 13F | M&t Bank Corp | 74,757 | 80.49 | 1,156 | 87.80 | ||||
| 2025-08-12 | 13F | Cornerstone Select Advisors, LLC | 11,485 | 0.00 | 178 | 4.12 | ||||
| 2025-08-14 | 13F | Mariner, LLC | 269,774 | 63.86 | 4,170 | 70.30 | ||||
| 2025-08-14 | 13F | Adage Capital Partners Gp, L.l.c. | 2,533,725 | -26.20 | 39,171 | -23.27 | ||||
| 2025-08-05 | 13F | Bank Of Montreal /can/ | 95,107 | 6.99 | 1,470 | 11.28 | ||||
| 2025-08-13 | 13F | Capital Research Global Investors | 13,295,573 | 0.72 | 205,550 | 4.71 | ||||
| 2025-07-30 | 13F | Bogart Wealth, LLC | 7 | -95.83 | 0 | -100.00 | ||||
| 2025-08-06 | 13F | True Wealth Design, LLC | 199 | 3.11 | 3 | 50.00 | ||||
| 2025-08-04 | 13F | Creative Financial Designs Inc /adv | 934 | 126.15 | 14 | 133.33 | ||||
| 2025-07-28 | 13F | Rosenberg Matthew Hamilton | 2,104 | 0.00 | 33 | 3.23 | ||||
| 2025-07-28 | 13F | Harbour Investments, Inc. | 1,376 | 0.00 | 21 | 5.00 | ||||
| 2025-07-15 | 13F | Fifth Third Bancorp | 5,647 | 7.93 | 87 | 12.99 | ||||
| 2025-07-17 | 13F | Sound Income Strategies, LLC | 48 | 0.00 | 1 | |||||
| 2025-07-15 | 13F | Maseco Llp | 310 | 5 | ||||||
| 2025-08-14 | 13F | Millennium Management Llc | 3,088,669 | 1,152.21 | 47,751 | 1,202.15 | ||||
| 2025-04-11 | 13F | Princeton Global Asset Management LLC | 0 | -100.00 | 0 | |||||
| 2025-08-12 | 13F | Evelyn Partners Investment Management Services Ltd | 178 | 157.97 | 2 | 0.00 | ||||
| 2025-07-07 | 13F | Versant Capital Management, Inc | 24,996 | -0.53 | 386 | 3.49 | ||||
| 2025-08-11 | 13F | Bulltick Wealth Management, LLC | 10,254 | 159 | ||||||
| 2025-07-21 | 13F | Qrg Capital Management, Inc. | 432,654 | 11.82 | 6,689 | 16.25 | ||||
| 2025-07-30 | NP | ENDW - Cambria Endowment Style ETF | 51 | 1 | ||||||
| 2025-06-30 | NP | VEU - Vanguard FTSE All-World ex-US Index Fund ETF Shares | 101,870 | 0.00 | 1,558 | 14.15 | ||||
| 2025-08-04 | 13F | Heritage Investors Management Corp | 103,109 | -0.26 | 2 | 0.00 | ||||
| 2025-07-07 | 13F | Bangor Savings Bank | 186 | 0.00 | 3 | 0.00 | ||||
| 2025-07-30 | 13F | Whittier Trust Co Of Nevada Inc | 105 | -27.59 | 2 | -50.00 | ||||
| 2025-08-14 | 13F | Jane Street Group, Llc | Call | 0 | -100.00 | 0 | ||||
| 2025-07-25 | 13F | Stephens Consulting, LLC | 450 | 7 | ||||||
| 2025-07-07 | 13F | Investors Research Corp | 44,519 | -0.89 | 688 | 3.15 | ||||
| 2025-08-14 | 13F | Atomi Financial Group, Inc. | 42,335 | -3.06 | 655 | 0.77 | ||||
| 2025-08-13 | 13F | EverSource Wealth Advisors, LLC | 16,077 | 145.79 | 249 | 155.67 | ||||
| 2025-08-13 | 13F | Natixis Advisors, L.p. | 453,527 | 7.91 | 7 | 16.67 | ||||
| 2025-07-22 | 13F | Highland Capital Management, Llc | 61,250 | -2.62 | 947 | 1.18 | ||||
| 2025-07-08 | 13F | Atwood & Palmer Inc | 25 | 0 | ||||||
| 2025-08-12 | 13F | CIBC Private Wealth Group, LLC | 702 | -4.75 | 11 | 0.00 | ||||
| 2025-08-19 | 13F/A | Pitcairn Co | 17,379 | -15.93 | 269 | -12.70 | ||||
| 2025-07-09 | 13F | Bruce G. Allen Investments, LLC | 411 | -16.97 | 6 | -14.29 | ||||
| 2025-05-15 | 13F | Glenmede Trust Co Na | 24,580 | 123.23 | 366 | 151.72 | ||||
| 2025-08-14 | 13F | Mml Investors Services, Llc | 80,829 | 16.66 | 1 | 0.00 | ||||
| 2025-07-30 | 13F | Jackson Thornton Asset Management, Llc | 12,779 | 7.76 | 192 | 9.77 | ||||
| 2025-08-13 | 13F | Quadrant Capital Group Llc | 127,721 | -21.15 | 1,975 | -18.02 | ||||
| 2025-07-24 | 13F | GFG Capital, LLC | 213 | 3 | ||||||
| 2025-04-23 | 13F | Continuum Advisory, LLC | 0 | -100.00 | 0 | -100.00 | ||||
| 2025-04-11 | 13F | First Affirmative Financial Network | 27,866 | 35.26 | 414 | 52.21 | ||||
| 2025-08-12 | 13F | Archer Investment Corp | 297 | 0.00 | 5 | 0.00 | ||||
| 2025-07-31 | 13F | Nisa Investment Advisors, Llc | 200 | 0.00 | 3 | 50.00 | ||||
| 2025-07-31 | 13F | Oppenheimer Asset Management Inc. | 57,613 | 3.87 | 891 | 8.01 | ||||
| 2025-07-24 | 13F | Trust Co Of Toledo Na /oh/ | 376 | 6 | ||||||
| 2025-07-10 | 13F | Piscataqua Savings Bank | 518 | 0.00 | 8 | 14.29 | ||||
| 2025-07-16 | 13F | PFS Partners, LLC | 227 | 0.00 | 4 | 0.00 | ||||
| 2025-08-13 | 13F/A | StoneX Group Inc. | 0 | -100.00 | 0 | |||||
| 2025-08-08 | NP | QGBLX - Quantified Global Fund Investor Class | 343,309 | 2,354.66 | 5,308 | 2,566.83 | ||||
| 2025-08-07 | 13F | Zions Bancorporation, National Association /ut/ | 371 | 0.00 | 6 | 0.00 | ||||
| 2025-05-15 | 13F | Point72 Asset Management, L.P. | 0 | -100.00 | 0 | |||||
| 2025-08-07 | 13F | Parkside Financial Bank & Trust | 1,347 | 150.37 | 21 | 150.00 | ||||
| 2025-08-14 | 13F/A | Barclays Plc | 1,577 | -4.66 | 0 | |||||
| 2025-07-14 | 13F | GAMMA Investing LLC | 9,054 | 28.57 | 140 | 33.65 | ||||
| 2025-08-04 | 13F | Simon Quick Advisors, Llc | 24,277 | 120.76 | 375 | 130.06 | ||||
| 2025-08-12 | 13F | American Century Companies Inc | 357,029 | 12.91 | 5,520 | 17.38 | ||||
| 2025-07-14 | 13F | Ridgewood Investments LLC | 72 | 0.00 | 1 | 0.00 | ||||
| 2025-08-01 | 13F | Motco | 401 | 0.00 | 6 | 0.00 | ||||
| 2025-08-04 | 13F | Spire Wealth Management | 844 | -14.40 | 13 | -7.14 | ||||
| 2025-07-21 | 13F | Credential Qtrade Securities Inc. | 0 | -100.00 | 0 | -100.00 | ||||
| 2025-07-28 | 13F | Ritholtz Wealth Management | 23,746 | 2.15 | 367 | 6.38 | ||||
| 2025-08-13 | 13F | Russell Investments Group, Ltd. | 83,061 | 28.85 | 1,284 | 34.03 | ||||
| 2025-08-13 | 13F | Walleye Trading LLC | Put | 0 | -100.00 | 0 | ||||
| 2025-05-16 | 13F/A | Kestra Investment Management, LLC | 0 | -100.00 | 0 | |||||
| 2025-08-13 | 13F | Jones Financial Companies Lllp | 1,293 | -2.49 | 20 | 0.00 | ||||
| 2025-05-15 | 13F | Point72 Asia (Singapore) Pte. Ltd. | 0 | -100.00 | 0 | |||||
| 2025-07-16 | 13F | Brown, Lisle/cummings, Inc. | 58 | 0.00 | 1 | |||||
| 2025-07-24 | 13F | Lester Murray Antman dba SimplyRich | 32,520 | -6.20 | 1 | |||||
| 2025-08-27 | NP | CAXAX - Catalyst/MAP Global Equity Fund Class A | 158,000 | 0.00 | 2,443 | 3.96 | ||||
| 2025-08-12 | 13F | Clear Street Markets Llc | 0 | -100.00 | 0 | |||||
| 2025-08-19 | 13F | National Asset Management, Inc. | 11,260 | -0.39 | 174 | 16.78 | ||||
| 2025-08-14 | 13F | D. E. Shaw & Co., Inc. | 0 | -100.00 | 0 | |||||
| 2025-08-14 | 13F | Evergreen Capital Management Llc | 39,523 | 27.48 | 611 | 32.54 |