Mga Batayang Estadistika
| Pemilik Institusional | 120 total, 116 long only, 0 short only, 4 long/short - change of 18.63% MRQ |
| Alokasi Portofolio Rata-rata | 0.3364 % - change of 233.12% MRQ |
| Saham Institusional (Jangka Panjang) | 7,184,624 (ex 13D/G) - change of 3.57MM shares 98.55% MRQ |
| Nilai Institusional (Jangka Panjang) | $ 655,896 USD ($1000) |
Kepemilikan Institusional dan Pemegang Saham
ProShares Trust - ProShares UltraPro S&P500 (US:UPRO) memiliki 120 pemilik institusional dan pemegang saham yang telah mengajukan formulir 13D/G atau 13F kepada Komisi Bursa Efek (Securities Exchange Commission/SEC). Lembaga-lembaga ini memegang total 7,184,624 saham. Pemegang saham terbesar meliputi CRDBX - Conquer Risk Defensive Bull Fund, Howard Capital Management Inc., HCMNX - HCM Dividend Sector Plus Fund Class A Shares, Citadel Advisors Llc, Citadel Advisors Llc, Susquehanna International Group, Llp, Jane Street Group, Llc, Susquehanna International Group, Llp, Citadel Advisors Llc, and Jane Street Group, Llc .
Struktur kepemilikan institusional ProShares Trust - ProShares UltraPro S&P500 (ARCA:UPRO) menunjukkan posisi terkini di perusahaan oleh institusi dan dana, serta perubahan terbaru dalam ukuran posisi. Pemegang saham utama dapat mencakup investor individu, reksa dana, dana lindung nilai, atau institusi. Jadwal 13D menunjukkan bahwa investor memegang (atau pernah memegang) lebih dari 5% saham perusahaan dan bermaksud (atau pernah bermaksud) untuk secara aktif mengejar perubahan strategi bisnis. Jadwal 13G menunjukkan investasi pasif lebih dari 5%.
The share price as of September 5, 2025 is 102.38 / share. Previously, on September 9, 2024, the share price was 74.48 / share. This represents an increase of 37.46% over that period.

Skor Sentimen Dana
Skor Sentimen Dana (sebelumnya dikenal sebagai Skor Akumulasi Kepemilikan) menemukan saham-saham yang paling banyak dibeli oleh dana. Ini adalah hasil dari model kuantitatif multi-faktor yang canggih yang mengidentifikasi perusahaan dengan tingkat akumulasi institusional tertinggi. Model penilaian menggunakan kombinasi dari total peningkatan pemilik yang diungkapkan, perubahan dalam alokasi portofolio pada pemilik tersebut, dan metrik lainnya. Angka berkisar dari 0 hingga 100, dengan angka yang lebih tinggi menunjukkan tingkat akumulasi yang lebih tinggi dibandingkan dengan perusahaan sejenisnya, dan 50 adalah rata-ratanya.
Frekuensi Pembaruan: Setiap Hari
Lihat Ownership Explorer, yang menyediakan daftar perusahaan dengan peringkat tertinggi.
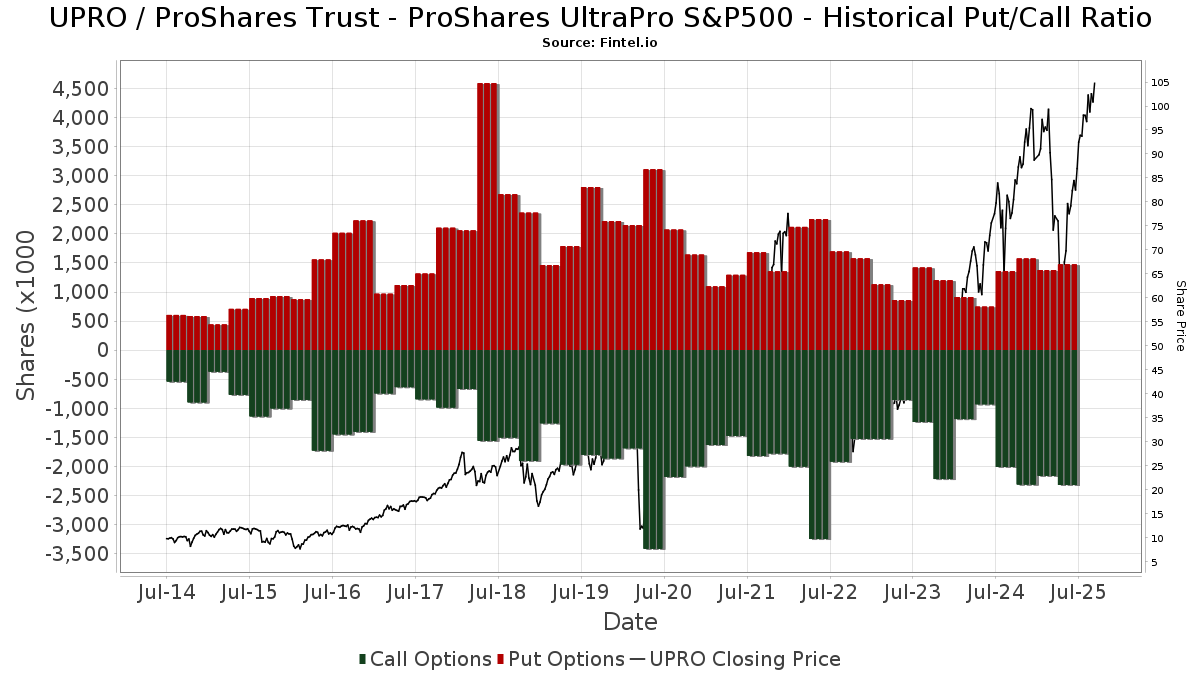
Rasio Put/Call Institusional
Selain melaporkan isu ekuitas dan utang standar, institusi dengan aset di bawah manajemen lebih dari 100 juta dolar AS juga harus mengungkapkan kepemilikan opsi put dan call mereka. Karena opsi put umumnya menunjukkan sentimen negatif, dan opsi call menunjukkan sentimen positif, kita dapat mengetahui sentimen institusional secara keseluruhan dengan memplot rasio put terhadap call. Grafik di sebelah kanan memplot rasio put/call historis untuk instrumen ini.
Menggunakan Rasio Put/Call sebagai indikator sentimen investor mengatasi salah satu kekurangan utama dari penggunaan total kepemilikan institusional, yaitu sejumlah besar aset yang dikelola diinvestasikan secara pasif untuk melacak indeks. Dana yang dikelola secara pasif biasanya tidak membeli opsi, sehingga indikator rasio put/call lebih akurat dalam melacak sentimen dana yang dikelola secara aktif.
Pengajuan 13F dan NPORT
Detail pada pengajuan 13F tersedia gratis. Detail pada pengajuan NP memerlukan keanggotaan premium. Baris berwarna hijau menunjukkan posisi baru. Baris berwarna merah menunjukkan posisi yang sudah ditutup. Klik tautan ini ikon untuk melihat riwayat transaksi selengkapnya.
Tingkatkan
untuk membuka data premium dan mengekspor ke Excel ![]() .
.
| Tanggal File | Sumber | Investor | Ketik | Presyo ng Avg (Silangan) |
Saham | Δ Saham (%) |
Dilaporkan Nilai ($1000) |
Nilai Δ (%) |
Alokasi Port (%) |
|
|---|---|---|---|---|---|---|---|---|---|---|
| 2025-08-11 | 13F | Bellwether Advisors, LLC | 250 | 23 | ||||||
| 2025-08-14 | 13F | CoreCap Advisors, LLC | 122 | 121.82 | 11 | 175.00 | ||||
| 2025-08-27 | 13F/A | Squarepoint Ops LLC | 0 | -100.00 | 0 | -100.00 | ||||
| 2025-08-07 | 13F | Sollinda Capital Management LLC | 15,006 | 9.21 | 1,372 | 35.17 | ||||
| 2025-08-07 | 13F | HC Advisors, LLC | 2,681 | 245 | ||||||
| 2025-07-11 | 13F | Farther Finance Advisors, LLC | 2,033 | 608.36 | 186 | 780.95 | ||||
| 2025-08-14 | 13F | Federation des caisses Desjardins du Quebec | 85 | 0.00 | 8 | 16.67 | ||||
| 2025-07-16 | 13F | ORG Wealth Partners, LLC | 250 | 0.00 | 23 | 22.22 | ||||
| 2025-08-27 | 13F/A | Squarepoint Ops LLC | Put | 0 | -100.00 | 0 | -100.00 | |||
| 2025-08-06 | 13F | Legacy Wealth Managment, LLC/ID | 700 | 64 | ||||||
| 2025-08-01 | 13F | SYM FINANCIAL Corp | 5,136 | 470 | ||||||
| 2025-08-12 | 13F | J.w. Cole Advisors, Inc. | 3,086 | 0.29 | 282 | 24.23 | ||||
| 2025-08-06 | 13F | Legacy Investment Solutions, LLC | 700 | 64 | ||||||
| 2025-08-06 | 13F | Longview Financial Advisors LLC | 14 | 0.00 | 1 | 0.00 | ||||
| 2025-08-12 | 13F | BlackRock, Inc. | 4,237 | 0.00 | 387 | 23.64 | ||||
| 2025-05-14 | 13F | Jump Financial, LLC | 0 | -100.00 | 0 | |||||
| 2025-08-14 | 13F | Two Sigma Securities, Llc | 0 | -100.00 | 0 | |||||
| 2025-07-08 | 13F | Silverleafe Capital Partners, LLC | 5,847 | 85.09 | 535 | 129.18 | ||||
| 2025-08-14 | 13F | Mariner, LLC | 9,066 | -37.91 | 829 | -23.17 | ||||
| 2025-07-28 | 13F | Triton Wealth Management, PLLC | 4,244 | 417 | ||||||
| 2025-08-08 | 13F | Larson Financial Group LLC | 3,717 | 0.03 | 340 | 23.72 | ||||
| 2025-08-13 | 13F | Beacon Pointe Advisors, LLC | 8,998 | 0.00 | 823 | 23.80 | ||||
| 2025-08-15 | 13F | CI Private Wealth, LLC | 24,907 | 31.12 | 2,277 | 62.30 | ||||
| 2025-08-14 | 13F | GWM Advisors LLC | 984 | 0.00 | 90 | 23.61 | ||||
| 2025-05-12 | 13F | Townsquare Capital Llc | 0 | -100.00 | 0 | |||||
| 2025-07-22 | 13F | CPR Investments Inc. | 8,218 | 751 | ||||||
| 2025-08-14 | 13F | UBS Group AG | 89,699 | 16.51 | 8,202 | 44.17 | ||||
| 2025-08-18 | 13F | Wolverine Trading, Llc | Call | 0 | -100.00 | 0 | ||||
| 2025-08-11 | 13F | Gr Financial Group, Llc | 3,059 | 280 | ||||||
| 2025-08-06 | 13F | Mark Sheptoff Financial Planning, Llc | 452 | 0.00 | 41 | 24.24 | ||||
| 2025-07-14 | 13F | Golden State Equity Partners | 14,676 | -1.82 | 1,342 | 21.47 | ||||
| 2025-07-24 | 13F | IFP Advisors, Inc | 16 | 1 | ||||||
| 2025-07-10 | 13F | American Financial Advisors, LLC | 6,042 | 0.00 | 553 | 23.77 | ||||
| 2025-08-04 | 13F | Assetmark, Inc | 2,943 | 269 | ||||||
| 2025-05-15 | 13F | Parallax Volatility Advisers, L.P. | Call | 0 | -100.00 | 0 | -100.00 | |||
| 2025-07-16 | 13F | Essex Financial Services, Inc. | 2,697 | 247 | ||||||
| 2025-08-12 | 13F | Insigneo Advisory Services, Llc | 4,761 | 0.89 | 435 | 25.00 | ||||
| 2025-07-24 | 13F | Blair William & Co/il | 1,522 | 0.00 | 139 | 24.11 | ||||
| 2025-04-17 | 13F | Variant Private Wealth, LLC | 0 | -100.00 | 0 | |||||
| 2025-07-08 | 13F | Rise Advisors, LLC | 720 | 0.28 | 66 | 22.64 | ||||
| 2025-08-18 | 13F | Wolverine Trading, Llc | Put | 0 | -100.00 | 0 | ||||
| 2025-07-07 | 13F | Discipline Wealth Solutions, LLC | 9,111 | 833 | ||||||
| 2025-08-04 | 13F | Hantz Financial Services, Inc. | 1,222 | 0.25 | 0 | |||||
| 2025-07-21 | 13F | Precedent Wealth Partners, Llc | 3,264 | 298 | ||||||
| 2025-08-14 | 13F | Jane Street Group, Llc | Call | 439,900 | 92.52 | 40,224 | 138.21 | |||
| 2025-07-09 | 13F | Westmount Partners, LLC | 8,226 | 3.37 | 752 | 27.89 | ||||
| 2025-08-01 | 13F | Ashton Thomas Private Wealth, LLC | 26,184 | 329.88 | 2,401 | 432.37 | ||||
| 2025-08-14 | 13F | Jane Street Group, Llc | Put | 199,300 | 45.90 | 18,224 | 80.53 | |||
| 2025-08-08 | 13F | Creative Planning | 36,494 | 14.47 | 3,337 | 41.64 | ||||
| 2025-08-13 | 13F | Millington Financial Advisors, LLC | 28,481 | 4.17 | 2,793 | 67.25 | ||||
| 2025-08-13 | 13F | Quadrature Capital Ltd | 71,070 | 6,497 | ||||||
| 2025-05-27 | NP | NAVFX - The Sector Rotation Fund No Load Shares | 15,000 | 50.00 | 1,108 | 25.06 | ||||
| 2025-07-21 | 13F | Quent Capital, LLC | 0 | -100.00 | 0 | |||||
| 2025-08-18 | 13F | Geneos Wealth Management Inc. | 157 | 15.44 | 14 | 40.00 | ||||
| 2025-05-15 | 13F | Parallax Volatility Advisers, L.P. | Put | 0 | -100.00 | 0 | -100.00 | |||
| 2025-08-12 | 13F | Change Path, LLC | 5,366 | 22.76 | 491 | 51.70 | ||||
| 2025-07-24 | 13F | WMG Financial Advisors, LLC | 7,266 | 0.00 | 664 | 23.88 | ||||
| 2025-08-13 | 13F | Northwestern Mutual Wealth Management Co | 1,942 | 0.00 | 178 | 23.78 | ||||
| 2025-08-01 | 13F | Howard Capital Management Inc. | 1,190,076 | 109,093 | ||||||
| 2025-05-13 | 13F | Stone House Investment Management, LLC | 0 | -100.00 | 0 | |||||
| 2025-08-13 | 13F | Jones Financial Companies Lllp | 100 | 9 | ||||||
| 2025-05-09 | 13F | Strategic Investment Solutions, Inc. /IL | 0 | 52 | ||||||
| 2025-07-29 | 13F | TFC Financial Management | 100 | 0.00 | 9 | 28.57 | ||||
| 2025-07-22 | 13F | IMC-Chicago, LLC | 0 | -100.00 | 0 | |||||
| 2025-08-12 | 13F | XTX Topco Ltd | 0 | -100.00 | 0 | |||||
| 2025-07-18 | 13F | PFG Investments, LLC | 0 | -100.00 | 0 | |||||
| 2025-08-13 | 13F | HAP Trading, LLC | Call | 10,200 | 131 | |||||
| 2025-08-04 | 13F | Pensionmark Financial Group, Llc | 9,231 | 40.85 | 845 | 74.23 | ||||
| 2025-08-26 | NP | CRDBX - Conquer Risk Defensive Bull Fund | 3,186,032 | 134.68 | 291,331 | 292.03 | ||||
| 2025-08-05 | 13F | Uniting Wealth Partners, LLC | 21,000 | 250.00 | 1,920 | 333.41 | ||||
| 2025-08-07 | 13F | Parkside Financial Bank & Trust | 92 | 0.00 | 8 | 33.33 | ||||
| 2025-08-07 | 13F | Encompass More Asset Management | 11,375 | 1,040 | ||||||
| 2025-07-14 | 13F | UMA Financial Services, Inc. | 846 | 100.47 | 77 | 148.39 | ||||
| 2025-08-13 | 13F | Continuum Advisory, LLC | 0 | -100.00 | 0 | |||||
| 2025-07-07 | 13F | Kings Path Partners LLC | 28 | -41.67 | 3 | -33.33 | ||||
| 2025-07-14 | 13F | Toth Financial Advisory Corp | 27,267 | 40.18 | 2,493 | 73.49 | ||||
| 2025-07-15 | 13F | Great Oak Capital Partners, Llc | 0 | -100.00 | 0 | |||||
| 2025-08-13 | 13F | StoneX Group Inc. | 6,497 | 26.11 | 595 | 55.91 | ||||
| 2025-07-08 | 13F | Parallel Advisors, LLC | 629 | 0.32 | 57 | 23.91 | ||||
| 2025-05-01 | 13F | Cwm, Llc | 0 | -100.00 | 0 | |||||
| 2025-08-04 | 13F | Spire Wealth Management | 1,101 | 101 | ||||||
| 2025-08-14 | 13F | Hrt Financial Lp | 10,307 | 1 | ||||||
| 2025-08-06 | 13F | Founders Financial Securities Llc | 8,280 | 757 | ||||||
| 2025-05-02 | 13F | Edgestream Partners, L.P. | 0 | -100.00 | 0 | |||||
| 2025-07-08 | 13F | Hickory Point Bank & Trust | 5,020 | 1.41 | 459 | 25.75 | ||||
| 2025-08-27 | 13F/A | Squarepoint Ops LLC | Call | 33,900 | 0.00 | 3,100 | 23.71 | |||
| 2025-08-08 | 13F | Gts Securities Llc | 47,814 | 553.46 | 4,378 | 710.74 | ||||
| 2025-08-14 | 13F | Fortress Private Ledger, Llc | 6,618 | 37.67 | 605 | 70.42 | ||||
| 2025-07-18 | 13F | Provident Wealth Management, LLC | 2,000 | 0.00 | 183 | 23.81 | ||||
| 2025-04-23 | 13F | Financial Life Planners | 0 | -100.00 | 0 | |||||
| 2025-08-14 | 13F | Bank Of America Corp /de/ | 983 | 90 | ||||||
| 2025-07-17 | 13F | LexAurum Advisors, LLC | 2,475 | 226 | ||||||
| 2025-08-08 | 13F | SBI Securities Co., Ltd. | 1,460 | 14.60 | 134 | 41.49 | ||||
| 2025-08-14 | 13F | Fort Point Capital Partners LLC | 8,750 | -1.35 | 802 | 22.44 | ||||
| 2025-08-27 | NP | HCMNX - HCM Dividend Sector Plus Fund Class A Shares | 1,190,076 | 108,821 | ||||||
| 2025-07-23 | 13F | Vontobel Holding Ltd. | 4,500 | 411 | ||||||
| 2025-05-12 | 13F | Fmr Llc | 0 | -100.00 | 0 | |||||
| 2025-05-15 | 13F | DRW Securities, LLC | 0 | -100.00 | 0 | |||||
| 2025-07-10 | 13F | Marshall Financial Group LLC | 11,717 | 1,084 | ||||||
| 2025-08-14 | 13F | Wells Fargo & Company/mn | 2 | 100.00 | 0 | |||||
| 2025-08-07 | 13F | Allworth Financial LP | 627 | 96.55 | 57 | 185.00 | ||||
| 2025-08-12 | 13F | Proequities, Inc. | 0 | 0 | ||||||
| 2025-08-18 | 13F | Wolverine Trading, Llc | 0 | -100.00 | 0 | |||||
| 2025-08-14 | 13F | Mercer Global Advisors Inc /adv | 3,027 | -58.09 | 277 | -48.22 | ||||
| 2025-07-14 | 13F | Abound Wealth Management | 6 | 0.00 | 1 | |||||
| 2025-07-15 | 13F | Kwmg, Llc | 8,042 | 45.74 | 735 | 80.59 | ||||
| 2025-08-13 | 13F | Rsm Us Wealth Management Llc | 3,720 | 0.22 | 341 | 24.00 | ||||
| 2025-05-12 | 13F | Citigroup Inc | 0 | -100.00 | 0 | |||||
| 2025-07-29 | 13F | Koshinski Asset Management, Inc. | 5,525 | 99.82 | 505 | 147.55 | ||||
| 2025-08-14 | 13F | Group One Trading, L.p. | 19,502 | 1,783 | ||||||
| 2025-08-06 | 13F | Wsfs Capital Management, Llc | 7,929 | 0.00 | 725 | 23.93 | ||||
| 2025-07-29 | 13F | DeDora Capital, Inc. | 18,280 | 0.00 | 1,672 | 23.78 | ||||
| 2025-04-22 | 13F/A | NorthRock Partners, LLC | 0 | -100.00 | 0 | -100.00 | ||||
| 2025-07-25 | 13F | Ellis Investment Partners, LLC | 10,205 | 5.13 | 933 | 30.13 | ||||
| 2025-08-01 | 13F | Envestnet Asset Management Inc | 2,724 | 249 | ||||||
| 2025-08-15 | 13F | Tower Research Capital LLC (TRC) | 27,153 | -13.99 | 2,483 | 12.36 | ||||
| 2025-08-12 | 13F | CIBC Private Wealth Group, LLC | 1,550 | 5.80 | 142 | 90.54 | ||||
| 2025-08-14 | 13F | Jane Street Group, Llc | 0 | -100.00 | 0 | |||||
| 2025-08-14 | 13F | Dagco, Inc. | 251 | 18.96 | 23 | 46.67 | ||||
| 2025-04-18 | 13F | Clayton Financial Group LLC | 0 | -100.00 | 0 | |||||
| 2025-07-28 | 13F | Axxcess Wealth Management, Llc | 182,914 | 2,778.27 | 16,726 | 3,466.10 | ||||
| 2025-08-14 | 13F | Spectrum Financial Alliance Ltd LLC | 83,958 | 185.41 | 8,234 | 278.88 | ||||
| 2025-08-14 | 13F | Headlands Technologies LLC | 2,847 | -3.75 | 260 | 19.27 | ||||
| 2025-08-13 | 13F | Flow Traders U.s. Llc | 0 | -100.00 | 0 | |||||
| 2025-08-13 | 13F | EverSource Wealth Advisors, LLC | 9,325 | -60.83 | 853 | -51.56 | ||||
| 2025-05-06 | 13F | Innova Wealth Partners | 0 | -100.00 | 0 | |||||
| 2025-08-08 | 13F | Mittelman Wealth Management | 4,345 | 397 | ||||||
| 2025-08-07 | 13F | Timonier Family Office, LTD. | 8,254 | -0.48 | 757 | 23.13 | ||||
| 2025-08-18 | 13F | Hollencrest Capital Management | 25 | 0.00 | 2 | 100.00 | ||||
| 2025-06-17 | 13F | Ridgepath Capital Management LLC | 6,782 | -3.64 | 501 | -19.58 | ||||
| 2025-08-05 | 13F | Prosperity Wealth Management, Inc. | 36,839 | 3,369 | ||||||
| 2025-08-12 | 13F | Putnam Fl Investment Management Co | 5,352 | 0.00 | 489 | 23.80 | ||||
| 2025-08-13 | 13F | Safe Harbor Fiduciary, LLC | 423 | -98.09 | 39 | -97.68 | ||||
| 2025-05-15 | 13F | Tudor Investment Corp Et Al | 0 | -100.00 | 0 | |||||
| 2025-05-14 | 13F | Walleye Trading LLC | 0 | -100.00 | 0 | |||||
| 2025-05-08 | 13F | Menard Financial Group LLC | 0 | -100.00 | 0 | |||||
| 2025-05-14 | 13F | Walleye Trading LLC | Put | 0 | -100.00 | 0 | ||||
| 2025-07-30 | 13F | Financial Perspectives, Inc | 0 | -100.00 | 0 | |||||
| 2025-07-15 | 13F | Main Street Group, LTD | 48,829 | 10.45 | 4,465 | 36.68 | ||||
| 2025-08-14 | 13F | Susquehanna International Group, Llp | Put | 362,700 | 5.59 | 33,165 | 30.65 | |||
| 2025-08-04 | 13F | Mayflower Financial Advisors, LLC | 2,967 | 271 | ||||||
| 2025-08-14 | 13F | Susquehanna International Group, Llp | 50,418 | -69.18 | 4,610 | -61.87 | ||||
| 2025-08-12 | 13F | Jpmorgan Chase & Co | 32,117 | 8,796.68 | 2,937 | 11,192.31 | ||||
| 2025-08-06 | 13F | AE Wealth Management LLC | 84 | -69.57 | 8 | -65.00 | ||||
| 2025-08-14 | 13F | Citadel Advisors Llc | Call | 1,036,300 | -17.75 | 94,759 | 1.78 | |||
| 2025-08-14 | 13F | Susquehanna International Group, Llp | Call | 795,300 | 95.65 | 72,722 | 142.08 | |||
| 2025-07-07 | 13F | Wealth Alliance Advisory Group, LLC | 5,287 | -29.87 | 483 | -13.29 | ||||
| 2025-08-13 | 13F | Lido Advisors, LLC | Put | 1,600 | 146 | |||||
| 2025-05-29 | NP | TFAQX - TFA Quantitative Fund Class I | 9,600 | 9,500.00 | 709 | 8,762.50 | ||||
| 2025-09-04 | 13F/A | Advisor Group Holdings, Inc. | 123 | -69.10 | 11 | -62.07 | ||||
| 2025-07-03 | 13F | Garde Capital, Inc. | 0 | -100.00 | 0 | |||||
| 2025-08-13 | 13F | Lido Advisors, LLC | 17,677 | 4.73 | 1,621 | 29.60 | ||||
| 2025-08-12 | 13F | Erickson Financial Group, LLC | 8,998 | 9.95 | 823 | 36.09 | ||||
| 2025-04-25 | 13F | Red Tortoise LLC | 0 | -100.00 | 0 | |||||
| 2025-07-29 | 13F | Calamos Wealth Management LLC | 3,165 | 0.00 | 289 | 24.03 | ||||
| 2025-08-05 | 13F | Simplex Trading, Llc | 1,599 | -94.77 | 0 | -100.00 | ||||
| 2025-08-06 | 13F | Nicholas Hoffman & Company, LLC. | 2,877 | 263 | ||||||
| 2025-08-14 | 13F | Qube Research & Technologies Ltd | 0 | -100.00 | 0 | |||||
| 2025-08-12 | 13F | WealthTrak Capital Management LLC | 116 | 11 | ||||||
| 2025-07-16 | 13F | Signaturefd, Llc | 414 | -71.51 | 38 | -65.42 | ||||
| 2025-08-06 | 13F | Commonwealth Equity Services, Llc | 3,779 | 2.97 | 0 | |||||
| 2025-08-14 | 13F | Citadel Advisors Llc | 347,277 | 1,523.47 | 31,755 | 1,909.81 | ||||
| 2025-08-14 | 13F | Citadel Advisors Llc | Put | 910,500 | 23.12 | 83,256 | 52.35 | |||
| 2025-07-31 | 13F | Glass Jacobson Investment Advisors llc | 336 | 0.00 | 31 | 3.45 | ||||
| 2025-08-15 | 13F | Morgan Stanley | 4,329 | -85.00 | 396 | -81.47 |
Other Listings
| PE:UPRO |