Mga Batayang Estadistika
| Pemilik Institusional | 345 total, 343 long only, 0 short only, 2 long/short - change of -4.12% MRQ |
| Alokasi Portofolio Rata-rata | 0.8732 % - change of -8.55% MRQ |
| Saham Institusional (Jangka Panjang) | 152,686,030 (ex 13D/G) - change of 13.25MM shares 9.49% MRQ |
| Nilai Institusional (Jangka Panjang) | $ 7,010,210 USD ($1000) |
Kepemilikan Institusional dan Pemegang Saham
Vanguard Scottsdale Funds - Vanguard Long-Term Corporate Bond ETF (US:VCLT) memiliki 345 pemilik institusional dan pemegang saham yang telah mengajukan formulir 13D/G atau 13F kepada Komisi Bursa Efek (Securities Exchange Commission/SEC). Lembaga-lembaga ini memegang total 152,686,030 saham. Pemegang saham terbesar meliputi Gallagher Fiduciary Advisors, LLC, Prudential Plc, Morgan Stanley, VTC - Vanguard Total Corporate Bond ETF ETF Shares, Meiji Yasuda Life Insurance Co, State of Tennessee, Treasury Department, Allianz Investment Management U.S. LLC, Bank Of America Corp /de/, Charles Schwab Investment Management Inc, and Angeles Investment Advisors, LLC .
Struktur kepemilikan institusional Vanguard Scottsdale Funds - Vanguard Long-Term Corporate Bond ETF (NasdaqGM:VCLT) menunjukkan posisi terkini di perusahaan oleh institusi dan dana, serta perubahan terbaru dalam ukuran posisi. Pemegang saham utama dapat mencakup investor individu, reksa dana, dana lindung nilai, atau institusi. Jadwal 13D menunjukkan bahwa investor memegang (atau pernah memegang) lebih dari 5% saham perusahaan dan bermaksud (atau pernah bermaksud) untuk secara aktif mengejar perubahan strategi bisnis. Jadwal 13G menunjukkan investasi pasif lebih dari 5%.
The share price as of September 5, 2025 is 77.05 / share. Previously, on September 9, 2024, the share price was 80.96 / share. This represents a decline of 4.83% over that period.

Skor Sentimen Dana
Skor Sentimen Dana (sebelumnya dikenal sebagai Skor Akumulasi Kepemilikan) menemukan saham-saham yang paling banyak dibeli oleh dana. Ini adalah hasil dari model kuantitatif multi-faktor yang canggih yang mengidentifikasi perusahaan dengan tingkat akumulasi institusional tertinggi. Model penilaian menggunakan kombinasi dari total peningkatan pemilik yang diungkapkan, perubahan dalam alokasi portofolio pada pemilik tersebut, dan metrik lainnya. Angka berkisar dari 0 hingga 100, dengan angka yang lebih tinggi menunjukkan tingkat akumulasi yang lebih tinggi dibandingkan dengan perusahaan sejenisnya, dan 50 adalah rata-ratanya.
Frekuensi Pembaruan: Setiap Hari
Lihat Ownership Explorer, yang menyediakan daftar perusahaan dengan peringkat tertinggi.
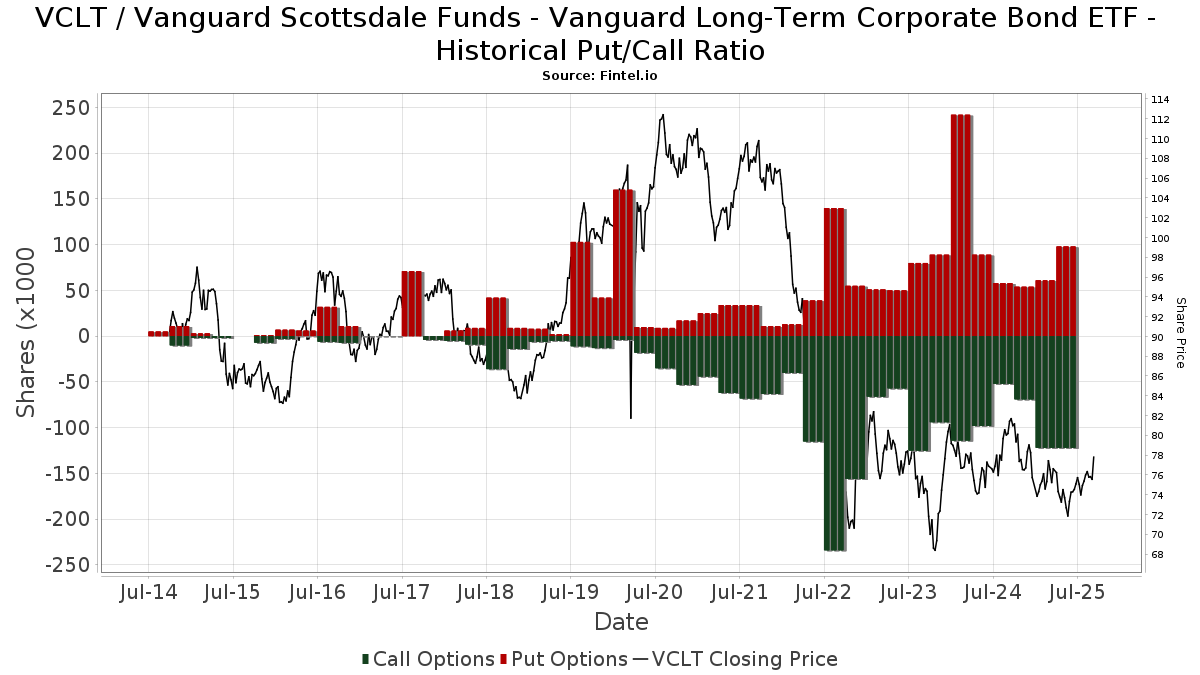
Rasio Put/Call Institusional
Selain melaporkan isu ekuitas dan utang standar, institusi dengan aset di bawah manajemen lebih dari 100 juta dolar AS juga harus mengungkapkan kepemilikan opsi put dan call mereka. Karena opsi put umumnya menunjukkan sentimen negatif, dan opsi call menunjukkan sentimen positif, kita dapat mengetahui sentimen institusional secara keseluruhan dengan memplot rasio put terhadap call. Grafik di sebelah kanan memplot rasio put/call historis untuk instrumen ini.
Menggunakan Rasio Put/Call sebagai indikator sentimen investor mengatasi salah satu kekurangan utama dari penggunaan total kepemilikan institusional, yaitu sejumlah besar aset yang dikelola diinvestasikan secara pasif untuk melacak indeks. Dana yang dikelola secara pasif biasanya tidak membeli opsi, sehingga indikator rasio put/call lebih akurat dalam melacak sentimen dana yang dikelola secara aktif.
Pengajuan 13D/G
Kami menyajikan pengajuan 13D/G secara terpisah dari pengajuan 13F karena perlakuan yang berbeda oleh SEC. Pengajuan 13D/G dapat diajukan oleh kelompok investor (dengan satu pemimpin), sedangkan pengajuan 13F tidak bisa. Hal ini mengakibatkan situasi di mana seorang investor dapat mengajukan 13D/G yang melaporkan satu nilai untuk total saham (mewakili semua saham yang dimiliki oleh kelompok investor), tetapi kemudian mengajukan 13F yang melaporkan nilai yang berbeda untuk total saham (mewakili kepemilikan mereka sendiri). Ini berarti bahwa kepemilikan saham dari pengajuan 13D/G dan pengajuan 13F seringkali tidak dapat dibandingkan secara langsung, sehingga kami menyajikannya secara terpisah.
Catatan: Mulai 16 Mei 2021, kami tidak lagi menampilkan pemilik yang belum mengajukan 13D/G dalam setahun terakhir. Sebelumnya, kami menampilkan riwayat lengkap pengajuan 13D/G. Secara umum, entitas yang diwajibkan untuk mengajukan pengajuan 13D/G harus mengajukan setidaknya setiap tahun sebelum mengirimkan pengajuan penutupan. Namun, terkadang dana keluar dari posisi tanpa mengirimkan pengajuan penutupan (misalnya, mereka menghentikan operasi), sehingga menampilkan riwayat lengkap terkadang menyebabkan kebingungan tentang kepemilikan saat ini. Untuk mencegah kebingungan, kami sekarang hanya menampilkan pemilik 'saat ini' - yaitu - pemilik yang telah mengajukan dalam setahun terakhir.
Upgrade to unlock premium data.
| Tanggal File | Formulir | Investor | Sebelumnya Saham |
Terbaru Saham |
Δ Saham (Persen) |
Kepemilikan (Persen) |
Δ Pagmamay-ari (Persen) |
|
|---|---|---|---|---|---|---|---|---|
| 2025-07-15 | BlackRock Portfolio Management LLC | 7,394,021 | 622,629 | -91.58 | 0.50 | -90.57 |
Pengajuan 13F dan NPORT
Detail pada pengajuan 13F tersedia gratis. Detail pada pengajuan NP memerlukan keanggotaan premium. Baris berwarna hijau menunjukkan posisi baru. Baris berwarna merah menunjukkan posisi yang sudah ditutup. Klik tautan ini ikon untuk melihat riwayat transaksi selengkapnya.
Tingkatkan
untuk membuka data premium dan mengekspor ke Excel ![]() .
.
| Tanggal File | Sumber | Investor | Ketik | Presyo ng Avg (Silangan) |
Saham | Δ Saham (%) |
Dilaporkan Nilai ($1000) |
Nilai Δ (%) |
Alokasi Port (%) |
|
|---|---|---|---|---|---|---|---|---|---|---|
| 2025-08-14 | 13F | Raymond James Financial Inc | 694,259 | -3.41 | 52,694 | -3.42 | ||||
| 2025-07-23 | 13F | H&H Retirement Design & Management INC | 99,207 | 9.50 | 7,422 | 13.38 | ||||
| 2025-07-28 | 13F | Sagace Wealth Management LLC | 42,973 | 1.88 | 3,262 | 1.87 | ||||
| 2025-07-22 | 13F | Sage Investment Counsel LLC | 5,265 | 0.00 | 400 | 0.00 | ||||
| 2025-07-22 | 13F | Oak Hill Wealth Advisors, Llc | 6,163 | 459 | ||||||
| 2025-08-07 | 13F | Alpha Cubed Investments, LLC | 8,269 | 628 | ||||||
| 2025-08-14 | 13F | Citadel Advisors Llc | 77,737 | -76.63 | 5,900 | -76.63 | ||||
| 2025-07-28 | 13F | Perfromance Wealth Partners, LLC | 4,291 | -24.67 | 326 | -24.77 | ||||
| 2025-08-08 | 13F | Hartland & Co., LLC | 0 | -100.00 | 0 | |||||
| 2025-08-14 | 13F | Citadel Advisors Llc | Put | 15,800 | 12.86 | 1,199 | 12.90 | |||
| 2025-08-14 | 13F | Citadel Advisors Llc | Call | 6,700 | 31.37 | 509 | 31.27 | |||
| 2025-07-25 | 13F | NorthRock Partners, LLC | 906 | 655.00 | 69 | 655.56 | ||||
| 2025-07-23 | 13F | Kingswood Wealth Advisors, Llc | 26,927 | 0.89 | 2,044 | 0.89 | ||||
| 2025-08-08 | 13F | Pnc Financial Services Group, Inc. | 163,392 | -19.37 | 12,401 | -19.38 | ||||
| 2025-07-31 | 13F | City State Bank | 48 | 0.00 | 4 | 0.00 | ||||
| 2025-05-15 | 13F | BTG Pactual Asset Management US LLC | 0 | -100.00 | 0 | |||||
| 2025-08-11 | 13F | Lcnb Corp | 5,190 | 4.05 | 394 | 3.97 | ||||
| 2025-08-15 | 13F | Morgan Stanley | 5,324,964 | -8.63 | 404,165 | -8.64 | ||||
| 2025-08-14 | 13F | Bnp Paribas | 118,378 | 2,534.13 | 8,985 | 2,534.60 | ||||
| 2025-08-14 | 13F | Transamerica Financial Advisors, Inc. | 4 | 0.00 | 0 | |||||
| 2025-08-14 | 13F | CoreCap Advisors, LLC | 9,615 | -97.81 | 730 | -97.81 | ||||
| 2025-08-28 | NP | SCLAX - SIMT MULTI-ASSET CAPITAL STABILITY FUND Class F | 1,901 | -43.96 | 144 | -43.97 | ||||
| 2025-08-15 | 13F | United Services Automobile Association | 189,350 | -50.00 | 14,372 | -49.91 | ||||
| 2025-07-15 | 13F | Fifth Third Bancorp | 557 | 1.09 | 42 | 2.44 | ||||
| 2025-08-13 | 13F | Jones Financial Companies Lllp | 54,236 | 8.49 | 4,079 | 7.91 | ||||
| 2025-08-05 | 13F | McGinn Investment Management, Inc. | 0 | -100.00 | 0 | |||||
| 2025-08-06 | 13F | Wedbush Securities Inc | 0 | -100.00 | 0 | |||||
| 2025-08-29 | NP | BHILX - BHILL Fund Managed Account Completion Shares | 18,416 | 1,398 | ||||||
| 2025-08-05 | 13F | NewSquare Capital LLC | 59,597 | 2.92 | 4,523 | 2.91 | ||||
| 2025-07-29 | 13F | Stableford Capital Ii Llc | 3,689 | 4.56 | 278 | 6.95 | ||||
| 2025-07-29 | 13F | Tide Cove Capital Partners LLC | 31,293 | 2.62 | 2,345 | 1.30 | ||||
| 2025-08-14 | 13F | Sunbelt Securities, Inc. | 300 | -0.66 | 22 | 0.00 | ||||
| 2025-08-05 | 13F | Bank Of Montreal /can/ | 2,727 | 0.07 | 207 | 0.00 | ||||
| 2025-08-14 | 13F | Cardiff Park Advisors, Llc | 280 | 1.45 | 21 | 5.00 | ||||
| 2025-07-22 | 13F | Checchi Capital Advisers, LLC | 28,080 | -82.94 | 2,131 | -82.94 | ||||
| 2025-08-06 | 13F | Anchor Capital Advisors Llc | 4,135 | 0.00 | 314 | 0.00 | ||||
| 2025-07-23 | 13F | WestEnd Advisors, LLC | 533 | 17.66 | 40 | 17.65 | ||||
| 2025-08-14 | 13F | Capitolis Liquid Global Markets LLC | 670,500 | 50,891 | ||||||
| 2025-07-28 | 13F | Rosenberg Matthew Hamilton | 10,565 | -6.85 | 802 | -6.86 | ||||
| 2025-05-02 | 13F | Dakota Wealth Management | 0 | -100.00 | 0 | |||||
| 2025-07-15 | 13F | Avaii Wealth Management, Llc | 6,224 | 2.27 | 472 | 2.39 | ||||
| 2025-08-05 | 13F | Tsfg, Llc | 1,500 | 1.49 | 0 | |||||
| 2025-08-21 | 13F | Aveo Capital Partners, LLC | 0 | -100.00 | 0 | |||||
| 2025-08-11 | 13F | Capital Square, LLC | 14,036 | -2.32 | 1,044 | -4.31 | ||||
| 2025-08-14 | 13F | Peapack Gladstone Financial Corp | 0 | -100.00 | 0 | |||||
| 2025-08-14 | 13F | Mariner, LLC | 6,494 | -2.83 | 493 | -2.96 | ||||
| 2025-07-10 | 13F | Websterrogers Financial Advisors, Llc | 87,630 | 1.42 | 6,651 | 1.40 | ||||
| 2025-06-25 | NP | RLGAX - RiverFront Asset Allocation Growth & Income Investor Shares | 0 | -100.00 | 0 | -100.00 | ||||
| 2025-05-02 | 13F | First Command Advisory Services, Inc. | 0 | -100.00 | 0 | |||||
| 2025-08-29 | 13F | Centaurus Financial, Inc. | 1,450 | -5.91 | 0 | |||||
| 2025-04-28 | 13F | Principal Financial Group Inc | 0 | -100.00 | 0 | |||||
| 2025-08-14 | 13F | Optiver Holding B.V. | 118 | 9 | ||||||
| 2025-08-14 | 13F | Old Mission Capital Llc | 0 | -100.00 | 0 | |||||
| 2025-05-15 | 13F | Keebeck Wealth Management, LLC | 0 | -100.00 | 0 | |||||
| 2025-07-16 | 13F | Register Financial Advisors LLC | 152 | 12 | ||||||
| 2025-08-14 | 13F | Mml Investors Services, Llc | 387,173 | -5.58 | 29 | -6.45 | ||||
| 2025-07-15 | 13F | Td Private Client Wealth Llc | 1,042 | 79 | ||||||
| 2025-04-25 | NP | VTC - Vanguard Total Corporate Bond ETF ETF Shares | 5,066,991 | 9.39 | 391,729 | 7.06 | ||||
| 2025-08-20 | 13F/A | Coppell Advisory Solutions LLC | 6,423 | -3.01 | 483 | -2.82 | ||||
| 2025-07-21 | 13F | Crews Bank & Trust | 5,475 | -14.09 | 416 | -14.08 | ||||
| 2025-07-30 | 13F | Nottingham Advisors, Inc. | 18,582 | -73.82 | 1,410 | -73.83 | ||||
| 2025-07-23 | 13F | Prime Capital Investment Advisors, LLC | 10,467 | 6.61 | 794 | 6.58 | ||||
| 2025-07-17 | 13F | Raleigh Capital Management Inc. | 0 | -100.00 | 0 | |||||
| 2025-08-13 | 13F | 1832 Asset Management L.P. | 357,866 | 5.26 | 27,162 | 5.25 | ||||
| 2025-07-30 | 13F | White Lighthouse Investment Management Inc. | 78,502 | 0.01 | 5,958 | 0.00 | ||||
| 2025-05-15 | 13F | BlueCrest Capital Management Ltd | 0 | -100.00 | 0 | |||||
| 2025-08-28 | NP | BlackRock Funds V - BlackRock Strategic Income Opportunities Portfolio Investor A Shares | 570,850 | 0.00 | 43,328 | -0.01 | ||||
| 2025-05-27 | NP | TINIX - AXS Tactical Income Fund Class I Shares | 20,187 | 1,532 | ||||||
| 2025-07-18 | 13F | Institute for Wealth Management, LLC. | 3,672 | 0.03 | 279 | 0.00 | ||||
| 2025-08-14 | 13F | Bnp Paribas Arbitrage, Sa | 902,723 | -18.14 | 68,517 | -18.15 | ||||
| 2025-04-15 | 13F | Ibex Wealth Advisors | 0 | -100.00 | 0 | |||||
| 2025-08-19 | 13F | National Asset Management, Inc. | 0 | -100.00 | 0 | |||||
| 2025-04-15 | 13F | Focus Financial Network, Inc. | 0 | -100.00 | 0 | -100.00 | ||||
| 2025-08-14 | 13F | Meiji Yasuda Life Insurance Co | 2,833,000 | 0.00 | 215,025 | -0.01 | ||||
| 2025-07-10 | 13F | Exchange Traded Concepts, Llc | 212,142 | 16,102 | ||||||
| 2025-07-21 | 13F | Ameriflex Group, Inc. | 16,156 | -9.47 | 1,218 | -10.04 | ||||
| 2025-04-30 | 13F | AlphaStar Capital Management, LLC | 0 | -100.00 | 0 | |||||
| 2025-08-12 | 13F | CIBC Private Wealth Group, LLC | 959 | 0.95 | 73 | 5.88 | ||||
| 2025-05-29 | NP | Northern Lights Fund Trust - Sierra Tactical Risk Spectrum 30 Fund Instl Class | 67,600 | 5,132 | ||||||
| 2025-08-13 | 13F | Scotia Capital Inc. | 0 | -100.00 | 0 | |||||
| 2025-08-13 | 13F | EverSource Wealth Advisors, LLC | 1,046 | 0.00 | 79 | 0.00 | ||||
| 2025-07-17 | 13F | Janney Montgomery Scott LLC | 124,487 | 2.04 | 9 | 0.00 | ||||
| 2025-08-13 | 13F | Cresset Asset Management, LLC | 11,266 | -21.04 | 855 | -21.05 | ||||
| 2025-08-14 | 13F | Two Sigma Securities, Llc | 0 | -100.00 | 0 | |||||
| 2025-08-01 | 13F | First National Trust Co | 4,415 | -3.03 | 335 | -2.90 | ||||
| 2025-08-14 | 13F | Gallagher Fiduciary Advisors, LLC | 59,297,124 | 19,539.62 | 786 | -96.57 | ||||
| 2025-08-12 | 13F | XTX Topco Ltd | 8,187 | 99.34 | 621 | 99.68 | ||||
| 2025-08-11 | 13F | Beaumont Capital Management, LLC | 33,748 | 1.21 | 2,561 | 1.19 | ||||
| 2025-07-08 | 13F | Nbc Securities, Inc. | 5,390 | 27.45 | 0 | |||||
| 2025-08-06 | 13F | Legacy Investment Solutions, LLC | 23 | 0.00 | 2 | 0.00 | ||||
| 2025-07-15 | 13F | Farrell Financial LLC | 26,913 | 7.12 | 2,043 | 7.08 | ||||
| 2025-07-30 | 13F | Avidian Wealth Solutions, LLC | 6,821 | -3.43 | 518 | -3.54 | ||||
| 2025-08-12 | 13F | Allianz Investment Management U.S. LLC | 2,416,012 | 0.00 | 183,375 | 3.60 | ||||
| 2025-07-15 | 13F | Sightline Wealth Advisors, LLC | 43,352 | 0.91 | 3,290 | 0.89 | ||||
| 2025-08-12 | 13F | RiverFront Investment Group, LLC | 64,839 | -49.01 | 4,921 | -49.02 | ||||
| 2025-08-11 | 13F | Nomura Asset Management Co Ltd | 0 | -100.00 | 0 | |||||
| 2025-08-14 | 13F | Goldman Sachs Group Inc | 95,577 | -39.58 | 7,254 | -39.59 | ||||
| 2025-08-01 | 13F | Ashton Thomas Private Wealth, LLC | 5,111 | 388 | ||||||
| 2025-07-22 | 13F | Belpointe Asset Management LLC | 146,005 | 11,082 | ||||||
| 2025-08-08 | 13F | Globe Life Inc. | 474,500 | 0.00 | 36,015 | -0.01 | ||||
| 2025-08-13 | 13F | Custom Index Systems, Llc | 8,549 | 649 | ||||||
| 2025-07-31 | 13F | Nisa Investment Advisors, Llc | 183,600 | 2.53 | 13,935 | 2.52 | ||||
| 2025-07-16 | 13F | Beaumont Financial Advisors, LLC | 3,480 | -11.25 | 264 | -11.11 | ||||
| 2025-07-31 | 13F | Topsail Wealth Management, LLC | 23,786 | 1.46 | 1,805 | 1.46 | ||||
| 2025-07-31 | 13F | Glass Jacobson Investment Advisors llc | 0 | -100.00 | 0 | |||||
| 2025-08-14 | 13F/A | Barclays Plc | 109,647 | 996,690.91 | 8 | |||||
| 2025-07-15 | 13F | Sheets Smith Wealth Management | 8,297 | 7.82 | 630 | 7.71 | ||||
| 2025-08-12 | 13F | Sandhill Capital Partners LLC | 4,143 | 0.00 | 314 | 0.00 | ||||
| 2025-08-14 | 13F | Daiwa Securities Group Inc. | 15,900 | 0.00 | 1 | 0.00 | ||||
| 2025-07-29 | 13F | Stephens Inc /ar/ | 2,640 | 200 | ||||||
| 2025-08-13 | 13F | Cerity Partners LLC | 0 | -100.00 | 0 | |||||
| 2025-07-30 | 13F | Bogart Wealth, LLC | 89 | 0.00 | 7 | 0.00 | ||||
| 2025-08-05 | 13F | Gould Asset Management Llc /ca/ | 5,894 | -39.49 | 447 | -39.51 | ||||
| 2025-08-04 | 13F | IFG Advisory, LLC | 34,490 | -6.56 | 2,618 | -6.57 | ||||
| 2025-05-29 | NP | SSIZX - Sierra Tactical Core Income Fund Class A Shares | 1,156,700 | 421.74 | 87,805 | 387.59 | ||||
| 2025-07-23 | 13F | Elm3 Financial Group, LLC | 5,907 | -47.07 | 448 | -47.11 | ||||
| 2025-08-15 | 13F | CI Private Wealth, LLC | 25,272 | 80.54 | 1,918 | 80.60 | ||||
| 2025-08-12 | 13F | Northwestern Mutual Investment Management Company, Llc | 274,190 | 20,811 | ||||||
| 2025-08-07 | 13F | Guidance Capital, Inc | 45,637 | 12.51 | 3,455 | 15.79 | ||||
| 2025-08-13 | 13F | Northern Trust Corp | 0 | -100.00 | 0 | |||||
| 2025-08-11 | 13F | TAGStone Capital, Inc. | 0 | -100.00 | 0 | |||||
| 2025-04-21 | 13F | Hartford Financial Management Inc. | 0 | -100.00 | 0 | |||||
| 2025-08-11 | 13F | Anfield Capital Management, LLC | 397 | 185.61 | 30 | 200.00 | ||||
| 2025-05-30 | NP | TBFG - The Brinsmere Fund - Growth ETF | 0 | -100.00 | 0 | -100.00 | ||||
| 2025-05-01 | 13F | High Note Wealth, LLC | 0 | -100.00 | 0 | |||||
| 2025-08-04 | 13F | Econ Financial Services Corp | 71,983 | 0.90 | 5,464 | 0.89 | ||||
| 2025-08-08 | 13F | Creative Planning | 7,854 | 1.21 | 596 | 1.19 | ||||
| 2025-08-26 | 13F/A | Thrivent Financial For Lutherans | 9,872 | 1 | ||||||
| 2025-08-08 | 13F | Emerald Investment Partners, Llc | 26,487 | -2.45 | 2,010 | -2.47 | ||||
| 2025-08-15 | 13F | Semmax Financial Advisors Inc. | 191 | 14 | ||||||
| 2025-05-29 | NP | Northern Lights Fund Trust - Sierra Tactical Risk Spectrum 70 Fund Investor Class | 7,300 | 2.82 | 554 | -3.82 | ||||
| 2025-07-21 | 13F | Mirae Asset Global Investments Co., Ltd. | 324,336 | 18.73 | 24,617 | 38.46 | ||||
| 2025-08-14 | 13F | Jane Street Group, Llc | 250,852 | -72.37 | 19,040 | -72.38 | ||||
| 2025-08-12 | 13F | Employees' Retirement Fund of the City of Fort Worth | 416,500 | 0.00 | 31,617 | 0.00 | ||||
| 2025-08-07 | 13F | Sound View Wealth Advisors Group, LLC | 5,195 | 0.00 | 394 | 0.00 | ||||
| 2025-08-11 | 13F | Aptus Capital Advisors, LLC | 204 | 0.00 | 15 | 0.00 | ||||
| 2025-07-31 | 13F | Wright Fund Managment, LLC | 1,327,700 | 0.00 | 100,786 | 0.00 | ||||
| 2025-07-30 | 13F | Onyx Bridge Wealth Group LLC | 4,408 | -40.33 | 335 | -40.36 | ||||
| 2025-08-08 | 13F | Pinney & Scofield, Inc. | 607 | 1.51 | 46 | 2.22 | ||||
| 2025-08-12 | 13F | Coldstream Capital Management Inc | 0 | -100.00 | 0 | |||||
| 2025-08-11 | 13F | AXS Investments LLC | 0 | -100.00 | 0 | |||||
| 2025-08-12 | 13F | MAI Capital Management | 1,198 | -17.21 | 91 | -17.43 | ||||
| 2025-08-14 | 13F | Ameriprise Financial Inc | 732,016 | -13.13 | 55,497 | -13.09 | ||||
| 2025-04-29 | 13F | Penserra Capital Management LLC | 0 | -100.00 | 0 | |||||
| 2025-08-05 | 13F | Cassaday & Co Wealth Management LLC | 0 | -100.00 | 0 | |||||
| 2025-08-06 | 13F | AE Wealth Management LLC | 319 | 8.50 | 24 | 9.09 | ||||
| 2025-08-13 | 13F | Dow Chemical Co /de/ | 264,221 | 0.00 | 20,054 | -0.01 | ||||
| 2025-08-08 | 13F | Avantax Advisory Services, Inc. | 17,958 | 2.62 | 1,363 | 2.64 | ||||
| 2025-08-13 | 13F | Invesco Ltd. | 64,985 | 0.24 | 4,932 | 0.22 | ||||
| 2025-07-29 | 13F | Private Trust Co Na | 5,869 | 0.00 | 445 | 0.00 | ||||
| 2025-08-14 | 13F | Toroso Investments, LLC | 7,950 | 601 | ||||||
| 2025-08-15 | 13F | First Heartland Consultants, Inc. | 5,053 | 4.53 | 839 | 128.96 | ||||
| 2025-08-01 | 13F | Boyd Watterson Asset Management Llc/oh | 3,235 | -94.68 | 246 | -94.70 | ||||
| 2025-08-11 | 13F | Principal Securities, Inc. | 2,425 | 26.76 | 184 | 28.67 | ||||
| 2025-08-11 | 13F | NewEdge Wealth, LLC | 187,172 | -40.62 | 14,214 | -40.60 | ||||
| 2025-08-04 | 13F | AMG National Trust Bank | 180,805 | -7.29 | 13,723 | -7.30 | ||||
| 2025-04-23 | 13F | Golden State Wealth Management, LLC | 311 | 1,627.78 | 24 | 2,200.00 | ||||
| 2025-08-13 | 13F | Capital Group Private Client Services, Inc. | 0 | -100.00 | 0 | |||||
| 2025-08-14 | 13F | MidWestOne Financial Group, Inc. | 219,590 | -26.27 | 16,667 | -26.29 | ||||
| 2025-07-22 | 13F | Visionary Horizons, LLC | 5,806 | -74.51 | 441 | -74.55 | ||||
| 2025-08-12 | 13F | DiMeo Schneider & Associates, L.L.C. | 468,948 | 4.20 | 35,593 | 4.19 | ||||
| 2025-07-30 | 13F | Denali Advisors Llc | 18,665 | -4.04 | 1,417 | -4.07 | ||||
| 2025-08-12 | 13F | Horizon Financial Services, Llc | 50,793 | -0.29 | 3,855 | -0.28 | ||||
| 2025-05-13 | 13F | Quadrature Capital Ltd | 0 | -100.00 | 0 | -100.00 | ||||
| 2025-05-15 | 13F/A | Orion Portfolio Solutions, LLC | 6,369 | 1.40 | 483 | 2.99 | ||||
| 2025-08-05 | 13F | Marion Wealth Management | 75,286 | 1.08 | 5,714 | 1.06 | ||||
| 2025-08-12 | 13F | SRS Capital Advisors, Inc. | 27,075 | -1.70 | 2,055 | -1.72 | ||||
| 2025-08-14 | 13F | Fmr Llc | 341 | -88.82 | 26 | -89.18 | ||||
| 2025-07-07 | 13F | Insight Wealth Strategies, LLC | 380,395 | 0.86 | 28,845 | 0.76 | ||||
| 2025-08-04 | 13F | Creative Financial Designs Inc /adv | 1,900 | 5.56 | 144 | 5.88 | ||||
| 2025-08-04 | 13F | Atria Investments Llc | 37,805 | 11.26 | 2,869 | 11.24 | ||||
| 2025-07-16 | 13F | Signaturefd, Llc | 148 | -27.80 | 11 | -26.67 | ||||
| 2025-07-25 | 13F | Transcendent Capital Group LLC | 33,521 | 0.16 | 2,544 | 0.16 | ||||
| 2025-07-24 | 13F | Us Bancorp \de\ | 47 | -84.64 | 4 | -86.96 | ||||
| 2025-08-12 | 13F | BlackRock, Inc. | 622,629 | 0.07 | 47,258 | 0.06 | ||||
| 2025-04-28 | 13F | Mainstream Capital Management LLC | 0 | -100.00 | 0 | |||||
| 2025-08-15 | 13F | Orcam Financial Group | 2,678 | 0.60 | 203 | 0.50 | ||||
| 2025-08-13 | 13F | Guggenheim Capital Llc | 121,048 | 37.91 | 9,188 | 37.90 | ||||
| 2025-08-13 | 13F | Everstar Asset Management, LLC | 3,790 | 0.00 | 288 | 0.00 | ||||
| 2025-08-12 | 13F | LPL Financial LLC | 649,206 | -18.07 | 49,275 | -18.08 | ||||
| 2025-07-22 | 13F | 4Thought Financial Group Inc. | 52,712 | 6.31 | 4,001 | 6.30 | ||||
| 2025-08-05 | 13F | Sigma Planning Corp | 5,482 | -77.66 | 416 | -77.66 | ||||
| 2025-07-14 | 13F | Abacus Wealth Partners, LLC | 6,529 | 496 | ||||||
| 2025-08-07 | 13F | Palouse Capital Management, Inc. | 49,803 | 0.34 | 3,780 | 0.35 | ||||
| 2025-08-14 | 13F | Hrt Financial Lp | 12,829 | 1 | ||||||
| 2025-07-14 | 13F | Argentarii, LLC | 2,696 | 205 | ||||||
| 2025-05-14 | 13F | Estate Counselors, LLC | 0 | -100.00 | 0 | |||||
| 2025-08-14 | 13F | Stifel Financial Corp | 35,398 | 8.41 | 2,687 | 8.39 | ||||
| 2025-08-14 | 13F/A | Skopos Labs, Inc. | 454 | 15,033.33 | 34 | |||||
| 2025-08-11 | 13F | Private Advisor Group, LLC | 7,742 | -7.50 | 588 | -7.56 | ||||
| 2025-07-24 | 13F | Robertson Stephens Wealth Management, LLC | 28,329 | 35.81 | 2,150 | 35.82 | ||||
| 2025-08-14 | 13F | Janus Henderson Group Plc | 3,415 | -92.12 | 259 | -92.09 | ||||
| 2025-07-08 | 13F | GK Wealth Management LLC | 9,456 | 68.23 | 718 | 68.31 | ||||
| 2025-08-14 | 13F | State Street Corp | 1,121,846 | 20.57 | 85,148 | 20.55 | ||||
| 2025-08-12 | 13F | Eisler Capital Management Ltd. | 0 | -100.00 | 0 | |||||
| 2025-08-11 | 13F | Regal Investment Advisors LLC | 72,982 | 0.50 | 5,539 | 0.49 | ||||
| 2025-08-14 | 13F | Harmony Asset Management Llc | 8,824 | 36.30 | 670 | 36.25 | ||||
| 2025-08-13 | 13F | Sumitomo Mitsui Financial Group, Inc. | 81,693 | -10.96 | 6,200 | -10.97 | ||||
| 2025-08-14 | 13F | Colony Group, LLC | 50,273 | -4.90 | 3,816 | -4.91 | ||||
| 2025-07-11 | 13F/A | Umb Bank N A/mo | 3,068 | 0.00 | 233 | 0.00 | ||||
| 2025-05-08 | 13F | BRYN MAWR TRUST Co | 0 | -100.00 | 0 | |||||
| 2025-08-14 | 13F | Mercer Global Advisors Inc /adv | 0 | -100.00 | 0 | |||||
| 2025-08-06 | 13F | Aspect Partners, LLC | 254 | 19 | ||||||
| 2025-08-12 | 13F | Mufg Securities Americas Inc. | 0 | -100.00 | 0 | |||||
| 2025-08-12 | 13F | Absolute Capital Management, LLC | 24,218 | -2.99 | 1,838 | -3.01 | ||||
| 2025-07-28 | 13F | Moran Wealth Management, LLC | 38,863 | 8.37 | 2,950 | 8.34 | ||||
| 2025-05-09 | 13F | Vanguard Group Inc | 0 | -100.00 | 0 | |||||
| 2025-08-05 | 13F | Huntington National Bank | 5 | |||||||
| 2025-08-13 | 13F | Wealthedge Investment Advisors, Llc | 0 | -100.00 | 0 | |||||
| 2025-08-05 | 13F | Transatlantique Private Wealth Llc | 8,300 | 2.77 | 630 | 2.61 | ||||
| 2025-08-07 | 13F | King Luther Capital Management Corp | 3,587 | -3.03 | ||||||
| 2025-05-08 | 13F | Plante Moran Financial Advisors, LLC | 0 | -100.00 | 0 | |||||
| 2025-08-14 | 13F | Bramshill Investments, LLC | 314,098 | 5.48 | 23,840 | 5.47 | ||||
| 2025-08-15 | 13F | Kestra Advisory Services, LLC | 7,147 | 165.19 | 542 | 165.69 | ||||
| 2025-05-12 | 13F | SOUTH STATE Corp | 0 | -100.00 | 0 | |||||
| 2025-08-14 | 13F | Alliancebernstein L.p. | 542,428 | 0.28 | 41,170 | 0.27 | ||||
| 2025-07-23 | 13F | Eagle Strategies LLC | 4,974 | 7.85 | 378 | 7.71 | ||||
| 2025-04-22 | 13F | Echo Wealth Management, LLC | 0 | -100.00 | 0 | |||||
| 2025-04-21 | 13F | Ronald Blue Trust, Inc. | 0 | -100.00 | 0 | |||||
| 2025-07-17 | 13F | Independence Bank of Kentucky | 2,742 | -7.80 | 208 | -7.56 | ||||
| 2025-08-13 | 13F | Nyl Investors Llc | 625,629 | 1.05 | 47,485 | 1.04 | ||||
| 2025-08-13 | 13F | Beacon Pointe Advisors, LLC | 4,317 | 4.25 | 328 | 4.14 | ||||
| 2025-08-13 | 13F | Fortress Financial Solutions, LLC | 16,546 | 3.24 | 1,256 | 3.21 | ||||
| 2025-08-08 | 13F | Fortis Group Advisors, LLC | 266 | 0.00 | 20 | 0.00 | ||||
| 2025-07-29 | 13F | Signature Estate & Investment Advisors Llc | 9,262 | 17.30 | 703 | 17.36 | ||||
| 2025-08-12 | 13F | Howe & Rusling Inc | 369 | 292.55 | 28 | 300.00 | ||||
| 2025-08-14 | 13F/A | Rockefeller Capital Management L.P. | 12,224 | 0.16 | 928 | 0.11 | ||||
| 2025-08-14 | 13F | GWM Advisors LLC | 186,473 | 54.11 | 14,153 | 54.09 | ||||
| 2025-07-30 | 13F | Phillips Financial Management, Llc | 86 | 7 | ||||||
| 2025-04-23 | 13F | Aspetuck Financial Management LLC | 0 | -100.00 | 0 | -100.00 | ||||
| 2025-05-05 | 13F | Transce3nd, LLC | 0 | -100.00 | 0 | |||||
| 2025-04-15 | 13F | Integrated Advisors Network LLC | 0 | -100.00 | 0 | |||||
| 2025-08-11 | 13F | Lighthouse Financial LLC | 130,698 | -0.42 | 9,920 | -0.44 | ||||
| 2025-08-14 | 13F | Wells Fargo & Company/mn | 1,591,904 | -4.67 | 120,826 | -4.68 | ||||
| 2025-08-07 | 13F | PFG Advisors | 8,242 | -9.02 | 626 | -9.02 | ||||
| 2025-08-11 | 13F | Heritage Wealth Advisors | 0 | -100.00 | 0 | |||||
| 2025-08-12 | 13F | Insigneo Advisory Services, Llc | 9,649 | 0.00 | 732 | 0.00 | ||||
| 2025-04-22 | 13F | Buck Wealth Strategies, LLC | 0 | -100.00 | 0 | |||||
| 2025-08-14 | 13F | TT Capital Management LLC | 54,100 | 4,001 | ||||||
| 2025-08-12 | 13F | Founders Financial Alliance, LLC | 0 | -100.00 | 0 | |||||
| 2025-07-30 | 13F | D.a. Davidson & Co. | 5,493 | 0.16 | 417 | 0.00 | ||||
| 2025-05-16 | 13F | CTC Alternative Strategies, Ltd. | 0 | -100.00 | 0 | |||||
| 2025-08-19 | 13F | Newbridge Financial Services Group, Inc. | 981 | 5.83 | 74 | 5.71 | ||||
| 2025-08-27 | NP | Brighthouse Funds Trust I - SSGA Growth and Income ETF Portfolio Class A | 779,375 | 20.55 | 59,155 | 20.53 | ||||
| 2025-07-31 | 13F | Pacitti Group Inc. | 23,844 | 8.98 | 1,810 | 8.98 | ||||
| 2025-07-31 | 13F | Ssa Swiss Advisors Ag | 0 | -100.00 | 0 | |||||
| 2025-07-17 | 13F | Catalytic Wealth RIA, LLC | 5,029 | 12.53 | 382 | 12.39 | ||||
| 2025-08-13 | 13F | Dai-Ichi Life Insurance Company, Ltd | 11,859 | -80.86 | 900 | -80.86 | ||||
| 2025-08-14 | 13F | Boston Private Wealth Llc | 0 | -100.00 | 0 | |||||
| 2025-08-14 | 13F | Wiley Bros.-aintree Capital, Llc | 55,046 | -13.15 | 4,178 | -12.81 | ||||
| 2025-07-18 | 13F | Consolidated Portfolio Review Corp | 10,681 | 1.24 | 811 | 1.25 | ||||
| 2025-08-12 | 13F | Charles Schwab Investment Management Inc | 2,274,819 | 2.62 | 172,659 | 2.61 | ||||
| 2025-08-12 | 13F | Change Path, LLC | 4,701 | -91.66 | 357 | -91.68 | ||||
| 2025-08-28 | NP | GPARX - GuidePath(R) Absolute Return Allocation Fund Service Shares | 59,081 | -60.09 | 4,484 | -60.10 | ||||
| 2025-07-30 | 13F | Berkeley Capital Partners, LLC | 202,842 | 3.58 | 15,396 | 3.57 | ||||
| 2025-04-17 | 13F | Vicus Capital | 0 | -100.00 | 0 | |||||
| 2025-08-07 | 13F | Resources Investment Advisors, LLC. | 4,077 | 28.98 | 309 | 29.29 | ||||
| 2025-07-31 | 13F | Wealthfront Advisers Llc | 17,876 | -13.73 | 1,357 | -13.74 | ||||
| 2025-08-12 | 13F | Tradition Wealth Management, LLC | 9,760 | -31.30 | 741 | -31.35 | ||||
| 2025-07-31 | 13F | United Community Bank | 117 | -81.63 | 9 | -83.33 | ||||
| 2025-08-18 | 13F | Geneos Wealth Management Inc. | 10,604 | 101.83 | 805 | 102.01 | ||||
| 2025-05-12 | 13F | Cahill Wealth Management, LLC | 3,200 | 0.00 | 243 | 1.26 | ||||
| 2025-07-16 | 13F | Marmo Financial Group, LLC | 127,911 | -0.22 | 9,708 | -0.24 | ||||
| 2025-07-17 | 13F | San Luis Wealth Advisors LLC | 169,348 | 13 | ||||||
| 2025-07-25 | 13F | Allspring Global Investments Holdings, LLC | 633,641 | 28.57 | 48,093 | 28.55 | ||||
| 2025-08-05 | 13F | GPS Wealth Strategies Group, LLC | 142 | 0.00 | 11 | 0.00 | ||||
| 2025-08-08 | 13F/A | Prospect Financial Services LLC | 119,970 | -34.64 | 9,106 | -34.65 | ||||
| 2025-08-08 | 13F | Foundations Investment Advisors, LLC | 2,846 | -21.12 | 216 | -20.88 | ||||
| 2025-08-14 | 13F | Royal Bank Of Canada | 595,360 | -20.36 | 45,187 | -20.38 | ||||
| 2025-07-11 | 13F | Compass Ion Advisors, LLC | 8,812 | 0.00 | 669 | 0.00 | ||||
| 2025-08-18 | 13F | Wolverine Trading, Llc | Put | 0 | -100.00 | 0 | ||||
| 2025-07-11 | 13F | Farther Finance Advisors, LLC | 1,070 | 618.12 | 81 | 636.36 | ||||
| 2025-08-27 | 13F/A | Brinker Capital Investments, LLC | 7,704 | 20.96 | 585 | 20.91 | ||||
| 2025-08-07 | 13F | Hennion & Walsh Asset Management, Inc. | 5,542 | 4.33 | 421 | 4.22 | ||||
| 2025-07-10 | 13F | Security National Bank | 150 | 0.00 | 11 | 0.00 | ||||
| 2025-07-15 | 13F | Revisor Wealth Management LLC | 119,517 | 21.58 | 8,981 | 20.34 | ||||
| 2025-08-04 | 13F | Wealth Management Associates, Inc. | 3,650 | -21.51 | 277 | -21.31 | ||||
| 2025-08-14 | 13F | Bank Of Hawaii | 84,162 | 4.91 | 6,388 | 4.89 | ||||
| 2025-07-25 | 13F | Prostatis Group LLC | 3,882 | -73.21 | 295 | -73.25 | ||||
| 2025-08-13 | 13F | Northwestern Mutual Wealth Management Co | 23,951 | -70.27 | 1,818 | -70.29 | ||||
| 2025-08-12 | 13F | O'shaughnessy Asset Management, Llc | 1,313 | 23.63 | 100 | 23.75 | ||||
| 2025-08-11 | 13F | Citigroup Inc | 1,356,114 | 4,898.02 | 102,929 | 4,898.98 | ||||
| 2025-07-10 | 13F | Rockland Trust Co | 9,903 | 0.45 | 752 | 0.40 | ||||
| 2025-08-11 | 13F | Angeles Investment Advisors, LLC | 1,606,000 | 0.00 | 121,895 | -0.01 | ||||
| 2025-08-13 | 13F | Farnam Financial LLC | 3,856 | 2.39 | 293 | 2.46 | ||||
| 2025-07-22 | 13F | Simplicity Wealth,LLC | 33,720 | 2,559 | ||||||
| 2025-04-25 | 13F | Tradewinds Capital Management, LLC | 0 | -100.00 | 0 | -100.00 | ||||
| 2025-05-08 | 13F | Harbour Investments, Inc. | 0 | -100.00 | 0 | |||||
| 2025-08-13 | 13F | Manning & Napier Advisors Llc | 15,853 | 48.62 | 1,203 | 48.70 | ||||
| 2025-08-11 | 13F | Banque Cantonale Vaudoise | 1,568 | 0.00 | 0 | |||||
| 2025-08-12 | 13F | Steward Partners Investment Advisory, Llc | 4,608 | -13.29 | 350 | -13.40 | ||||
| 2025-08-13 | 13F | Alerus Financial Na | 409,515 | 0.96 | 31,082 | 0.95 | ||||
| 2025-08-01 | 13F | James Investment Research Inc | 20,652 | -2.42 | 1,567 | -2.43 | ||||
| 2025-08-14 | 13F | Headlands Technologies LLC | 2,866 | 218 | ||||||
| 2025-08-14 | 13F | Heritage Wealth Management, Inc. | 4,845 | -23.84 | 368 | -23.86 | ||||
| 2025-08-11 | 13F | HighTower Advisors, LLC | 37,506 | 8.07 | 2,847 | 8.05 | ||||
| 2025-07-30 | 13F | Caliber Wealth Management, LLC / KS | 5,281 | 0.94 | 401 | 0.76 | ||||
| 2025-08-15 | 13F/A | Rakuten Securities, Inc. | 295 | 150.00 | 22 | 175.00 | ||||
| 2025-07-29 | 13F | Woodard & Co Asset Management Group Inc /adv | 86 | 0.00 | 7 | 0.00 | ||||
| 2025-08-12 | 13F | Bokf, Na | 0 | -100.00 | 0 | |||||
| 2025-08-14 | 13F | McIlrath & Eck, LLC | 51 | 0.00 | 4 | 0.00 | ||||
| 2025-08-12 | 13F | GDS Wealth Management | 567,222 | -8.01 | 43,052 | -8.02 | ||||
| 2025-08-14 | 13F | Financial Engines Advisors L.L.C. | 3,212 | 244 | ||||||
| 2025-07-24 | 13F | Galvin, Gaustad & Stein, LLC | 10,041 | -9.82 | 762 | -9.82 | ||||
| 2025-08-11 | 13F | Y.D. More Investments Ltd | 150 | 0.00 | 11 | 0.00 | ||||
| 2025-08-01 | 13F | Providence First Trust Co | 146,640 | -0.24 | 11,130 | -0.26 | ||||
| 2025-07-07 | 13F | Wesbanco Bank Inc | 40,017 | 4.11 | 3,037 | 4.11 | ||||
| 2025-07-10 | 13F | Wealth Enhancement Advisory Services, Llc | 10,455 | -31.20 | 788 | -31.66 | ||||
| 2025-07-02 | 13F | S. R. Schill & Associates | 17,387 | 1,320 | ||||||
| 2025-08-14 | 13F | Tudor Investment Corp Et Al | 0 | -100.00 | 0 | |||||
| 2025-07-14 | 13F | GAMMA Investing LLC | 0 | -100.00 | 0 | |||||
| 2025-07-17 | 13F | LifeGoal Wealth Advisors | 19,078 | 19.30 | 1,448 | 19.37 | ||||
| 2025-08-12 | 13F | Barings Llc | 35,856 | 0.00 | 2,721 | 0.00 | ||||
| 2025-08-27 | NP | FFSAX - Touchstone Flexible Income Fund Class A | 46,791 | 2.68 | 3,551 | 2.66 | ||||
| 2025-07-25 | 13F | Cwm, Llc | 960 | 1,115.19 | 0 | |||||
| 2025-08-01 | 13F | Envestnet Asset Management Inc | 336,965 | -13.15 | 25,570 | -13.19 | ||||
| 2025-08-13 | 13F | Johnson Financial Group, Inc. | 0 | -100.00 | 0 | |||||
| 2025-08-18 | 13F | Wolverine Trading, Llc | Call | 0 | -100.00 | 0 | ||||
| 2025-08-15 | 13F | Tower Research Capital LLC (TRC) | 20 | -57.45 | 2 | -66.67 | ||||
| 2025-08-08 | 13F | Francis Financial, Inc. | 0 | -100.00 | 0 | |||||
| 2025-08-04 | 13F | Assetmark, Inc | 59,120 | -60.22 | 4,487 | -60.23 | ||||
| 2025-08-15 | 13F | Captrust Financial Advisors | 14,474 | 218.67 | 1,099 | 219.19 | ||||
| 2025-07-18 | 13F | Union Bancaire Privee, UBP SA | 0 | -100.00 | 0 | |||||
| 2025-08-08 | 13F | SBI Securities Co., Ltd. | 35,005 | 6.19 | 2,657 | 6.16 | ||||
| 2025-08-06 | 13F | Commonwealth Equity Services, Llc | 77,217 | -3.06 | 6 | -16.67 | ||||
| 2025-07-07 | 13F | Thurston, Springer, Miller, Herd & Titak, Inc. | 103 | 0.00 | 8 | 0.00 | ||||
| 2025-08-06 | 13F | Prospera Financial Services Inc | 37,662 | -50.15 | 2,859 | -50.15 | ||||
| 2025-08-27 | NP | Brighthouse Funds Trust I - SSGA Growth ETF Portfolio Class A | 342,471 | 20.62 | 25,994 | 20.61 | ||||
| 2025-07-14 | 13F | Mechanics Bank Trust Department | 25,660 | 51.79 | 1,948 | 51.75 | ||||
| 2025-07-23 | 13F | Sax Wealth Advisors, Llc | 9,531 | 129.66 | 723 | 129.52 | ||||
| 2025-08-05 | 13F | Scarborough Advisors, LLC | 1,593 | 121 | ||||||
| 2025-04-25 | 13F | New Perspectives, Inc | 0 | -100.00 | 0 | |||||
| 2025-08-14 | 13F | Benjamin Edwards Inc | 436,328 | 35.30 | 33,117 | 35.28 | ||||
| 2025-07-10 | 13F | Redhawk Wealth Advisors, Inc. | 18,520 | 1,406 | ||||||
| 2025-07-10 | 13F | High Net Worth Advisory Group LLC | 11,414 | -16.61 | 866 | -16.65 | ||||
| 2025-08-13 | 13F | Cary Street Partner Investment Advisory Llc | 0 | -100.00 | 0 | |||||
| 2025-05-15 | 13F | Gwn Securities Inc. | 0 | -100.00 | 0 | |||||
| 2025-08-07 | 13F | Varma Mutual Pension Insurance Co | 1,600,000 | 0.00 | 121,440 | -0.01 | ||||
| 2025-06-27 | NP | Calamos ETF Trust - Calamos Alternative Nasdaq & Bond ETF | 1,204 | 75.00 | 90 | 74.51 | ||||
| 2025-08-07 | 13F | Davidson Capital Management Inc. | 292,881 | 22.06 | 22,230 | 22.04 | ||||
| 2025-08-07 | 13F | CENTRAL TRUST Co | 112 | 86.67 | 9 | 100.00 | ||||
| 2025-07-17 | 13F | Refined Wealth Management | 65,669 | 0.04 | 4,984 | 0.02 | ||||
| 2025-05-15 | 13F | Rakuten Investment Management, Inc. | 86,525 | 25.70 | 6,542 | 16.65 | ||||
| 2025-08-14 | 13F | Snowden Capital Advisors LLC | 31,674 | -1.14 | 2,404 | -1.15 | ||||
| 2025-08-12 | 13F | Proequities, Inc. | 0 | 0 | ||||||
| 2025-08-14 | 13F | Great Valley Advisor Group, Inc. | 5,806 | -73.46 | 440 | -73.49 | ||||
| 2025-05-13 | 13F | Resona Asset Management Co.,Ltd. | 0 | -100.00 | 0 | |||||
| 2025-08-18 | 13F | Castleark Management Llc | 236,450 | 17,947 | ||||||
| 2025-07-25 | 13F | Atria Wealth Solutions, Inc. | 11,817 | -32.79 | 895 | -32.98 | ||||
| 2025-08-13 | 13F | Cary Street Partners Financial Llc | 3,643 | -15.73 | 277 | -15.85 | ||||
| 2025-07-18 | 13F | Northeast Financial Group, Inc. | 139,065 | 11.01 | 10,555 | 11.00 | ||||
| 2025-07-24 | 13F | Conning Inc. | 11,380 | 0.00 | 864 | 0.00 | ||||
| 2025-08-11 | 13F | WPG Advisers, LLC | 206 | 121.51 | 16 | 114.29 | ||||
| 2025-08-14 | 13F | Dearborn Partners Llc | 23,968 | 77.70 | 1,819 | 77.81 | ||||
| 2025-07-29 | 13F | Quotient Wealth Partners, LLC | 0 | -100.00 | 0 | |||||
| 2025-08-12 | 13F | Global Retirement Partners, LLC | 16,817 | 107.18 | 1,276 | 110.56 | ||||
| 2025-08-12 | 13F | Running Point Capital Advisors, LLC | 736 | 0.00 | 56 | 0.00 | ||||
| 2025-08-14 | 13F | Bank Of America Corp /de/ | 2,389,158 | 0.46 | 181,337 | 0.45 | ||||
| 2025-08-05 | 13F | Bank of New York Mellon Corp | 49,808 | 155.15 | 3,780 | 155.23 | ||||
| 2025-07-24 | 13F | Stonebridge Financial Group, LLC | 8,557 | 17.06 | 649 | 17.15 | ||||
| 2025-07-24 | 13F | Aurora Private Wealth, Inc. | 2,798 | 1.45 | 0 | |||||
| 2025-07-28 | 13F | Courier Capital Llc | 32,148 | 5.96 | 2,440 | 5.95 | ||||
| 2025-09-04 | 13F/A | Advisor Group Holdings, Inc. | 268,855 | 20.56 | 20,418 | 20.59 | ||||
| 2025-04-25 | 13F | Wall Street Financial Group, Inc. | 17,123 | -10.52 | 1,300 | -9.16 | ||||
| 2025-08-13 | 13F | Victory Financial Group, Llc | 57,998 | -4.79 | 4,402 | -4.05 | ||||
| 2025-07-30 | 13F | Brookstone Capital Management | 3,708 | 7.42 | 281 | 7.25 | ||||
| 2025-08-06 | 13F | First Horizon Advisors, Inc. | 2,838 | 0.00 | 215 | 0.00 | ||||
| 2025-08-13 | 13F | Flow Traders U.s. Llc | 0 | -100.00 | 0 | |||||
| 2025-05-12 | 13F | Richard W. Paul & Associates, LLC | 0 | -100.00 | 0 | |||||
| 2025-08-01 | 13F | Advisory Alpha, LLC | 503,551 | -1.39 | 38,220 | -1.25 | ||||
| 2025-08-14 | 13F | Susquehanna International Group, Llp | Call | 115,800 | 14.31 | 8,789 | 14.31 | |||
| 2025-08-14 | 13F | Susquehanna International Group, Llp | Put | 82,200 | 108.10 | 6,239 | 108.07 | |||
| 2025-04-10 | 13F | Smith Anglin Financial, LLC | 0 | -100.00 | 0 | |||||
| 2025-08-29 | 13F | Evolution Wealth Management Inc. | 99 | 8 | ||||||
| 2025-08-12 | 13F | Ameritas Investment Partners, Inc. | 780 | 1.17 | 59 | 1.72 | ||||
| 2025-08-28 | NP | Northern Lights Fund Trust - Sierra Tactical Risk Spectrum 50 Fund Investor Class | 0 | -100.00 | 0 | -100.00 | ||||
| 2025-08-28 | NP | SIRAX - Sierra Tactical All Asset Fund Class A | 0 | -100.00 | 0 | -100.00 | ||||
| 2025-08-14 | 13F | Susquehanna International Group, Llp | 131,038 | -37.64 | 9,946 | -37.65 | ||||
| 2025-08-13 | 13F | Safe Harbor Fiduciary, LLC | 0 | -100.00 | 0 | |||||
| 2025-08-05 | 13F | Mma Asset Management Llc | 28,615 | -55.89 | 2,172 | -55.91 | ||||
| 2025-04-30 | 13F | POM Investment Strategies, LLC | 0 | -100.00 | 0 | |||||
| 2025-08-12 | 13F | Prudential Financial Inc | 10,865 | 832 | ||||||
| 2025-07-14 | 13F | Signature Securities Group Corporation | 0 | -100.00 | 0 | |||||
| 2025-08-08 | 13F | Cetera Investment Advisers | 154,519 | -41.45 | 11,728 | -41.46 | ||||
| 2025-08-08 | 13F | Capital Investment Advisory Services, LLC | 800 | 0.00 | 61 | 0.00 | ||||
| 2025-07-29 | 13F | Elevation Capital Advisory, LLC | 0 | -100.00 | 0 | -100.00 | ||||
| 2025-08-15 | 13F | State of Tennessee, Treasury Department | 2,827,927 | 3.94 | 214,640 | 3.93 | ||||
| 2025-08-15 | 13F | Provenance Wealth Advisors, LLC | 0 | -100.00 | 0 | |||||
| 2025-07-25 | 13F | Community Bank, N.A. | 0 | -100.00 | 0 | |||||
| 2025-04-14 | 13F | RWM Asset Management, LLC | 0 | -100.00 | 0 | |||||
| 2025-07-15 | 13F | LeConte Wealth Management, LLC | 75,996 | -9.14 | 5,768 | -9.15 | ||||
| 2025-07-28 | 13F | Mutual Advisors, LLC | 7,384 | 125.74 | 555 | 127.46 | ||||
| 2025-08-11 | 13F | Nations Financial Group Inc, /ia/ /adv | 41,751 | 8.57 | 3,169 | 8.53 | ||||
| 2025-08-08 | 13F | Gts Securities Llc | 0 | -100.00 | 0 | |||||
| 2025-07-14 | 13F | Painted Porch Advisors LLC | 0 | -100.00 | 0 | |||||
| 2025-07-17 | 13F | Beacon Capital Management, LLC | 847 | 1.56 | 64 | 1.59 | ||||
| 2025-08-26 | NP | TFPN - Blueprint Chesapeake Multi-Asset Trend ETF | 1,565 | 0.00 | 119 | 0.00 | ||||
| 2025-07-14 | 13F | Golden State Equity Partners | 10,103 | -5.45 | 767 | -5.55 | ||||
| 2025-08-14 | 13F | Comerica Bank | 50,096 | -8.63 | 3,802 | -8.63 | ||||
| 2025-07-21 | 13F | Ameritas Advisory Services, LLC | 2,798 | 2.23 | 212 | 3.92 | ||||
| 2025-08-14 | 13F | Toronto Dominion Bank | 200,000 | 15,180 | ||||||
| 2025-08-14 | 13F | Navigoe, LLC | 17 | 0 | ||||||
| 2025-07-01 | 13F | GP Brinson Investments LLC | 13,210 | 0.00 | 1,003 | 0.00 | ||||
| 2025-07-07 | 13F | Investors Research Corp | 843 | 0.00 | 64 | 0.00 | ||||
| 2025-07-31 | 13F | Hobart Private Capital, LLC | 5,695 | -79.30 | 432 | -79.31 | ||||
| 2025-04-28 | 13F | Financial Advocates Investment Management | 0 | -100.00 | 0 | |||||
| 2025-04-30 | 13F | Stratos Wealth Advisors, LLC | 0 | -100.00 | 0 | -100.00 | ||||
| 2025-08-08 | 13F | Diana Davis Spencer Foundation | 461,000 | 0.00 | 34,990 | -0.01 | ||||
| 2025-04-08 | 13F | Rooted Wealth Advisors, Inc. | 0 | -100.00 | 0 | |||||
| 2025-08-11 | 13F | TD Waterhouse Canada Inc. | 9,794 | -30.49 | 741 | -30.49 | ||||
| 2025-08-12 | 13F | PSI Advisors, LLC | 0 | -100.00 | 0 | |||||
| 2025-08-14 | 13F | Qube Research & Technologies Ltd | 0 | -100.00 | 0 | |||||
| 2025-07-24 | 13F | Antonelli Financial Advisors, LLC | 72,943 | 15.01 | 5,536 | 15.00 | ||||
| 2025-08-14 | 13F | Sei Investments Co | 146,574 | 664.60 | 11,125 | 664.60 | ||||
| 2025-07-14 | 13F | Financial Advisory Partners, Llc | 84,605 | 7.80 | 6,422 | 7.79 | ||||
| 2025-07-23 | 13F | Narwhal Capital Management | 0 | -100.00 | 0 | |||||
| 2025-08-12 | 13F | Jpmorgan Chase & Co | 219,122 | -37.34 | 16,631 | -37.35 | ||||
| 2025-08-13 | 13F/A | StoneX Group Inc. | 2,965 | 217 | ||||||
| 2025-05-13 | 13F | Brooklyn FI, LLC | 0 | -100.00 | 0 | -100.00 | ||||
| 2025-08-13 | 13F | GeoWealth Management, LLC | 5,036 | 12.51 | 382 | 12.68 | ||||
| 2025-08-04 | 13F | Lockheed Martin Investment Management Co | 0 | -100.00 | 0 | |||||
| 2025-07-24 | 13F | IFP Advisors, Inc | 0 | -100.00 | 0 | |||||
| 2025-08-07 | 13F | LFA - Lugano Financial Advisors SA | 7,266 | -4.07 | 546 | -5.05 | ||||
| 2025-07-17 | 13F | Fifth Third Securities, Inc. | 2,734 | 208 | ||||||
| 2025-05-15 | 13F | DSC Meridian Capital LP | 0 | -100.00 | 0 | |||||
| 2025-07-30 | NP | WTBN - WisdomTree Bianco Total Return Fund | 8,502 | -84.23 | 630 | -84.91 | ||||
| 2025-07-18 | 13F | Truist Financial Corp | 186,379 | -37.45 | 14,146 | -37.46 | ||||
| 2025-08-06 | 13F | Legacy Wealth Managment, LLC/ID | 23 | 0.00 | 2 | 0.00 | ||||
| 2025-08-12 | 13F | Franklin Resources Inc | 3,101 | 0.00 | 235 | 0.00 | ||||
| 2025-07-23 | 13F | Friedenthal Financial | 304 | 0.00 | 23 | 0.00 | ||||
| 2025-07-31 | 13F | Cambridge Investment Research Advisors, Inc. | 112,500 | 5.17 | 9 | 0.00 | ||||
| 2025-08-14 | 13F | SWAN Capital LLC | 245,377 | -5.91 | 18,624 | -5.92 | ||||
| 2025-07-07 | 13F | Bangor Savings Bank | 9,190 | 0.00 | 698 | 0.00 | ||||
| 2025-08-07 | 13F | Commerce Bank | 10,970 | 39.66 | 833 | 39.60 | ||||
| 2025-05-14 | 13F | Idaho Trust Bank | 0 | -100.00 | 0 | |||||
| 2025-07-17 | 13F | Nelson, Van Denburg & Campbell Wealth Management Group, LLC | 5,909 | 0.00 | 448 | 0.00 | ||||
| 2025-07-24 | 13F | Blair William & Co/il | 894 | 36.28 | 68 | 36.73 | ||||
| 2025-08-11 | 13F | United Capital Financial Advisers, Llc | 7,590 | 1.85 | 576 | 1.95 | ||||
| 2025-08-12 | 13F | Prudential Plc | 40,444,804 | -52.22 | 3,069,761 | -52.22 | ||||
| 2025-07-14 | 13F | Ridgewood Investments LLC | 200 | 0.00 | 15 | 0.00 | ||||
| 2025-08-14 | 13F | UBS Group AG | 649,790 | 2.13 | 49,319 | 2.12 | ||||
| 2025-08-05 | 13F | Palogic Value Management, L.P. | 34,565 | -3.20 | 2,620 | -3.25 | ||||
| 2025-08-06 | 13F | Summit Wealth Group, LLC | 3,186 | 0.00 | 0 | |||||
| 2025-08-29 | NP | BRMSX - Bramshill Income Performance Fund Institutional Class | 41,519 | 0.00 | 3,151 | 0.00 | ||||
| 2025-07-22 | 13F | Merit Financial Group, LLC | 6,710 | 509 | ||||||
| 2025-08-18 | 13F/A | National Bank Of Canada /fi/ | 342 | -7.82 | 26 | -10.71 | ||||
| 2025-07-14 | 13F | Sellwood Investment Partners LLC | 91,606 | 6.84 | 6,953 | 6.82 |