Mga Batayang Estadistika
| Pemilik Institusional | 157 total, 152 long only, 0 short only, 5 long/short - change of -5.42% MRQ |
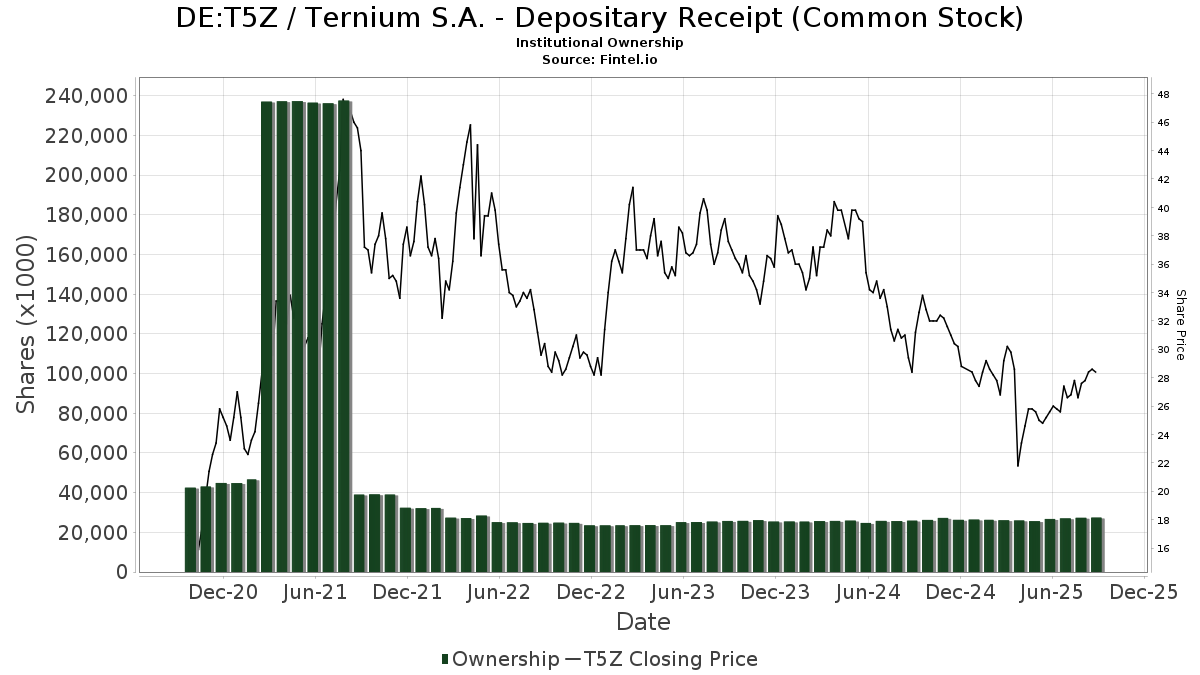
| Harga Saham | 28.80 |
| Alokasi Portofolio Rata-rata | 0.3250 % - change of 1.24% MRQ |
| Saham Institusional (Jangka Panjang) | 27,418,114 (ex 13D/G) - change of 0.69MM shares 2.57% MRQ |
| Nilai Institusional (Jangka Panjang) | $ 628,276 USD ($1000) |
Kepemilikan Institusional dan Pemegang Saham
Ternium S.A. - Depositary Receipt (Common Stock) (DE:T5Z) memiliki 157 pemilik institusional dan pemegang saham yang telah mengajukan formulir 13D/G atau 13F kepada Komisi Bursa Efek (Securities Exchange Commission/SEC). Lembaga-lembaga ini memegang total 27,418,114 saham. Pemegang saham terbesar meliputi Lazard Asset Management Llc, Donald Smith & Co., Inc., Ninety One UK Ltd, Schroder Investment Management Group, VASVX - Vanguard Selected Value Fund Investor Shares, Ninety One North America, Inc., Acadian Asset Management Llc, Contrarian Capital Management, L.l.c., LZOEX - Lazard Emerging Markets Equity Portfolio Open Shares, and Oaktree Capital Management Lp .
Struktur kepemilikan institusional Ternium S.A. - Depositary Receipt (Common Stock) (DB:T5Z) menunjukkan posisi terkini di perusahaan oleh institusi dan dana, serta perubahan terbaru dalam ukuran posisi. Pemegang saham utama dapat mencakup investor individu, reksa dana, dana lindung nilai, atau institusi. Jadwal 13D menunjukkan bahwa investor memegang (atau pernah memegang) lebih dari 5% saham perusahaan dan bermaksud (atau pernah bermaksud) untuk secara aktif mengejar perubahan strategi bisnis. Jadwal 13G menunjukkan investasi pasif lebih dari 5%.
The share price as of September 4, 2025 is 28.80 / share. Previously, on September 6, 2024, the share price was 29.20 / share. This represents a decline of 1.37% over that period.
Skor Sentimen Dana
Skor Sentimen Dana (sebelumnya dikenal sebagai Skor Akumulasi Kepemilikan) menemukan saham-saham yang paling banyak dibeli oleh dana. Ini adalah hasil dari model kuantitatif multi-faktor yang canggih yang mengidentifikasi perusahaan dengan tingkat akumulasi institusional tertinggi. Model penilaian menggunakan kombinasi dari total peningkatan pemilik yang diungkapkan, perubahan dalam alokasi portofolio pada pemilik tersebut, dan metrik lainnya. Angka berkisar dari 0 hingga 100, dengan angka yang lebih tinggi menunjukkan tingkat akumulasi yang lebih tinggi dibandingkan dengan perusahaan sejenisnya, dan 50 adalah rata-ratanya.
Frekuensi Pembaruan: Setiap Hari
Lihat Ownership Explorer, yang menyediakan daftar perusahaan dengan peringkat tertinggi.
Pengajuan 13F dan NPORT
Detail pada pengajuan 13F tersedia gratis. Detail pada pengajuan NP memerlukan keanggotaan premium. Baris berwarna hijau menunjukkan posisi baru. Baris berwarna merah menunjukkan posisi yang sudah ditutup. Klik tautan ini ikon untuk melihat riwayat transaksi selengkapnya.
Tingkatkan
untuk membuka data premium dan mengekspor ke Excel ![]() .
.
| Tanggal File | Sumber | Investor | Ketik | Presyo ng Avg (Silangan) |
Saham | Δ Saham (%) |
Dilaporkan Nilai ($1000) |
Nilai Δ (%) |
Alokasi Port (%) |
|
|---|---|---|---|---|---|---|---|---|---|---|
| 2025-07-21 | 13F | Qrg Capital Management, Inc. | 0 | -100.00 | 0 | |||||
| 2025-07-31 | 13F | State of New Jersey Common Pension Fund D | 92,528 | 0.00 | 2,785 | -3.40 | ||||
| 2025-07-30 | NP | IPAV - Global X Infrastructure Development ex-U.S. ETF | 259 | 62.89 | 7 | 75.00 | ||||
| 2025-03-27 | NP | HERIX - Hartford Emerging Markets Equity Fund Class I | 14,841 | 0.00 | 445 | -12.06 | ||||
| 2025-07-24 | 13F | Ronald Blue Trust, Inc. | 1,912 | -10.74 | 58 | -13.64 | ||||
| 2025-08-14 | 13F | Deprince Race & Zollo Inc | 139,739 | 4,206 | ||||||
| 2025-08-05 | 13F | Key FInancial Inc | 600 | 0.00 | 18 | 0.00 | ||||
| 2025-08-13 | 13F | Northern Trust Corp | 0 | -100.00 | 0 | |||||
| 2025-08-11 | 13F | Bell Investment Advisors, Inc | 52 | -53.57 | 2 | -66.67 | ||||
| 2025-08-12 | 13F | Edmond De Rothschild Holding S.a. | 900 | 0.00 | 27 | -3.57 | ||||
| 2025-05-15 | 13F | Woodline Partners LP | 0 | -100.00 | 0 | |||||
| 2025-08-19 | 13F | State of Wyoming | 3,954 | 119 | ||||||
| 2025-07-30 | NP | AUERX - Auer Growth Fund | 18,000 | 0.00 | 493 | -5.38 | ||||
| 2025-08-04 | 13F | Hantz Financial Services, Inc. | 6,998 | 1,360.96 | 0 | |||||
| 2025-08-14 | 13F | Two Sigma Advisers, Lp | 0 | -100.00 | 0 | |||||
| 2025-06-18 | NP | RMYAX - Multi-Strategy Income Fund Class A | 1,540 | 0.00 | 44 | -4.35 | ||||
| 2025-08-25 | NP | PRINCIPAL VARIABLE CONTRACTS FUNDS INC - International Emerging Markets Account Class 1 | 2,835 | 35.65 | 85 | 30.77 | ||||
| 2025-08-14 | 13F | Vident Advisory, LLC | 13,899 | 13.22 | 418 | 9.42 | ||||
| 2025-08-14 | 13F | Canada Pension Plan Investment Board | 120,249 | 0.00 | 3,619 | -3.39 | ||||
| 2025-05-09 | 13F | Commonwealth Equity Services, Llc | 0 | -100.00 | 0 | |||||
| 2025-08-06 | 13F | Savant Capital, LLC | 0 | -100.00 | 0 | |||||
| 2025-08-08 | 13F | Geode Capital Management, Llc | 0 | -100.00 | 0 | |||||
| 2025-05-12 | 13F | FIL Ltd | 0 | -100.00 | 0 | -100.00 | ||||
| 2025-06-18 | NP | REMSX - Emerging Markets Fund Class S | 24,795 | 0.00 | 716 | -3.77 | ||||
| 2025-08-14 | 13F | Citadel Advisors Llc | Call | 30,800 | 124.82 | 927 | 117.61 | |||
| 2025-08-13 | 13F | Towle & Co | 24,794 | 4.69 | 746 | 1.22 | ||||
| 2025-08-13 | 13F | Northwestern Mutual Wealth Management Co | 393 | 12 | ||||||
| 2025-03-31 | NP | FZILX - Fidelity ZERO International Index Fund This fund is a listed as child fund of Fmr Llc and if that institution has disclosed ownership in this security, then these positions will not be double counted when calculating total shares and total value | 6,978 | 0.00 | 209 | -12.18 | ||||
| 2025-06-23 | NP | PEAPX - International Emerging Markets Fund R-3 | 83,046 | 0.00 | 2,397 | -3.81 | ||||
| 2025-08-07 | 13F | Dalton Investments LLC | 23,584 | 0.00 | 710 | -3.41 | ||||
| 2025-07-07 | 13F | Thurston, Springer, Miller, Herd & Titak, Inc. | 118 | 0.00 | 4 | 0.00 | ||||
| 2025-08-07 | 13F | Campbell & CO Investment Adviser LLC | 9,515 | -50.25 | 286 | -51.93 | ||||
| 2025-08-12 | 13F | Cornerstone Select Advisors, LLC | 0 | -100.00 | 0 | |||||
| 2025-08-08 | 13F | Cetera Investment Advisers | 9,358 | -3.24 | 282 | -6.64 | ||||
| 2025-08-08 | 13F | SBI Securities Co., Ltd. | 3,567 | 8.35 | 107 | 4.90 | ||||
| 2025-07-08 | 13F | Northwest & Ethical Investments L.P. | 0 | -100.00 | 0 | -100.00 | ||||
| 2025-07-31 | 13F | MQS Management LLC | 0 | -100.00 | 0 | |||||
| 2025-08-27 | 13F/A | Squarepoint Ops LLC | 0 | -100.00 | 0 | -100.00 | ||||
| 2025-07-18 | 13F | Robeco Institutional Asset Management B.V. | 403,293 | 5.22 | 12,139 | 1.64 | ||||
| 2025-07-28 | NP | IUS - Invesco RAFI(TM) Strategic US ETF This fund is a listed as child fund of Invesco Ltd. and if that institution has disclosed ownership in this security, then these positions will not be double counted when calculating total shares and total value | 14,053 | 0.60 | 385 | -4.71 | ||||
| 2025-08-13 | 13F | WealthTrust Axiom LLC | 22,350 | -5.50 | 673 | -8.70 | ||||
| 2025-03-31 | NP | APITX - Yorktown Growth Fund Class L Shares | 8,275 | 0.00 | 248 | -12.06 | ||||
| 2025-08-12 | 13F | XTX Topco Ltd | 0 | -100.00 | 0 | |||||
| 2025-08-13 | 13F | Russell Investments Group, Ltd. | 576,869 | -14.34 | 17,455 | -16.78 | ||||
| 2025-08-14 | 13F | Aquatic Capital Management LLC | 29,675 | 246.55 | 893 | 235.71 | ||||
| 2025-05-15 | 13F | PointState Capital LP | 0 | -100.00 | 0 | |||||
| 2025-08-12 | 13F | Legal & General Group Plc | 475 | 0.00 | 14 | 0.00 | ||||
| 2025-08-12 | 13F | BlackRock, Inc. | 502,446 | 5.36 | 15,124 | 1.78 | ||||
| 2025-08-13 | 13F | Natixis | 227 | 0.00 | 7 | -14.29 | ||||
| 2025-03-20 | NP | GSEQX - Goldman Sachs Multi-Manager Global Equity Fund Class R6 Shares | 2,982 | 0.00 | 89 | -11.88 | ||||
| 2025-08-11 | 13F | Empirical Finance, LLC | 61,431 | 1,849 | ||||||
| 2025-08-11 | 13F | Cape Ann Asset Management Ltd | 897,049 | -0.69 | 27,001 | -4.06 | ||||
| 2025-04-24 | 13F | Allspring Global Investments Holdings, LLC | 0 | -100.00 | 0 | -100.00 | ||||
| 2025-08-06 | 13F | Oldfield Partners LLP | 138,602 | -21.26 | 4,172 | -23.96 | ||||
| 2025-08-13 | 13F | Oaktree Capital Management Lp | 919,709 | 13.18 | 27,683 | 9.33 | ||||
| 2025-08-27 | NP | SMCF - Themes US Small Cap Cash Flow Champions ETF | 643 | -11.19 | 19 | -13.64 | ||||
| 2025-07-30 | NP | FSAMX - Strategic Advisers Emerging Markets Fund This fund is a listed as child fund of Fmr Llc and if that institution has disclosed ownership in this security, then these positions will not be double counted when calculating total shares and total value | 50,330 | -21.69 | 1,378 | -25.75 | ||||
| 2025-08-14 | 13F | UBS Group AG | 50,618 | 152.18 | 1,524 | 143.68 | ||||
| 2025-08-14 | 13F | Citadel Advisors Llc | Put | 0 | -100.00 | 0 | ||||
| 2025-09-04 | 13F/A | Advisor Group Holdings, Inc. | 3,988 | -4.04 | 120 | -6.98 | ||||
| 2025-08-12 | 13F | LPL Financial LLC | 21,073 | -27.86 | 634 | -30.33 | ||||
| 2025-05-15 | 13F | D. E. Shaw & Co., Inc. | Put | 0 | -100.00 | 0 | -100.00 | |||
| 2025-05-15 | 13F | D. E. Shaw & Co., Inc. | Call | 0 | -100.00 | 0 | -100.00 | |||
| 2025-07-24 | 13F | Standard Life Aberdeen plc | 8,570 | 258 | ||||||
| 2025-07-18 | 13F | Ninety One North America, Inc. | 1,023,049 | 23.43 | 30,794 | 19.23 | ||||
| 2025-08-12 | 13F | Coldstream Capital Management Inc | 0 | -100.00 | 0 | |||||
| 2025-08-18 | 13F/A | National Bank Of Canada /fi/ | 4 | 0.00 | 0 | |||||
| 2025-08-14 | 13F | Van Eck Associates Corp | 105,266 | -1.13 | 3 | 0.00 | ||||
| 2025-08-04 | 13F | Yorktown Management & Research Co Inc | 0 | -100.00 | 0 | |||||
| 2025-07-18 | 13F | Ninety One UK Ltd | 2,407,110 | 5.18 | 72,454 | 1.60 | ||||
| 2025-08-13 | 13F | Donald Smith & Co., Inc. | 3,412,385 | 10.08 | 102,713 | 6.34 | ||||
| 2025-06-26 | NP | HFSSX - Hartford Schroders International Contrarian Value Fund Class SDR | 50,949 | 50.31 | 1,470 | 44.69 | ||||
| 2025-08-13 | 13F/A | StoneX Group Inc. | 5,039 | -0.87 | 230 | 4.07 | ||||
| 2025-08-14 | 13F | MIRAE ASSET GLOBAL ETFS HOLDINGS Ltd. | 453 | 184.91 | 14 | 225.00 | ||||
| 2025-07-25 | 13F | Atria Wealth Solutions, Inc. | 7,000 | 0.00 | 221 | 0.92 | ||||
| 2025-06-25 | NP | CCNR - ALPS | CoreCommodity Natural Resources ETF | 24,628 | 711 | ||||||
| 2025-08-13 | 13F | Kilter Group LLC | 39 | 1 | ||||||
| 2025-08-12 | 13F | Proequities, Inc. | Put | 0 | 0 | |||||
| 2025-08-12 | 13F | Proequities, Inc. | Call | 0 | 0 | |||||
| 2025-08-12 | 13F | Proequities, Inc. | 0 | 0 | ||||||
| 2025-08-14 | 13F | Lazard Asset Management Llc | 5,358,772 | 4.64 | 161 | 1.26 | ||||
| 2025-08-15 | 13F | Caxton Associates Llp | 17,819 | 2.79 | 536 | -0.74 | ||||
| 2025-08-14 | 13F | Fmr Llc | 176 | -57.07 | 5 | -58.33 | ||||
| 2025-08-14 | 13F | Royal Bank Of Canada | 26,106 | -3.19 | 786 | -6.43 | ||||
| 2025-08-15 | 13F | Tower Research Capital LLC (TRC) | 171 | 5,600.00 | 5 | |||||
| 2025-08-13 | 13F | Mackenzie Financial Corp | 120,229 | 63.51 | 3,619 | 57.92 | ||||
| 2025-07-28 | NP | ZEMRX - American Beacon Ninety One Emerging Markets Equity Fund R6 Class | 87,070 | -0.57 | 2,384 | -5.77 | ||||
| 2025-08-14 | 13F | Wells Fargo & Company/mn | 75,781 | -0.98 | 2,281 | -4.32 | ||||
| 2025-08-12 | 13F | Eisler Capital Management Ltd. | 19,018 | 574 | ||||||
| 2025-05-15 | 13F | Balyasny Asset Management Llc | 0 | -100.00 | 0 | -100.00 | ||||
| 2025-06-26 | NP | Mexico Fund Inc | 120,000 | 0.00 | 3,463 | -3.81 | ||||
| 2025-06-26 | NP | AEMGX - Acadian Emerging Markets Portfolio Investor Class Shares | 54,891 | -13.64 | 1,584 | -16.89 | ||||
| 2025-08-21 | NP | LAZARD RETIREMENT SERIES INC - Lazard Retirement Emerging Markets Equity Portfolio Service Shares | 77,454 | -1.88 | 2,331 | -5.21 | ||||
| 2025-08-12 | 13F/A | Boston Partners | 20,994 | 0.00 | 632 | -3.52 | ||||
| 2025-05-06 | 13F | Bank Julius Baer & Co. Ltd, Zurich | 0 | -100.00 | 0 | |||||
| 2025-08-14 | 13F | State Street Corp | 405,144 | 42.93 | 12,195 | 38.07 | ||||
| 2025-08-11 | 13F | Principal Securities, Inc. | 0 | -100.00 | 0 | |||||
| 2025-08-14 | 13F | Raymond James Financial Inc | 7,097 | 214 | ||||||
| 2025-08-13 | 13F | Pictet Asset Management Holding SA | 0 | -100.00 | 0 | |||||
| 2025-08-07 | 13F | Allworth Financial LP | 4 | 0 | ||||||
| 2025-08-08 | 13F | Larson Financial Group LLC | 9 | -82.35 | 0 | -100.00 | ||||
| 2025-08-12 | 13F | Rhumbline Advisers | 1,354 | 0.00 | 41 | -4.76 | ||||
| 2025-06-27 | NP | EAEMX - Parametric Emerging Markets Fund Investor Class | 3,000 | 0.00 | 87 | -4.44 | ||||
| 2025-05-15 | 13F | Ancora Advisors, LLC | 0 | -100.00 | 0 | -100.00 | ||||
| 2025-08-05 | 13F | Simplex Trading, Llc | Call | 3,900 | -79.79 | 0 | ||||
| 2025-08-13 | 13F | Victory Capital Management Inc | 45,584 | 0.00 | 1,372 | -3.38 | ||||
| 2025-08-13 | 13F | EverSource Wealth Advisors, LLC | 485 | 135.44 | 15 | 133.33 | ||||
| 2025-08-14 | 13F | Headlands Technologies LLC | 685 | 591.92 | 21 | 566.67 | ||||
| 2025-08-07 | 13F | Acadian Asset Management Llc | 1,014,799 | -18.03 | 31 | -21.05 | ||||
| 2025-05-14 | 13F | Group One Trading, L.p. | 0 | -100.00 | 0 | -100.00 | ||||
| 2025-06-18 | NP | RAZAX - Multi-Asset Growth Strategy Fund Class A | 4,404 | 0.00 | 127 | -3.79 | ||||
| 2025-07-14 | 13F | GAMMA Investing LLC | 758 | -60.38 | 23 | -62.71 | ||||
| 2025-08-11 | 13F | Empowered Funds, LLC | 61,431 | 1,849 | ||||||
| 2025-08-14 | 13F | Bank Of America Corp /de/ | 32,635 | -35.90 | 982 | -38.08 | ||||
| 2025-08-18 | 13F | Rexford Capital Inc | 4,020 | 121 | ||||||
| 2025-03-31 | NP | ZEMIX - Ninety One Emerging Markets Equity Fund I Shares | 87,570 | -2.41 | 2,627 | -14.15 | ||||
| 2025-08-15 | 13F/A | Symphony Financial, Ltd. Co. | 12,258 | 393 | ||||||
| 2025-05-12 | 13F | Simplex Trading, Llc | 0 | -100.00 | 0 | |||||
| 2025-08-26 | NP | EQ ADVISORS TRUST - EQ/Lazard Emerging Markets Equity Portfolio Class IB | 114,290 | -1.51 | 3,440 | -4.84 | ||||
| 2025-05-15 | 13F | Qube Research & Technologies Ltd | 0 | -100.00 | 0 | |||||
| 2025-08-05 | 13F | Huntington National Bank | 106 | -6.19 | 3 | 0.00 | ||||
| 2025-07-11 | 13F | Arrow Investment Advisors, LLC | 7,345 | 221 | ||||||
| 2025-08-13 | 13F | Oaktree Fund Advisors, LLC | 51,529 | 3.41 | 1,551 | -0.06 | ||||
| 2025-05-27 | NP | VARIABLE INSURANCE PRODUCTS FUND II - International Index Portfolio Initial Class | 1,033 | 7.94 | 32 | 18.52 | ||||
| 2025-08-07 | 13F | Bearing Point Capital, Llc | 17,000 | 7.59 | 512 | 3.86 | ||||
| 2025-08-25 | NP | EITEX - Parametric Tax-Managed Emerging Markets Fund Institutional Class | 7,422 | 0.00 | 223 | -3.46 | ||||
| 2025-08-14 | 13F | Group One Trading, L.p. | Put | 600 | -60.00 | 18 | -60.87 | |||
| 2025-08-14 | 13F | Group One Trading, L.p. | Call | 500 | -93.75 | 15 | -93.98 | |||
| 2025-08-20 | NP | REMG - Emerging Markets Equity Active ETF | 1,610 | 48 | ||||||
| 2025-07-07 | 13F | Investors Research Corp | 17,300 | 166.15 | 521 | 157.43 | ||||
| 2025-08-14 | 13F | Silvercrest Asset Management Group Llc | 52,752 | 51.88 | 1,588 | 46.67 | ||||
| 2025-07-28 | NP | TEMUX - Emerging Markets Equity Fund | 21,284 | 0.48 | 583 | -4.75 | ||||
| 2025-07-17 | 13F | Sound Income Strategies, LLC | 840 | 0.00 | 25 | -3.85 | ||||
| 2025-08-13 | 13F | Amundi | 509,268 | 3.92 | 16,312 | 12.10 | ||||
| 2025-06-26 | NP | DVYE - iShares Emerging Markets Dividend ETF | 223,443 | 6,449 | ||||||
| 2025-08-08 | 13F | Banco Bilbao Vizcaya Argentaria, S.a. | 8,571 | 0.00 | 258 | -3.75 | ||||
| 2025-07-28 | 13F | Allianz Asset Management GmbH | 35,292 | -4.64 | 1,062 | -7.97 | ||||
| 2025-05-15 | 13F | Macquarie Group Ltd | 0 | -100.00 | 0 | |||||
| 2025-08-14 | 13F | Goldman Sachs Group Inc | 50,763 | 9.35 | 1,528 | 5.60 | ||||
| 2025-08-11 | 13F | Citigroup Inc | 3,574 | -63.85 | 108 | -65.26 | ||||
| 2025-07-25 | NP | USEMX - Emerging Markets Fund Shares | 45,797 | 5.79 | 1,254 | 0.24 | ||||
| 2025-08-05 | 13F | Simplex Trading, Llc | Put | 1,300 | 62.50 | 0 | ||||
| 2025-08-14 | 13F | Wellington Management Group Llp | 0 | -100.00 | 0 | |||||
| 2025-03-27 | NP | EQIAX - Wells Fargo Emerging Markets Equity Income Fund Class A | 55,128 | -3.77 | 1,654 | -15.40 | ||||
| 2025-08-14 | 13F | Militia Capital Partners, LP | 36,084 | 16.09 | 1,086 | 12.19 | ||||
| 2025-08-12 | 13F | Jpmorgan Chase & Co | 518 | -0.19 | 16 | -6.25 | ||||
| 2025-08-21 | NP | LZOEX - Lazard Emerging Markets Equity Portfolio Open Shares | 939,276 | 6.80 | 28,272 | 3.17 | ||||
| 2025-08-11 | 13F | TD Waterhouse Canada Inc. | 0 | -100.00 | 0 | |||||
| 2025-08-15 | 13F | Morgan Stanley | 208,382 | -10.58 | 6,272 | -13.62 | ||||
| 2025-08-14 | 13F/A | Skopos Labs, Inc. | 10,036 | 397.32 | 302 | 387.10 | ||||
| 2025-08-14 | 13F | Ubs Asset Management Americas Inc | 0 | -100.00 | 0 | |||||
| 2025-08-13 | 13F | Jones Financial Companies Lllp | 338 | 9.74 | 10 | 11.11 | ||||
| 2025-07-11 | 13F | Farther Finance Advisors, LLC | 42 | -77.54 | 1 | -80.00 | ||||
| 2025-07-15 | 13F | Public Employees Retirement System Of Ohio | 99,868 | -15.19 | 3,006 | -18.07 | ||||
| 2025-08-28 | NP | XCNY - SPDR S&P Emerging Markets ex-China ETF | 100 | 0.00 | 3 | 0.00 | ||||
| 2025-08-14 | 13F/A | Barclays Plc | 1 | -99.98 | 0 | |||||
| 2025-08-13 | 13F | Walleye Trading LLC | Call | 7,500 | 0.00 | 226 | -3.43 | |||
| 2025-08-21 | NP | SLX - VanEck Vectors Steel ETF | 105,266 | -1.13 | 3,169 | -4.49 | ||||
| 2025-08-08 | 13F | Mitsubishi UFJ Trust & Banking Corp | 4,945 | -32.38 | 149 | -34.80 | ||||
| 2025-08-13 | 13F | Walleye Trading LLC | Put | 100 | -80.00 | 3 | -80.00 | |||
| 2025-08-12 | 13F | Advisors Asset Management, Inc. | 0 | -100.00 | 0 | |||||
| 2025-08-13 | 13F | Employees Retirement System of Texas | 6,823 | -56.79 | 0 | |||||
| 2025-07-29 | 13F | Activest Wealth Management | 315 | 6.06 | 9 | 0.00 | ||||
| 2025-08-28 | NP | NDOW - Anydrus Advantage ETF | 2,976 | 90 | ||||||
| 2025-08-08 | 13F | Pnc Financial Services Group, Inc. | 10 | -80.00 | 0 | -100.00 | ||||
| 2025-08-12 | 13F | Prudential Plc | 680,185 | -9.73 | 20,474 | -12.80 | ||||
| 2025-08-14 | 13F | Verition Fund Management LLC | 0 | -100.00 | 0 | |||||
| 2025-08-13 | 13F | Arrowstreet Capital, Limited Partnership | 0 | -100.00 | 0 | |||||
| 2025-08-08 | 13F | Principal Financial Group Inc | 129,297 | 35.41 | 3,892 | 30.79 | ||||
| 2025-08-27 | NP | TPDAX - Timothy Plan Defensive Strategies Fund Class A | 1,095 | 0.00 | 33 | -5.88 | ||||
| 2025-05-02 | 13F | Concord Wealth Partners | 0 | -100.00 | 0 | |||||
| 2025-08-14 | 13F | Jane Street Group, Llc | Call | 11,100 | 334 | |||||
| 2025-08-14 | 13F | Jane Street Group, Llc | Put | 17,800 | 536 | |||||
| 2025-08-15 | 13F | WealthCollab, LLC | 178 | 0.00 | 5 | 0.00 | ||||
| 2025-08-14 | 13F | CoreCommodity Management, LLC | 35,444 | -1.30 | 1,067 | -4.74 | ||||
| 2025-08-14 | 13F | GWM Advisors LLC | 1,200 | 0.00 | 36 | -2.70 | ||||
| 2025-07-30 | 13F | Whittier Trust Co | 180 | 5 | ||||||
| 2025-08-14 | 13F | Millennium Management Llc | 38,975 | -69.27 | 1,173 | -70.31 | ||||
| 2025-03-27 | NP | RTNAX - Tax-Managed International Equity Fund Class A | 41,955 | 0.00 | 1,259 | -12.09 | ||||
| 2025-08-12 | 13F | O'shaughnessy Asset Management, Llc | 13,058 | -8.98 | 393 | -12.08 | ||||
| 2025-07-29 | NP | BPLSX - Boston Partners Long/Short Equity Fund INSTITUTIONAL | 10,217 | 4.31 | 280 | -1.06 | ||||
| 2025-08-06 | 13F | First Horizon Advisors, Inc. | 24 | 1 | ||||||
| 2025-08-26 | NP | OEQAX - Oaktree Emerging Markets Equity Fund Class A | 51,529 | 3.41 | 1,551 | -0.06 | ||||
| 2025-08-12 | 13F | Atlas Capital Advisors Llc | 1,195 | 0.00 | 36 | -5.41 | ||||
| 2025-08-14 | 13F | Susquehanna International Group, Llp | Call | 30,900 | 930 | |||||
| 2025-08-14 | 13F | Susquehanna International Group, Llp | Put | 10,800 | -83.31 | 325 | -83.88 | |||
| 2025-07-15 | 13F | Mather Group, Llc. | 0 | -100.00 | 0 | |||||
| 2025-08-13 | 13F | Renaissance Technologies Llc | 247,900 | -2.56 | 7,462 | -5.88 | ||||
| 2025-07-24 | 13F | Us Bancorp \de\ | 0 | -100.00 | 0 | |||||
| 2025-08-13 | 13F | Jump Financial, LLC | 0 | -100.00 | 0 | |||||
| 2025-06-30 | NP | VASVX - Vanguard Selected Value Fund Investor Shares | 1,180,696 | 0.00 | 34,075 | -3.80 | ||||
| 2025-05-09 | 13F | R Squared Ltd | 0 | -100.00 | 0 | |||||
| 2025-08-14 | 13F | Wiley Bros.-aintree Capital, Llc | 9,325 | 282 | ||||||
| 2025-07-08 | 13F | Lingohr & Partner Asset Management GmbH | 0 | -100.00 | 0 | |||||
| 2025-06-26 | NP | GYLD - Arrow Dow Jones Global Yield ETF | 5,123 | 148 | ||||||
| 2025-08-13 | 13F | Schroder Investment Management Group | 2,177,525 | 11.03 | 65,544 | 7.25 | ||||
| 2025-08-14 | 13F | Sei Investments Co | 25,884 | -46.93 | 779 | -48.72 | ||||
| 2025-08-14 | 13F | Voloridge Investment Management, Llc | 49,856 | -15.30 | 1,501 | -18.21 | ||||
| 2025-05-05 | 13F | Eagle Bay Advisors LLC | 0 | -100.00 | 0 | -100.00 | ||||
| 2025-06-26 | NP | MSTFX - Morningstar International Equity Fund | 17,336 | 15.91 | 500 | 11.61 | ||||
| 2025-08-13 | 13F | Contrarian Capital Management, L.l.c. | 992,413 | 0.00 | 29,872 | -3.40 | ||||
| 2025-08-14 | 13F | Susquehanna International Group, Llp | 0 | -100.00 | 0 | |||||
| 2025-08-14 | 13F | Numerai GP LLC | 11,471 | -11.87 | 345 | -14.81 | ||||
| 2025-08-28 | NP | EDIV - SPDR(R) S&P(R) Emerging Markets Dividend ETF | 260,444 | 17.66 | 7,839 | 13.66 | ||||
| 2025-08-01 | 13F | Envestnet Asset Management Inc | 34,780 | -8.29 | 1,047 | -11.43 | ||||
| 2025-08-14 | 13F | CoreCap Advisors, LLC | 77 | 0.00 | 2 | 0.00 | ||||
| 2025-08-13 | 13F | Invesco Ltd. | 22,257 | 58.38 | 670 | 53.09 | ||||
| 2025-07-30 | NP | ORR - Militia Long/Short Equity ETF | 58,221 | 1,594 |