Mga Batayang Estadistika
| Saham Institusional (Jangka Panjang) | 3,432,438 - 18.75% (ex 13D/G) - change of -0.00MM shares -0.03% MRQ |
| Nilai Institusional (Jangka Panjang) | $ 258,550 USD ($1000) |
Kepemilikan Institusional dan Pemegang Saham
Danaos Corporation (US:DAC) memiliki 132 pemilik institusional dan pemegang saham yang telah mengajukan formulir 13D/G atau 13F kepada Komisi Bursa Efek (Securities Exchange Commission/SEC). Lembaga-lembaga ini memegang total 3,434,110 saham. Pemegang saham terbesar meliputi Ion Asset Management Ltd., RBF Capital, LLC, Acadian Asset Management Llc, Arrowstreet Capital, Limited Partnership, No Street GP LP, Morgan Stanley, Susquehanna International Group, Llp, Susquehanna International Group, Llp, Jpmorgan Chase & Co, and Commonwealth Equity Services, Llc .
Struktur kepemilikan institusional Danaos Corporation (NYSE:DAC) menunjukkan posisi terkini di perusahaan oleh institusi dan dana, serta perubahan terbaru dalam ukuran posisi. Pemegang saham utama dapat mencakup investor individu, reksa dana, dana lindung nilai, atau institusi. Jadwal 13D menunjukkan bahwa investor memegang (atau pernah memegang) lebih dari 5% saham perusahaan dan bermaksud (atau pernah bermaksud) untuk secara aktif mengejar perubahan strategi bisnis. Jadwal 13G menunjukkan investasi pasif lebih dari 5%.
The share price as of September 5, 2025 is 95.46 / share. Previously, on September 6, 2024, the share price was 77.07 / share. This represents an increase of 23.86% over that period.

Skor Sentimen Dana
Skor Sentimen Dana (sebelumnya dikenal sebagai Skor Akumulasi Kepemilikan) menemukan saham-saham yang paling banyak dibeli oleh dana. Ini adalah hasil dari model kuantitatif multi-faktor yang canggih yang mengidentifikasi perusahaan dengan tingkat akumulasi institusional tertinggi. Model penilaian menggunakan kombinasi dari total peningkatan pemilik yang diungkapkan, perubahan dalam alokasi portofolio pada pemilik tersebut, dan metrik lainnya. Angka berkisar dari 0 hingga 100, dengan angka yang lebih tinggi menunjukkan tingkat akumulasi yang lebih tinggi dibandingkan dengan perusahaan sejenisnya, dan 50 adalah rata-ratanya.
Frekuensi Pembaruan: Setiap Hari
Lihat Ownership Explorer, yang menyediakan daftar perusahaan dengan peringkat tertinggi.
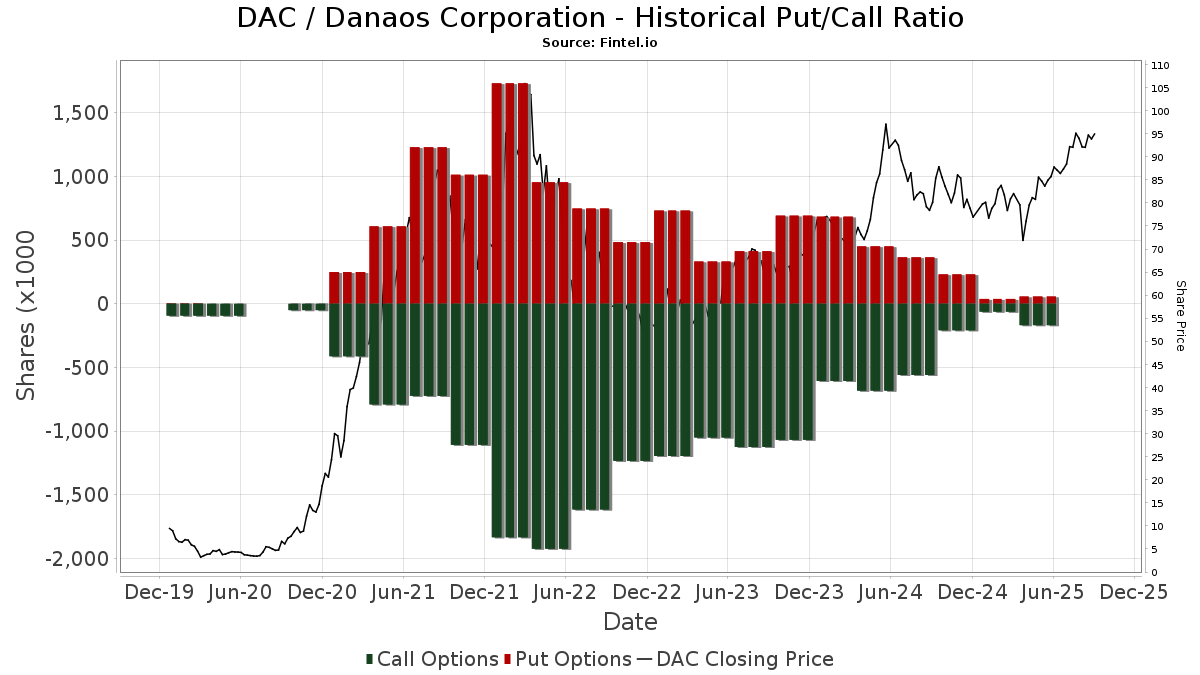
Rasio Put/Call Institusional
Selain melaporkan isu ekuitas dan utang standar, institusi dengan aset di bawah manajemen lebih dari 100 juta dolar AS juga harus mengungkapkan kepemilikan opsi put dan call mereka. Karena opsi put umumnya menunjukkan sentimen negatif, dan opsi call menunjukkan sentimen positif, kita dapat mengetahui sentimen institusional secara keseluruhan dengan memplot rasio put terhadap call. Grafik di sebelah kanan memplot rasio put/call historis untuk instrumen ini.
Menggunakan Rasio Put/Call sebagai indikator sentimen investor mengatasi salah satu kekurangan utama dari penggunaan total kepemilikan institusional, yaitu sejumlah besar aset yang dikelola diinvestasikan secara pasif untuk melacak indeks. Dana yang dikelola secara pasif biasanya tidak membeli opsi, sehingga indikator rasio put/call lebih akurat dalam melacak sentimen dana yang dikelola secara aktif.
Pengajuan 13D/G
Kami menyajikan pengajuan 13D/G secara terpisah dari pengajuan 13F karena perlakuan yang berbeda oleh SEC. Pengajuan 13D/G dapat diajukan oleh kelompok investor (dengan satu pemimpin), sedangkan pengajuan 13F tidak bisa. Hal ini mengakibatkan situasi di mana seorang investor dapat mengajukan 13D/G yang melaporkan satu nilai untuk total saham (mewakili semua saham yang dimiliki oleh kelompok investor), tetapi kemudian mengajukan 13F yang melaporkan nilai yang berbeda untuk total saham (mewakili kepemilikan mereka sendiri). Ini berarti bahwa kepemilikan saham dari pengajuan 13D/G dan pengajuan 13F seringkali tidak dapat dibandingkan secara langsung, sehingga kami menyajikannya secara terpisah.
Catatan: Mulai 16 Mei 2021, kami tidak lagi menampilkan pemilik yang belum mengajukan 13D/G dalam setahun terakhir. Sebelumnya, kami menampilkan riwayat lengkap pengajuan 13D/G. Secara umum, entitas yang diwajibkan untuk mengajukan pengajuan 13D/G harus mengajukan setidaknya setiap tahun sebelum mengirimkan pengajuan penutupan. Namun, terkadang dana keluar dari posisi tanpa mengirimkan pengajuan penutupan (misalnya, mereka menghentikan operasi), sehingga menampilkan riwayat lengkap terkadang menyebabkan kebingungan tentang kepemilikan saat ini. Untuk mencegah kebingungan, kami sekarang hanya menampilkan pemilik 'saat ini' - yaitu - pemilik yang telah mengajukan dalam setahun terakhir.
Upgrade to unlock premium data.
| Tanggal File | Formulir | Investor | Sebelumnya Saham |
Terbaru Saham |
Δ Saham (Persen) |
Kepemilikan (Persen) |
Δ Pagmamay-ari (Persen) |
|
|---|---|---|---|---|---|---|---|---|
| 2025-04-09 | Danaos Investments Ltd As Trustee Of The 883 Trust | 9,338,502 | 9,338,502 | 0.00 | 50.50 | 2.23 |
Pengajuan 13F dan NPORT
Detail pada pengajuan 13F tersedia gratis. Detail pada pengajuan NP memerlukan keanggotaan premium. Baris berwarna hijau menunjukkan posisi baru. Baris berwarna merah menunjukkan posisi yang sudah ditutup. Klik tautan ini ikon untuk melihat riwayat transaksi selengkapnya.
Tingkatkan
untuk membuka data premium dan mengekspor ke Excel ![]() .
.
| Tanggal File | Sumber | Investor | Ketik | Presyo ng Avg (Silangan) |
Saham | Δ Saham (%) |
Dilaporkan Nilai ($1000) |
Nilai Δ (%) |
Alokasi Port (%) |
|
|---|---|---|---|---|---|---|---|---|---|---|
| 2025-07-24 | 13F | Ronald Blue Trust, Inc. | 648 | -88.74 | 56 | -87.75 | ||||
| 2025-08-12 | 13F | XTX Topco Ltd | 0 | -100.00 | 0 | |||||
| 2025-08-12 | 13F | MAI Capital Management | 179 | 15 | ||||||
| 2025-08-04 | 13F | Spire Wealth Management | 28 | 2 | ||||||
| 2025-08-14 | 13F | Aqr Capital Management Llc | 22,319 | -14.95 | 1,925 | -7.54 | ||||
| 2025-08-14 | 13F | Wells Fargo & Company/mn | 16,848 | -7.58 | 1,453 | 2.18 | ||||
| 2025-07-15 | 13F | Public Employees Retirement System Of Ohio | 327 | 4.81 | 28 | 16.67 | ||||
| 2025-08-28 | NP | CPAEX - Counterpoint Tactical Equity Fund Class A Shares | 4,636 | 400 | ||||||
| 2025-05-14 | 13F | Peak6 Llc | 0 | -100.00 | 0 | -100.00 | ||||
| 2025-08-14 | 13F | Susquehanna International Group, Llp | Put | 38,100 | 10.43 | 3,286 | 22.03 | |||
| 2025-08-14 | 13F | Susquehanna International Group, Llp | 95,707 | 153.07 | 8,254 | 179.76 | ||||
| 2025-08-14 | 13F | Susquehanna International Group, Llp | Call | 84,500 | 262.66 | 7,287 | 300.83 | |||
| 2025-08-13 | 13F | Russell Investments Group, Ltd. | 9,202 | 0.00 | 794 | 10.45 | ||||
| 2025-08-14 | 13F | State Street Corp | 16,348 | -21.98 | 1,410 | -13.77 | ||||
| 2025-08-19 | 13F | State of Wyoming | 2,128 | 205.31 | 184 | 238.89 | ||||
| 2025-08-18 | 13F | Wolverine Trading, Llc | Put | 2,800 | 3.70 | 245 | 14.02 | |||
| 2025-08-14 | 13F | CastleKnight Management LP | 5,100 | -32.89 | 440 | -25.97 | ||||
| 2025-08-12 | 13F | LPL Financial LLC | 2,505 | 216 | ||||||
| 2025-08-14 | 13F | Two Sigma Investments, Lp | 45,497 | 97.00 | 3,924 | 117.70 | ||||
| 2025-08-27 | NP | TIFF INVESTMENT PROGRAM - TIFF Multi-Asset Fund | Short | -1,672 | -144 | |||||
| 2025-04-24 | NP | FNDB - Schwab Fundamental U.S. Broad Market Index ETF This fund is a listed as child fund of Charles Schwab Investment Management Inc and if that institution has disclosed ownership in this security, then these positions will not be double counted when calculating total shares and total value | 96 | -43.20 | 8 | -46.15 | ||||
| 2025-08-13 | 13F | Northern Trust Corp | 11,319 | 139.91 | 976 | 165.22 | ||||
| 2025-08-13 | 13F | Marshall Wace, Llp | 3,200 | 276 | ||||||
| 2025-08-11 | 13F | Principal Securities, Inc. | 0 | -100.00 | 0 | |||||
| 2025-08-11 | 13F | TD Waterhouse Canada Inc. | 1,250 | 107 | ||||||
| 2025-05-13 | 13F | Clear Street Markets Llc | 0 | -100.00 | 0 | |||||
| 2025-08-13 | 13F | Advisory Research Inc | 36,815 | 50.42 | 3,175 | 66.27 | ||||
| 2025-07-10 | 13F | Redhawk Wealth Advisors, Inc. | 12,594 | 1.49 | 1,086 | 12.19 | ||||
| 2025-08-14 | 13F | Raymond James Financial Inc | 742 | 64 | ||||||
| 2025-08-12 | 13F | Jpmorgan Chase & Co | 82,834 | 39.83 | 7,144 | 54.54 | ||||
| 2025-08-14 | 13F | Toroso Investments, LLC | 7,850 | -36.65 | 677 | -30.02 | ||||
| 2025-08-18 | 13F | Wolverine Trading, Llc | 7,940 | 695 | ||||||
| 2025-04-17 | 13F | FNY Investment Advisers, LLC | 0 | -100.00 | 0 | |||||
| 2025-08-18 | 13F | Wolverine Trading, Llc | Call | 18,900 | 158.90 | 1,653 | 185.49 | |||
| 2025-08-12 | 13F | Legal & General Group Plc | 145 | 0.00 | 13 | 9.09 | ||||
| 2025-08-13 | 13F | Corsair Capital Management, L.p. | 14,000 | 180.00 | 1,207 | 209.49 | ||||
| 2025-08-13 | 13F | Centiva Capital, LP | 4,226 | 364 | ||||||
| 2025-08-07 | 13F | Resources Investment Advisors, LLC. | 3,289 | 0.03 | 284 | 10.55 | ||||
| 2025-08-14 | 13F | Lazard Asset Management Llc | 0 | -100.00 | 0 | |||||
| 2025-04-24 | 13F | U S Global Investors Inc | 0 | -100.00 | 0 | |||||
| 2025-08-06 | 13F | Commonwealth Equity Services, Llc | 69,863 | 0.72 | 6 | 20.00 | ||||
| 2025-08-14 | 13F | Two Sigma Advisers, Lp | 42,100 | 20.63 | 3,631 | 33.31 | ||||
| 2025-08-13 | 13F | Victory Financial Group, Llc | 4,178 | 360 | ||||||
| 2025-07-18 | 13F | Founders Capital Management | 900 | 0.00 | 78 | 10.00 | ||||
| 2025-08-05 | 13F | GHP Investment Advisors, Inc. | 0 | -100.00 | 0 | |||||
| 2025-08-13 | 13F | Arrowstreet Capital, Limited Partnership | 282,655 | -5.64 | 24,376 | 4.29 | ||||
| 2025-08-13 | 13F | ExodusPoint Capital Management, LP | 0 | -100.00 | 0 | |||||
| 2025-07-23 | 13F | Indiana Trust & Investment Management CO | 100 | 0.00 | 9 | 14.29 | ||||
| 2025-04-21 | 13F | Nelson, Van Denburg & Campbell Wealth Management Group, LLC | 0 | -100.00 | 0 | |||||
| 2025-08-08 | 13F | Creative Planning | 5,989 | -27.11 | 516 | -19.50 | ||||
| 2025-04-29 | 13F | Envestnet Asset Management Inc | 0 | -100.00 | 0 | |||||
| 2025-05-14 | 13F | Walleye Trading LLC | Call | 0 | -100.00 | 0 | ||||
| 2025-05-14 | 13F | Walleye Trading LLC | Put | 0 | -100.00 | 0 | ||||
| 2025-08-08 | 13F | Smithfield Trust Co | 160 | 0.00 | 0 | |||||
| 2025-08-12 | 13F | Rhumbline Advisers | 0 | -100.00 | 0 | |||||
| 2025-08-01 | 13F | Y-Intercept (Hong Kong) Ltd | 3,057 | 264 | ||||||
| 2025-08-04 | 13F | Assetmark, Inc | 468 | 15,500.00 | 40 | |||||
| 2025-08-13 | 13F | Natixis Advisors, L.p. | 0 | -100.00 | 0 | |||||
| 2025-08-05 | 13F | Simplex Trading, Llc | 0 | -100.00 | 0 | |||||
| 2025-08-14 | 13F/A | Skopos Labs, Inc. | 52 | -45.83 | 4 | -42.86 | ||||
| 2025-07-24 | 13F | Us Bancorp \de\ | 71 | -6.58 | 6 | 20.00 | ||||
| 2025-05-29 | NP | OAIEX - Optimum International Fund Class A | 0 | -100.00 | 0 | -100.00 | ||||
| 2025-04-22 | 13F | TrueMark Investments, LLC | 0 | -100.00 | 0 | |||||
| 2025-09-04 | 13F/A | Advisor Group Holdings, Inc. | 37,290 | 27.07 | 3,218 | 40.46 | ||||
| 2025-07-14 | 13F | GAMMA Investing LLC | 0 | -100.00 | 0 | |||||
| 2025-08-14 | 13F | Bank Of America Corp /de/ | 57,598 | -13.09 | 4,967 | -3.95 | ||||
| 2025-08-08 | 13F | Pinney & Scofield, Inc. | 255 | 0.00 | 22 | 10.53 | ||||
| 2025-08-11 | 13F | Bell Investment Advisors, Inc | 126 | 0.00 | 11 | 11.11 | ||||
| 2025-07-08 | 13F | Ballew Advisors, Inc | 3,001 | 0.37 | 263 | 20.09 | ||||
| 2025-08-12 | 13F | Proequities, Inc. | Put | 0 | 0 | |||||
| 2025-08-13 | 13F | Jump Financial, LLC | 19,500 | 1,682 | ||||||
| 2025-08-13 | 13F | EverSource Wealth Advisors, LLC | 184 | -17.86 | 16 | -11.76 | ||||
| 2025-08-12 | 13F | Proequities, Inc. | 0 | 0 | ||||||
| 2025-07-08 | 13F | Parallel Advisors, LLC | 853 | 11.80 | 74 | 23.73 | ||||
| 2025-08-13 | 13F | Aristides Capital LLC | 2,856 | 246 | ||||||
| 2025-08-28 | NP | SIEMX - SIT EMERGING MARKETS EQUITY FUND - CLASS F, effective 1-31-2017 (formerly Class A) | 4,644 | -43.70 | 400 | -37.79 | ||||
| 2025-08-12 | 13F | BlackRock, Inc. | 51,008 | -3.12 | 4,399 | 7.06 | ||||
| 2025-08-18 | 13F/A | National Bank Of Canada /fi/ | 3,797 | -2.99 | 327 | 7.57 | ||||
| 2025-07-30 | NP | DEEP - Roundhill Acquirers Deep Value ETF | 3,128 | -17.10 | 267 | -10.14 | ||||
| 2025-05-16 | 13F/A | Kestra Investment Management, LLC | 0 | -100.00 | 0 | |||||
| 2025-08-05 | 13F | Hi-Line Capital Management, LLC | 28,768 | 2,481 | ||||||
| 2025-08-14 | 13F | RBF Capital, LLC | 418,015 | 0.00 | 36,050 | 10.52 | ||||
| 2025-08-06 | 13F | Malaga Cove Capital, LLC | 0 | -100.00 | 0 | |||||
| 2025-08-14 | 13F | Engineers Gate Manager LP | 0 | -100.00 | 0 | |||||
| 2025-05-09 | 13F | New Age Alpha Advisors, LLC | 0 | -100.00 | 0 | |||||
| 2025-08-14 | 13F | UBS Group AG | 30,299 | -18.44 | 2,613 | -9.87 | ||||
| 2025-08-05 | 13F | Harel Insurance Investments & Financial Services Ltd. | 0 | -100.00 | 0 | |||||
| 2025-08-14 | 13F | Hrt Financial Lp | 18,992 | 115.16 | 2 | |||||
| 2025-07-16 | 13F | Signaturefd, Llc | 905 | 12.98 | 78 | 25.81 | ||||
| 2025-08-13 | 13F | Invesco Ltd. | 18,938 | -60.08 | 1,633 | -55.88 | ||||
| 2025-08-26 | NP | BOAT - SonicShares Global Shipping ETF | 7,850 | 8.43 | 677 | 19.86 | ||||
| 2025-07-31 | 13F | Caitong International Asset Management Co., Ltd | 65 | 6 | ||||||
| 2025-08-14 | 13F | Boston Private Wealth Llc | 0 | -100.00 | 0 | |||||
| 2025-08-27 | 13F/A | Squarepoint Ops LLC | 0 | -100.00 | 0 | -100.00 | ||||
| 2025-08-27 | 13F/A | Squarepoint Ops LLC | Call | 0 | -100.00 | 0 | -100.00 | |||
| 2025-08-14 | 13F | Sei Investments Co | 11,024 | -7.59 | 951 | 2.15 | ||||
| 2025-07-25 | 13F | JustInvest LLC | 2,578 | 222 | ||||||
| 2025-07-11 | 13F | Kingstone Capital Partners Texas, LLC | 26,400 | 2 | ||||||
| 2025-08-07 | 13F | Allworth Financial LP | 1,512 | -22.10 | 130 | -16.67 | ||||
| 2025-08-13 | 13F | Walleye Capital LLC | 13,092 | 1,129 | ||||||
| 2025-08-05 | 13F | Simplex Trading, Llc | Put | 5,400 | 5,300.00 | 0 | ||||
| 2025-08-28 | NP | WAGNX - Pabrai Wagons Fund Retail Class | 16,660 | 13.33 | 1,437 | 25.20 | ||||
| 2025-05-09 | 13F | Headlands Technologies LLC | 0 | -100.00 | 0 | |||||
| 2025-08-13 | 13F | Quadrant Capital Group Llc | 0 | -100.00 | 0 | |||||
| 2025-08-06 | 13F | Bastion Asset Management Inc. | 37,514 | 50.61 | 3,217 | 59.65 | ||||
| 2025-05-09 | 13F | Charles Schwab Investment Management Inc | 0 | -100.00 | 0 | |||||
| 2025-08-14 | 13F | Voloridge Investment Management, Llc | 66,192 | -27.95 | 5,708 | -20.37 | ||||
| 2025-05-30 | NP | SEEM - SEI Select Emerging Markets Equity ETF | 5,300 | 414 | ||||||
| 2025-04-28 | 13F | First Horizon Advisors, Inc. | 0 | -100.00 | 0 | |||||
| 2025-08-11 | 13F | Citigroup Inc | 1,123 | -17.18 | 97 | -8.57 | ||||
| 2025-08-08 | 13F | Commonwealth Of Pennsylvania Public School Empls Retrmt Sys | 9,071 | 0.00 | 782 | 10.61 | ||||
| 2025-08-12 | 13F | Virtu Financial LLC | 0 | -100.00 | 0 | |||||
| 2025-04-24 | NP | FNDA - Schwab Fundamental U.S. Small Company Index ETF This fund is a listed as child fund of Charles Schwab Investment Management Inc and if that institution has disclosed ownership in this security, then these positions will not be double counted when calculating total shares and total value | 14,341 | -49.34 | 1,127 | -49.84 | ||||
| 2025-08-07 | 13F | Parkside Financial Bank & Trust | 20 | -25.93 | 2 | -50.00 | ||||
| 2025-08-11 | 13F | Inspire Advisors, LLC | 9,666 | -18.93 | 834 | -10.43 | ||||
| 2025-08-14 | 13F | Millennium Management Llc | 50,951 | 271.55 | 4,394 | 310.65 | ||||
| 2025-08-14 | 13F | Cubist Systematic Strategies, LLC | 23,411 | 719.14 | 2,019 | 804.93 | ||||
| 2025-07-29 | 13F | Morgan Dempsey Capital Management Llc | 4,564 | 41.70 | 394 | 56.57 | ||||
| 2025-07-29 | 13F | Millburn Ridgefield Corp | 0 | -100.00 | 0 | |||||
| 2025-08-12 | 13F | Pacer Advisors, Inc. | 6 | -50.00 | 1 | |||||
| 2025-08-28 | NP | EWX - SPDR(R) S&P(R) EMERGING MARKETS SMALL CAP ETF | 6,980 | 0.00 | 602 | 10.48 | ||||
| 2025-05-08 | 13F | Moors & Cabot, Inc. | 0 | -100.00 | 0 | |||||
| 2025-08-08 | 13F | SBI Securities Co., Ltd. | 121 | 37.50 | 10 | 66.67 | ||||
| 2025-08-14 | 13F | Jane Street Group, Llc | Call | 41,000 | 791.30 | 3,536 | 887.43 | |||
| 2025-08-14 | 13F | Jane Street Group, Llc | 10,446 | -55.31 | 901 | -50.63 | ||||
| 2025-08-14 | 13F | Point72 Asset Management, L.P. | 7,092 | -31.15 | 612 | -23.91 | ||||
| 2025-08-14 | 13F | Jane Street Group, Llc | Put | 4,200 | 362 | |||||
| 2025-07-10 | 13F | Exchange Traded Concepts, Llc | 2,773 | -9.76 | 239 | 0.00 | ||||
| 2025-08-15 | 13F | WealthCollab, LLC | 522 | -7.94 | 45 | 2.27 | ||||
| 2025-05-14 | 13F | Walleye Capital LLC | Call | 0 | -100.00 | 0 | -100.00 | |||
| 2025-08-14 | 13F | GWM Advisors LLC | 2,605 | 23,581.82 | 225 | |||||
| 2025-08-05 | 13F | NewSquare Capital LLC | 2 | 0.00 | 0 | |||||
| 2025-05-15 | 13F | Millennium Management Llc | Put | 0 | -100.00 | 0 | -100.00 | |||
| 2025-07-14 | 13F | Counterpoint Mutual Funds LLC | 4,636 | 400 | ||||||
| 2025-05-30 | NP | TFPN - Blueprint Chesapeake Multi-Asset Trend ETF | 5,151 | -9.41 | 402 | -11.87 | ||||
| 2025-05-14 | 13F | Walleye Capital LLC | Put | 0 | -100.00 | 0 | -100.00 | |||
| 2025-05-05 | 13F | IFP Advisors, Inc | 0 | -100.00 | 0 | |||||
| 2025-05-05 | 13F | Lindbrook Capital, Llc | 164 | -7.87 | 13 | -14.29 | ||||
| 2025-08-14 | 13F | PDT Partners, LLC | 10,640 | 0.00 | 918 | 10.48 | ||||
| 2025-07-15 | 13F | Ballentine Partners, LLC | 0 | -100.00 | 0 | |||||
| 2025-08-15 | 13F | Tower Research Capital LLC (TRC) | 775 | 67 | ||||||
| 2025-04-29 | 13F | Td Private Client Wealth Llc | 0 | -100.00 | 0 | |||||
| 2025-08-14 | 13F | Aquatic Capital Management LLC | 4,553 | -52.35 | 393 | -47.38 | ||||
| 2025-08-11 | 13F | Hexagon Capital Partners LLC | 0 | -100.00 | 0 | |||||
| 2025-05-22 | NP | MXENX - Great-West Emerging Markets Equity Fund Institutional Class | 10,840 | -3.51 | 846 | -6.01 | ||||
| 2025-05-30 | NP | New Age Alpha Funds Trust - NAA Opportunity Fund Class C | 0 | -100.00 | 0 | -100.00 | ||||
| 2025-08-12 | 13F | Aigen Investment Management, Lp | 3,286 | 283 | ||||||
| 2025-08-08 | 13F | SG Americas Securities, LLC | 2,727 | 11.08 | 0 | |||||
| 2025-08-12 | 13F | Global Retirement Partners, LLC | 0 | -100.00 | 0 | |||||
| 2025-08-14 | 13F | Qube Research & Technologies Ltd | 0 | -100.00 | 0 | |||||
| 2025-03-26 | NP | SFSNX - Schwab Fundamental US Small Company Index Fund Institutional Shares | 2,692 | -51.01 | 213 | -52.67 | ||||
| 2025-08-07 | 13F | Commerce Bank | 2,360 | 204 | ||||||
| 2025-06-30 | NP | PRFZ - Invesco FTSE RAFI US 1500 Small-Mid ETF This fund is a listed as child fund of Invesco Ltd. and if that institution has disclosed ownership in this security, then these positions will not be double counted when calculating total shares and total value | 28,372 | -26.70 | 2,302 | -24.95 | ||||
| 2025-08-14 | 13F | Petrus Trust Company, LTA | 0 | -100.00 | 0 | |||||
| 2025-08-13 | 13F | Jones Financial Companies Lllp | 48 | 0.00 | 4 | 33.33 | ||||
| 2025-08-14 | 13F | Vident Advisory, LLC | 8,395 | -58.68 | 724 | -54.32 | ||||
| 2025-08-07 | 13F | Readystate Asset Management Lp | 6,377 | 550 | ||||||
| 2025-08-07 | 13F | PFG Advisors | 6,637 | 8.18 | 572 | 19.67 | ||||
| 2025-07-14 | 13F | UMA Financial Services, Inc. | 15 | 1 | ||||||
| 2025-04-24 | 13F | Wingate Wealth Advisors, Inc. | 0 | -100.00 | 0 | |||||
| 2025-06-30 | NP | EELV - Invesco S&P Emerging Markets Low Volatility ETF This fund is a listed as child fund of Invesco Ltd. and if that institution has disclosed ownership in this security, then these positions will not be double counted when calculating total shares and total value | 17,929 | -14.86 | 1,454 | -12.83 | ||||
| 2025-08-14 | 13F | Goldman Sachs Group Inc | 33,944 | -26.55 | 2,927 | -18.83 | ||||
| 2025-05-28 | NP | LEAIX - Lazard Emerging Markets Equity Advantage Portfolio Institutional Shares | 3,192 | 23.10 | 249 | 20.29 | ||||
| 2025-08-14 | 13F | Verition Fund Management LLC | 3,919 | -75.69 | 338 | -73.21 | ||||
| 2025-08-27 | 13F/A | Squarepoint Ops LLC | Put | 0 | -100.00 | 0 | -100.00 | |||
| 2025-08-14 | 13F | Group One Trading, L.p. | Put | 3,000 | 259 | |||||
| 2025-03-28 | NP | HAOSX - Harbor Overseas Fund Institutional Class | 49 | -98.61 | 4 | -98.96 | ||||
| 2025-08-14 | 13F | Group One Trading, L.p. | 348 | 30 | ||||||
| 2025-08-11 | 13F | Semanteon Capital Management, LP | 0 | -100.00 | 0 | |||||
| 2025-08-13 | 13F | Northwestern Mutual Wealth Management Co | 0 | -100.00 | 0 | |||||
| 2025-08-28 | NP | SPEM - SPDR(R) Portfolio Emerging Markets ETF | 7,526 | 2.08 | 649 | 12.87 | ||||
| 2025-08-14 | 13F | Federation des caisses Desjardins du Quebec | 100 | -53.92 | 9 | -50.00 | ||||
| 2025-08-15 | 13F | Morgan Stanley | 188,482 | 16.05 | 16,255 | 28.26 | ||||
| 2025-08-07 | 13F | Acadian Asset Management Llc | 305,103 | -11.62 | 26 | 0.00 | ||||
| 2025-07-11 | 13F | Farther Finance Advisors, LLC | 272 | 4,433.33 | 23 | |||||
| 2025-07-18 | 13F | Westhampton Capital, LLC | 4,255 | 0.00 | 367 | 10.24 | ||||
| 2025-05-14 | 13F | Peak6 Llc | Put | 0 | -100.00 | 0 | -100.00 | |||
| 2025-06-30 | NP | SHPP - Pacer Industrials and Logistics ETF | 12 | -7.69 | 1 | -100.00 | ||||
| 2025-08-07 | 13F | Pinnacle Holdings, LLC | 645 | -36.20 | 56 | -29.49 | ||||
| 2025-05-14 | 13F | Peak6 Llc | Call | 0 | -100.00 | 0 | -100.00 | |||
| 2025-08-14 | 13F | Royal Bank Of Canada | 301 | 34.98 | 26 | 52.94 | ||||
| 2025-05-16 | 13F | Coppell Advisory Solutions LLC | 0 | -100.00 | 0 | |||||
| 2025-08-12 | 13F | CIBC Private Wealth Group, LLC | 378 | 26.00 | 33 | 68.42 | ||||
| 2025-08-14 | 13F | No Street GP LP | 250,000 | 0.00 | 21,560 | 10.52 | ||||
| 2025-05-05 | 13F | Eagle Bay Advisors LLC | 0 | -100.00 | 0 | -100.00 | ||||
| 2025-08-14 | 13F | Citadel Advisors Llc | Put | 3,800 | 153.33 | 328 | 179.49 | |||
| 2025-08-14 | 13F | Balyasny Asset Management Llc | 2,921 | -94.08 | 252 | -93.48 | ||||
| 2025-08-14 | 13F | Bnp Paribas Arbitrage, Sa | 40,729 | 46.51 | 3,512 | 61.92 | ||||
| 2025-08-14 | 13F | Citadel Advisors Llc | 5,900 | -56.87 | 509 | -52.39 | ||||
| 2025-08-14 | 13F | Citadel Advisors Llc | Call | 24,500 | 6.06 | 2,113 | 17.20 | |||
| 2025-07-22 | 13F | Gsa Capital Partners Llp | 8,430 | 1 | ||||||
| 2025-08-08 | 13F | Fiera Capital Corp | 15,857 | 0.00 | 1,368 | 10.51 | ||||
| 2025-08-12 | 13F | O'shaughnessy Asset Management, Llc | 4,599 | -60.37 | 397 | -56.24 | ||||
| 2025-08-15 | 13F | Ion Asset Management Ltd. | 654,308 | 15.46 | 56,428 | 27.61 | ||||
| 2025-08-07 | 13F | Campbell & CO Investment Adviser LLC | 14,104 | -4.61 | 1,216 | 5.46 |
Other Listings
| DE:DVW1 | € 80.05 |