Mga Batayang Estadistika
| Pemilik Institusional | 186 total, 185 long only, 0 short only, 1 long/short - change of 8.09% MRQ |
| Alokasi Portofolio Rata-rata | 0.2574 % - change of -11.24% MRQ |
| Saham Institusional (Jangka Panjang) | 33,813,542 (ex 13D/G) - change of 1.68MM shares 5.24% MRQ |
| Nilai Institusional (Jangka Panjang) | $ 859,496 USD ($1000) |
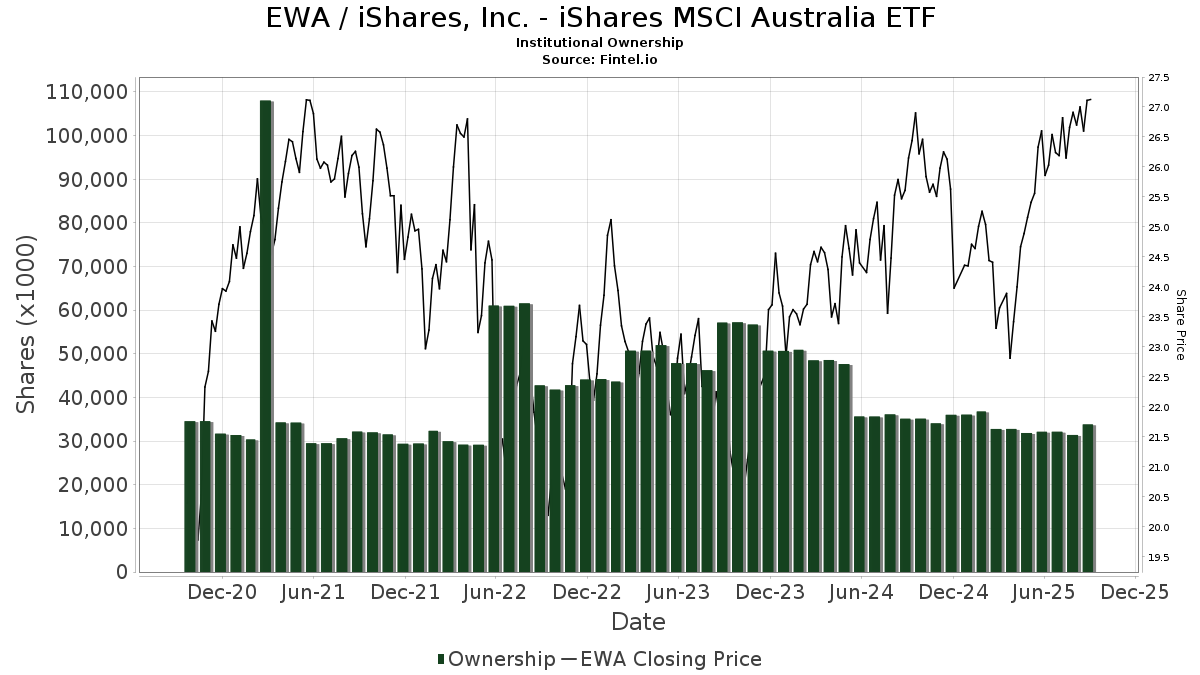
Kepemilikan Institusional dan Pemegang Saham
iShares, Inc. - iShares MSCI Australia ETF (US:EWA) memiliki 186 pemilik institusional dan pemegang saham yang telah mengajukan formulir 13D/G atau 13F kepada Komisi Bursa Efek (Securities Exchange Commission/SEC). Lembaga-lembaga ini memegang total 33,813,542 saham. Pemegang saham terbesar meliputi Fmr Llc, FILFX - Strategic Advisers International Fund, Goldman Sachs Group Inc, Allspring Global Investments Holdings, LLC, FIL Ltd, Hsbc Holdings Plc, BlackRock, Inc., Susquehanna International Group, Llp, Citadel Advisors Llc, and Vontobel Holding Ltd. .
Struktur kepemilikan institusional iShares, Inc. - iShares MSCI Australia ETF (ARCA:EWA) menunjukkan posisi terkini di perusahaan oleh institusi dan dana, serta perubahan terbaru dalam ukuran posisi. Pemegang saham utama dapat mencakup investor individu, reksa dana, dana lindung nilai, atau institusi. Jadwal 13D menunjukkan bahwa investor memegang (atau pernah memegang) lebih dari 5% saham perusahaan dan bermaksud (atau pernah bermaksud) untuk secara aktif mengejar perubahan strategi bisnis. Jadwal 13G menunjukkan investasi pasif lebih dari 5%.
The share price as of September 5, 2025 is 26.93 / share. Previously, on September 9, 2024, the share price was 25.56 / share. This represents an increase of 5.36% over that period.
Skor Sentimen Dana
Skor Sentimen Dana (sebelumnya dikenal sebagai Skor Akumulasi Kepemilikan) menemukan saham-saham yang paling banyak dibeli oleh dana. Ini adalah hasil dari model kuantitatif multi-faktor yang canggih yang mengidentifikasi perusahaan dengan tingkat akumulasi institusional tertinggi. Model penilaian menggunakan kombinasi dari total peningkatan pemilik yang diungkapkan, perubahan dalam alokasi portofolio pada pemilik tersebut, dan metrik lainnya. Angka berkisar dari 0 hingga 100, dengan angka yang lebih tinggi menunjukkan tingkat akumulasi yang lebih tinggi dibandingkan dengan perusahaan sejenisnya, dan 50 adalah rata-ratanya.
Frekuensi Pembaruan: Setiap Hari
Lihat Ownership Explorer, yang menyediakan daftar perusahaan dengan peringkat tertinggi.
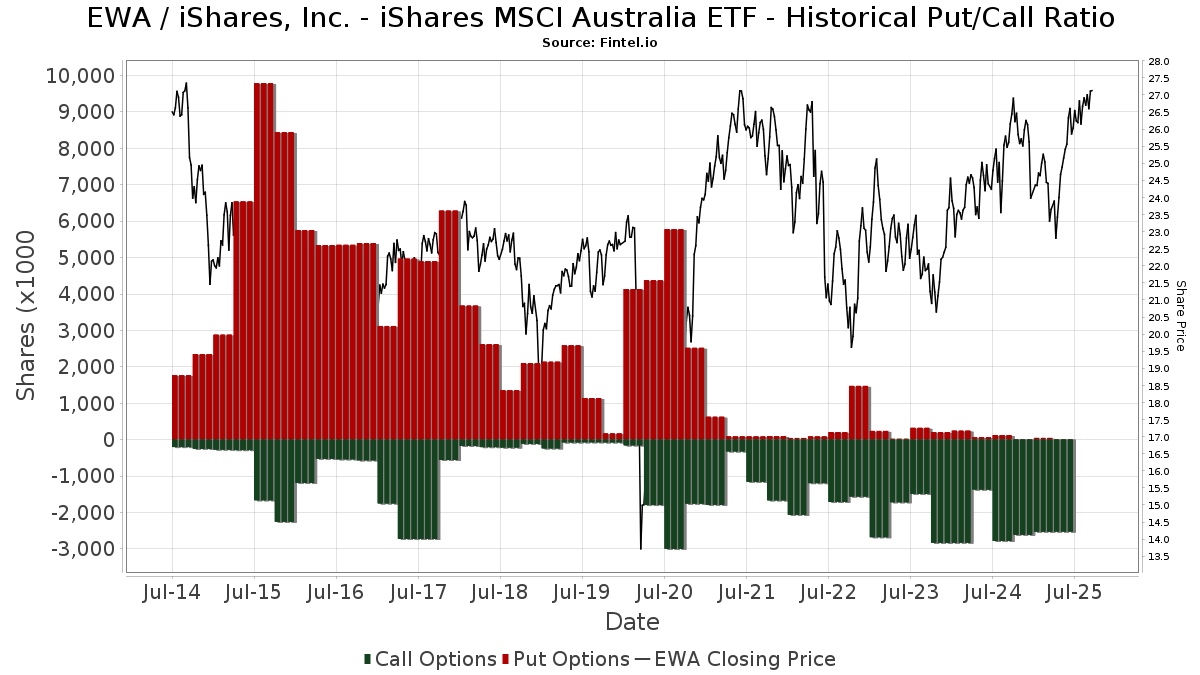
Rasio Put/Call Institusional
Selain melaporkan isu ekuitas dan utang standar, institusi dengan aset di bawah manajemen lebih dari 100 juta dolar AS juga harus mengungkapkan kepemilikan opsi put dan call mereka. Karena opsi put umumnya menunjukkan sentimen negatif, dan opsi call menunjukkan sentimen positif, kita dapat mengetahui sentimen institusional secara keseluruhan dengan memplot rasio put terhadap call. Grafik di sebelah kanan memplot rasio put/call historis untuk instrumen ini.
Menggunakan Rasio Put/Call sebagai indikator sentimen investor mengatasi salah satu kekurangan utama dari penggunaan total kepemilikan institusional, yaitu sejumlah besar aset yang dikelola diinvestasikan secara pasif untuk melacak indeks. Dana yang dikelola secara pasif biasanya tidak membeli opsi, sehingga indikator rasio put/call lebih akurat dalam melacak sentimen dana yang dikelola secara aktif.
Pengajuan 13D/G
Kami menyajikan pengajuan 13D/G secara terpisah dari pengajuan 13F karena perlakuan yang berbeda oleh SEC. Pengajuan 13D/G dapat diajukan oleh kelompok investor (dengan satu pemimpin), sedangkan pengajuan 13F tidak bisa. Hal ini mengakibatkan situasi di mana seorang investor dapat mengajukan 13D/G yang melaporkan satu nilai untuk total saham (mewakili semua saham yang dimiliki oleh kelompok investor), tetapi kemudian mengajukan 13F yang melaporkan nilai yang berbeda untuk total saham (mewakili kepemilikan mereka sendiri). Ini berarti bahwa kepemilikan saham dari pengajuan 13D/G dan pengajuan 13F seringkali tidak dapat dibandingkan secara langsung, sehingga kami menyajikannya secara terpisah.
Catatan: Mulai 16 Mei 2021, kami tidak lagi menampilkan pemilik yang belum mengajukan 13D/G dalam setahun terakhir. Sebelumnya, kami menampilkan riwayat lengkap pengajuan 13D/G. Secara umum, entitas yang diwajibkan untuk mengajukan pengajuan 13D/G harus mengajukan setidaknya setiap tahun sebelum mengirimkan pengajuan penutupan. Namun, terkadang dana keluar dari posisi tanpa mengirimkan pengajuan penutupan (misalnya, mereka menghentikan operasi), sehingga menampilkan riwayat lengkap terkadang menyebabkan kebingungan tentang kepemilikan saat ini. Untuk mencegah kebingungan, kami sekarang hanya menampilkan pemilik 'saat ini' - yaitu - pemilik yang telah mengajukan dalam setahun terakhir.
Upgrade to unlock premium data.
Pengajuan 13F dan NPORT
Detail pada pengajuan 13F tersedia gratis. Detail pada pengajuan NP memerlukan keanggotaan premium. Baris berwarna hijau menunjukkan posisi baru. Baris berwarna merah menunjukkan posisi yang sudah ditutup. Klik tautan ini ikon untuk melihat riwayat transaksi selengkapnya.
Tingkatkan
untuk membuka data premium dan mengekspor ke Excel ![]() .
.
| Tanggal File | Sumber | Investor | Ketik | Presyo ng Avg (Silangan) |
Saham | Δ Saham (%) |
Dilaporkan Nilai ($1000) |
Nilai Δ (%) |
Alokasi Port (%) |
|
|---|---|---|---|---|---|---|---|---|---|---|
| 2025-08-12 | 13F | Coston, McIsaac & Partners | 84 | 0.00 | 0 | |||||
| 2025-08-12 | 13F | Zacks Investment Management | 34,850 | -50.52 | 917 | -44.46 | ||||
| 2025-04-21 | 13F | Janney Capital Management LLC | 0 | -100.00 | 0 | |||||
| 2025-08-12 | 13F | MAI Capital Management | 2,952 | 0.07 | 78 | 11.59 | ||||
| 2025-08-14 | 13F | Hilltop Holdings Inc. | 60,359 | 1,589 | ||||||
| 2025-08-12 | 13F | O'shaughnessy Asset Management, Llc | 423 | -22.53 | 11 | -8.33 | ||||
| 2025-08-28 | NP | Northern Lights Fund Trust - Sierra Tactical Risk Spectrum 30 Fund Instl Class | 43,100 | 1,134 | ||||||
| 2025-09-04 | 13F/A | Advisor Group Holdings, Inc. | 31,356 | 344.14 | 825 | 400.00 | ||||
| 2025-08-05 | 13F | GHP Investment Advisors, Inc. | 3,300 | 0.00 | 87 | 11.69 | ||||
| 2025-08-14 | 13F | Fmr Llc | 10,005,259 | -0.00 | 263,338 | 12.29 | ||||
| 2025-07-24 | 13F | Us Bancorp \de\ | 905 | 0.00 | 24 | 9.52 | ||||
| 2025-08-28 | NP | DMCY - DEMOCRACY INTERNATIONAL FUND Shares | 19,625 | 22.82 | 517 | 37.97 | ||||
| 2025-08-28 | NP | SIRAX - Sierra Tactical All Asset Fund Class A | 186,900 | 4,919 | ||||||
| 2025-07-16 | 13F | Independent Wealth Network Inc. | 28,442 | 0.73 | 749 | 13.16 | ||||
| 2025-03-26 | NP | Arrow Investments Trust - Arrow DWA Country Rotation ETF | 22,877 | 563 | ||||||
| 2025-07-18 | 13F | BOCHK Asset Management Ltd | 8,000 | 211 | ||||||
| 2025-08-08 | 13F | MTM Investment Management, LLC | 222 | 6 | ||||||
| 2025-05-15 | 13F | Crestline Management, LP | 0 | -100.00 | 0 | -100.00 | ||||
| 2025-08-12 | 13F | Global Retirement Partners, LLC | 7,721 | 39.44 | 203 | 53.79 | ||||
| 2025-08-14 | 13F | Quantinno Capital Management LP | 23,666 | 2.85 | 623 | 15.40 | ||||
| 2025-08-14 | 13F | DZ BANK AG Deutsche Zentral Genossenschafts Bank, Frankfurt am Main | 24,125 | -86.84 | 635 | -85.24 | ||||
| 2025-08-05 | 13F | Huntington National Bank | 4 | 33.33 | ||||||
| 2025-07-23 | 13F | Spectrum Asset Management, Inc. (NB/CA) | 68,692 | 1,808 | ||||||
| 2025-07-18 | 13F | Union Bancaire Privee, UBP SA | 13,120 | 0.00 | 342 | 11.40 | ||||
| 2025-07-10 | 13F | Exchange Traded Concepts, Llc | 2,469 | 65 | ||||||
| 2025-08-06 | 13F | Innealta Capital, Llc | 0 | -100.00 | 0 | |||||
| 2025-08-06 | 13F | Commonwealth Equity Services, Llc | 0 | -100.00 | 0 | |||||
| 2025-08-14 | 13F/A | Barclays Plc | 28,210 | 22.04 | 1 | |||||
| 2025-07-22 | 13F | Rockingstone Advisors LLC | 8,502 | -0.70 | 224 | 11.50 | ||||
| 2025-08-07 | 13F | Nwam Llc | 16,381 | 428 | ||||||
| 2025-08-28 | NP | Northern Lights Fund Trust - Sierra Tactical Risk Spectrum 70 Fund Investor Class | 37,200 | 979 | ||||||
| 2025-07-24 | 13F | Blair William & Co/il | 2,448 | 0.00 | 64 | 12.28 | ||||
| 2025-08-06 | 13F | AE Wealth Management LLC | 145 | 0.00 | 4 | 0.00 | ||||
| 2025-08-12 | 13F | Picton Mahoney Asset Management | 4,430 | -15.94 | 0 | |||||
| 2025-07-23 | 13F | Viewpoint Capital Management LLC | 8,495 | 0.00 | 224 | 12.06 | ||||
| 2025-07-31 | 13F | Catalyst Capital Advisors LLC | 776,099 | -7.29 | 20,427 | 4.10 | ||||
| 2025-08-07 | 13F | Acadian Asset Management Llc | 427,970 | -1.95 | 11 | 10.00 | ||||
| 2025-07-28 | 13F | Td Asset Management Inc | 109,113 | 6.40 | 2,872 | 19.48 | ||||
| 2025-07-08 | 13F | Zrc Wealth Management, Llc | 1,912 | 1.54 | 50 | 13.64 | ||||
| 2025-08-08 | 13F | Tiemann Investment Advisors, Llc | 8,033 | -3.60 | 211 | 8.21 | ||||
| 2025-08-11 | 13F | HighTower Advisors, LLC | 267,130 | 23.86 | 7,031 | 39.07 | ||||
| 2025-08-14 | 13F | Stifel Financial Corp | 52,951 | 1.81 | 1,394 | 14.27 | ||||
| 2025-08-12 | 13F | LPL Financial LLC | 359,760 | 115.80 | 9,469 | 142.33 | ||||
| 2025-08-01 | 13F | Twin Lakes Capital Management, LLC | 1,923 | 0.00 | 51 | 11.11 | ||||
| 2025-08-14 | 13F | Raymond James Financial Inc | 778,558 | 3,134.02 | 20,492 | 3,533.16 | ||||
| 2025-05-13 | 13F | HighTower Advisors, LLC | Call | 0 | -100.00 | 0 | ||||
| 2025-08-18 | 13F | Geneos Wealth Management Inc. | 57,963 | 11,492.60 | 1,526 | 13,763.64 | ||||
| 2025-05-09 | 13F | Pathway Financial Advisers, LLC | 0 | -100.00 | 0 | -100.00 | ||||
| 2025-08-14 | 13F | Royal Bank Of Canada | 158,984 | 32.89 | 4,184 | 49.16 | ||||
| 2025-07-28 | 13F | Harbour Investments, Inc. | 507 | 692.19 | 13 | 1,200.00 | ||||
| 2025-08-08 | 13F | SG Americas Securities, LLC | 20,552 | 41.55 | 1 | |||||
| 2025-08-14 | 13F | D. E. Shaw & Co., Inc. | 61,955 | -54.88 | 1,631 | -49.35 | ||||
| 2025-08-12 | 13F | Prudential Plc | 24,092 | -79.76 | 634 | -77.27 | ||||
| 2025-08-14 | 13F | Ameriprise Financial Inc | 158,427 | 1,145.89 | 4,169 | 1,298.99 | ||||
| 2025-07-21 | 13F | Mirae Asset Global Investments Co., Ltd. | 312,532 | 10.14 | 8,226 | 23.50 | ||||
| 2025-08-14 | 13F | Moneda S.A. Administradora General de Fondos | 31,006 | 45.32 | 816 | 63.20 | ||||
| 2025-07-23 | 13F | Kingswood Wealth Advisors, Llc | 11,375 | 0.00 | 299 | 12.41 | ||||
| 2025-07-25 | 13F | Griffin Asset Management, Inc. | 8,341 | 220 | ||||||
| 2025-08-13 | 13F | Global Endowment Management, LP | 40,000 | 0.00 | 1,053 | 12.27 | ||||
| 2025-06-26 | NP | BlackRock ETF Trust - iShares International Country Rotation Active ETF | 9,685 | -14.10 | 239 | -14.08 | ||||
| 2025-08-14 | 13F | CoreCap Advisors, LLC | 548 | 0.00 | 14 | 16.67 | ||||
| 2025-06-26 | NP | SSXU - Day Hagan/Ned Davis Research Smart Sector International ETF | 71,038 | 7.65 | 1,753 | 7.95 | ||||
| 2025-08-12 | 13F | Wayfinding Financial, LLC | 0 | -100.00 | 0 | |||||
| 2025-08-08 | 13F | Banco Bilbao Vizcaya Argentaria, S.a. | 10,361 | -14.45 | 272 | -4.23 | ||||
| 2025-07-29 | 13F | Stephens Inc /ar/ | 7,610 | 200 | ||||||
| 2025-05-02 | 13F | Wealthfront Advisers Llc | 0 | -100.00 | 0 | -100.00 | ||||
| 2025-07-18 | 13F | Founders Capital Management | 35 | 0.00 | 1 | |||||
| 2025-08-15 | 13F | Equitable Holdings, Inc. | 61,713 | -6.09 | 1,624 | 5.45 | ||||
| 2025-08-12 | 13F | Palisades Hudson Asset Management, L.P. | 196,097 | 1.95 | 5 | 25.00 | ||||
| 2025-08-12 | 13F | PSI Advisors, LLC | 0 | -100.00 | 0 | |||||
| 2025-07-23 | 13F | Trifecta Capital Advisors, LLC | 0 | -100.00 | 0 | |||||
| 2025-08-15 | 13F | Kestra Advisory Services, LLC | 11,735 | 8.82 | 309 | -75.44 | ||||
| 2025-05-14 | 13F | Flow Traders U.s. Llc | 0 | -100.00 | 0 | -100.00 | ||||
| 2025-05-19 | 13F | Ubs Asset Management Americas Inc | 0 | -100.00 | 0 | |||||
| 2025-07-10 | 13F | Wealth Enhancement Advisory Services, Llc | 0 | -100.00 | 0 | |||||
| 2025-08-13 | 13F | Lido Advisors, LLC | 75,026 | 1,975 | ||||||
| 2025-08-05 | 13F | Castlekeep Investment Advisors Llc | 15,074 | -3.22 | 397 | 8.49 | ||||
| 2025-07-11 | 13F | Adirondack Trust Co | 0 | -100.00 | 0 | |||||
| 2025-08-08 | 13F | Hartland & Co., LLC | 2,520 | 0.00 | 66 | 11.86 | ||||
| 2025-08-15 | 13F | Koesten, Hirschmann & Crabtree, INC. | 139 | 4 | ||||||
| 2025-08-08 | 13F | Cetera Investment Advisers | 77,152 | 697.77 | 2,031 | 798.23 | ||||
| 2025-08-13 | 13F | Bank Of Nova Scotia | 384,800 | 10,128 | ||||||
| 2025-04-25 | 13F | Tradewinds Capital Management, LLC | 0 | -100.00 | 0 | |||||
| 2025-07-29 | 13F | Millburn Ridgefield Corp | 776,099 | -7.29 | 20,427 | 4.10 | ||||
| 2025-08-14 | 13F | Comerica Bank | 5,067 | 39.70 | 133 | 56.47 | ||||
| 2025-08-14 | 13F | Bank Of America Corp /de/ | 211,467 | -58.40 | 5,566 | -53.29 | ||||
| 2025-08-11 | 13F | TD Waterhouse Canada Inc. | 109,543 | 6.81 | 2,884 | 18.98 | ||||
| 2025-08-08 | 13F | Gts Securities Llc | 0 | -100.00 | 0 | |||||
| 2025-07-29 | 13F | Private Trust Co Na | 2,912 | 5,842.86 | 77 | 7,500.00 | ||||
| 2025-08-14 | 13F | DC Investments Management, LLC | 0 | -100.00 | 0 | |||||
| 2025-07-15 | 13F | Gunma Bank,Ltd. | 260,000 | 0.00 | 7 | 0.00 | ||||
| 2025-08-13 | 13F | Mount Yale Investment Advisors, LLC | 249 | 7 | ||||||
| 2025-08-15 | 13F | CI Private Wealth, LLC | 11,419 | -11.28 | 301 | -0.33 | ||||
| 2025-08-27 | 13F/A | Squarepoint Ops LLC | 61,875 | 1,629 | ||||||
| 2025-07-24 | 13F | Ronald Blue Trust, Inc. | 5,420 | -51.74 | 143 | -46.01 | ||||
| 2025-08-06 | 13F | Modera Wealth Management, LLC | 8,348 | 220 | ||||||
| 2025-07-17 | 13F | Albion Financial Group /ut | 33,155 | 0.00 | 873 | 12.23 | ||||
| 2025-07-29 | 13F | Stratos Wealth Advisors, LLC | 233,063 | 5.15 | 6,134 | 18.08 | ||||
| 2025-05-15 | 13F | Wolverine Trading, Llc | Call | 0 | -100.00 | 0 | -100.00 | |||
| 2025-04-29 | 13F | Wood Tarver Financial Group, LLC | 0 | -100.00 | 0 | |||||
| 2025-08-12 | 13F | Atlas Capital Advisors Llc | 0 | -100.00 | 0 | |||||
| 2025-05-08 | 13F | Banque Cantonale Vaudoise | 0 | -100.00 | 0 | |||||
| 2025-07-14 | 13F | Sentinel Pension Advisors Inc | 148,500 | 0.00 | 3,909 | 12.30 | ||||
| 2025-08-14 | 13F | Vident Advisory, LLC | 19,625 | 22.82 | 517 | 37.97 | ||||
| 2025-08-14 | 13F | Two Sigma Securities, Llc | 28,376 | 747 | ||||||
| 2025-08-12 | 13F | Laurel Wealth Advisors LLC | 72,324 | 2,531.88 | 3 | -96.87 | ||||
| 2025-08-14 | 13F | Arizona PSPRS Trust | 0 | -100.00 | 0 | |||||
| 2025-08-05 | 13F | Gould Asset Management Llc /ca/ | 10,560 | 1.64 | 278 | 13.99 | ||||
| 2025-08-13 | 13F | BCJ Capital Management, LLC | 15,350 | 404 | ||||||
| 2025-08-12 | 13F | CIBC Private Wealth Group, LLC | 8,500 | 0.00 | 224 | 26.70 | ||||
| 2025-08-14 | 13F | Citadel Advisors Llc | Call | 1,227,100 | 3,687.35 | 32,297 | 4,155.20 | |||
| 2025-05-14 | 13F | Toroso Investments, LLC | 0 | -100.00 | 0 | -100.00 | ||||
| 2025-08-14 | 13F | Citadel Advisors Llc | 13,032 | -61.70 | 343 | -56.96 | ||||
| 2025-08-14 | 13F | Citadel Advisors Llc | Put | 11,700 | -70.23 | 308 | -66.67 | |||
| 2025-08-12 | 13F | Jpmorgan Chase & Co | 62,909 | -78.93 | 1,656 | -76.35 | ||||
| 2025-08-13 | 13F | Avos Capital Management, LLC | 10,903 | 287 | ||||||
| 2025-08-14 | 13F | Coppell Advisory Solutions LLC | 0 | -100.00 | 0 | |||||
| 2025-07-25 | 13F | Cwm, Llc | 693 | -59.78 | 0 | |||||
| 2025-08-13 | 13F | Amundi | 11,415 | -90.05 | 303 | -88.67 | ||||
| 2025-05-01 | 13F | Oxbow Advisors, LLC | 0 | -100.00 | 0 | -100.00 | ||||
| 2025-08-08 | 13F | Pnc Financial Services Group, Inc. | 800 | 0.00 | 21 | 16.67 | ||||
| 2025-08-11 | 13F | Principal Securities, Inc. | 37 | -56.98 | 1 | -100.00 | ||||
| 2025-08-14 | 13F | DRW Securities, LLC | 30,094 | -49.92 | 792 | -43.75 | ||||
| 2025-08-14 | 13F | Bnp Paribas Arbitrage, Sa | 1,972 | -94.18 | 52 | -93.58 | ||||
| 2025-08-12 | 13F | Pathstone Holdings, LLC | 0 | -100.00 | 0 | |||||
| 2025-08-14 | 13F | Susquehanna International Group, Llp | Call | 1,234,100 | 11,766.35 | 32,482 | 13,266.67 | |||
| 2025-08-11 | 13F | Citigroup Inc | 41,614 | -71.42 | 1,095 | -67.91 | ||||
| 2025-08-14 | 13F | Susquehanna International Group, Llp | 23,753 | -71.61 | 625 | -68.13 | ||||
| 2025-08-14 | 13F | McIlrath & Eck, LLC | 125 | 0.00 | 3 | 50.00 | ||||
| 2025-04-17 | 13F | Columbus Macro, LLC | 0 | -100.00 | 0 | |||||
| 2025-08-13 | 13F | Fisher Asset Management, LLC | 129,527 | 3,409 | ||||||
| 2025-08-12 | 13F | SRS Capital Advisors, Inc. | 66 | 0.00 | 2 | 0.00 | ||||
| 2025-08-29 | NP | MBXAX - Catalyst/Millburn Hedge Strategy Fund Class A | 776,099 | -7.29 | 20,427 | 4.10 | ||||
| 2025-08-13 | 13F | Rsm Us Wealth Management Llc | 19,937 | 0.27 | 525 | 12.45 | ||||
| 2025-08-14 | 13F | Old Mission Capital Llc | 102,590 | -63.93 | 2,700 | -59.50 | ||||
| 2025-07-21 | 13F | Ping Capital Management, Inc. | 0 | -100.00 | 0 | |||||
| 2025-08-08 | 13F | Family Firm, Inc. | 13,043 | 4.93 | 343 | 17.87 | ||||
| 2025-08-01 | 13F | Envestnet Asset Management Inc | 59,001 | 48.25 | 1,553 | 66.52 | ||||
| 2025-08-15 | 13F | Tower Research Capital LLC (TRC) | 1,565 | 10,333.33 | 41 | |||||
| 2025-08-14 | 13F | Sunbelt Securities, Inc. | 200 | 0.00 | 5 | 0.00 | ||||
| 2025-07-23 | 13F | REAP Financial Group, LLC | 416 | 1.46 | 11 | 11.11 | ||||
| 2025-08-14 | 13F | UBS Group AG | Call | 11,310 | 298 | |||||
| 2025-05-09 | 13F | Scotia Capital Inc. | 0 | -100.00 | 0 | -100.00 | ||||
| 2025-08-14 | 13F | UBS Group AG | 461,249 | -42.49 | 12,140 | -35.43 | ||||
| 2025-08-14 | 13F | Federation des caisses Desjardins du Quebec | 17,757 | -42.06 | 467 | -34.96 | ||||
| 2025-08-14 | 13F | CIBC Asset Management Inc | 16,979 | -14.74 | 447 | -4.29 | ||||
| 2025-05-13 | 13F | Horizon Investments, LLC | 0 | -100.00 | 0 | |||||
| 2025-08-07 | 13F | CENTRAL TRUST Co | 1,640 | 0.00 | 43 | 13.16 | ||||
| 2025-08-13 | 13F | Idaho Trust Bank | 57,278 | -5.40 | 1,507 | 6.21 | ||||
| 2025-08-14 | 13F | Jane Street Group, Llc | 788,118 | 20,743 | ||||||
| 2025-08-14 | 13F | Headlands Technologies LLC | 0 | -100.00 | 0 | -100.00 | ||||
| 2025-08-14 | 13F | Barometer Capital Management Inc. | 11,900 | 313 | ||||||
| 2025-04-30 | 13F | Pekin Hardy Strauss, Inc. | 0 | -100.00 | 0 | -100.00 | ||||
| 2025-08-13 | 13F | Hsbc Holdings Plc | 1,467,858 | -15.91 | 38,634 | -5.57 | ||||
| 2025-08-13 | 13F | Jones Financial Companies Lllp | 563 | 6.03 | 15 | 16.67 | ||||
| 2025-07-28 | 13F | Mutual Advisors, LLC | 44,154 | 1,169 | ||||||
| 2025-07-30 | 13F | Whittier Trust Co | 1,229 | 0.00 | 32 | 14.29 | ||||
| 2025-08-13 | 13F | Mackenzie Financial Corp | 0 | -100.00 | 0 | |||||
| 2025-08-14 | 13F | Prelude Capital Management, Llc | 7,816 | 206 | ||||||
| 2025-08-14 | 13F | Parallax Volatility Advisers, L.P. | 0 | -100.00 | 0 | |||||
| 2025-07-25 | 13F | Allspring Global Investments Holdings, LLC | 2,482,490 | -2.87 | 65,339 | 9.06 | ||||
| 2025-08-11 | 13F | Hexagon Capital Partners LLC | 0 | -100.00 | 0 | |||||
| 2025-05-15 | 13F | Wiley Bros.-aintree Capital, Llc | 0 | -100.00 | 0 | -100.00 | ||||
| 2025-08-04 | 13F | Assetmark, Inc | 10 | 0.00 | 0 | |||||
| 2025-08-19 | 13F | Slocum, Gordon & Co LLP | 48,891 | -1.73 | 1,287 | 10.29 | ||||
| 2025-08-08 | 13F | Flaharty Asset Management, LLC | 340 | 0.00 | 9 | 14.29 | ||||
| 2025-08-05 | 13F | Simplex Trading, Llc | 2,723 | 0 | ||||||
| 2025-08-15 | 13F | Morgan Stanley | 781,482 | -13.72 | 20,569 | -3.11 | ||||
| 2025-05-15 | 13F | Logan Stone Capital, LLC | 0 | -100.00 | 0 | |||||
| 2025-08-12 | 13F | BlackRock, Inc. | 1,252,943 | 118.68 | 32,977 | 145.57 | ||||
| 2025-07-23 | 13F | Vontobel Holding Ltd. | 872,856 | -2.18 | 22,974 | 9.84 | ||||
| 2025-08-25 | 13F/A | Promus Capital, LLC | 14,792 | 1.53 | 389 | 14.08 | ||||
| 2025-08-14 | 13F | Murphy & Mullick Capital Management Corp | 217 | 0.00 | 6 | 0.00 | ||||
| 2025-07-14 | 13F | Pacifica Partners Inc. | 1,000 | 0.00 | 26 | 13.04 | ||||
| 2025-08-26 | NP | EQ ADVISORS TRUST - EQ/International Core Managed Volatility Portfolio Class IB | 61,615 | -6.10 | 1,622 | 5.40 | ||||
| 2025-07-16 | 13F | Highline Wealth Partners Llc | 700 | 18 | ||||||
| 2025-08-14 | 13F | Wellington Management Group Llp | 32,902 | 866 | ||||||
| 2025-07-23 | 13F | WESPAC Advisors, LLC | 0 | -100.00 | 0 | |||||
| 2025-07-30 | 13F | Phillips Financial Management, Llc | 775 | 0.00 | 20 | 11.11 | ||||
| 2025-04-17 | 13F | Factory Mutual Insurance Co | 0 | -100.00 | 0 | -100.00 | ||||
| 2025-08-13 | 13F | Invesco Ltd. | 10,152 | -67.20 | 267 | -63.17 | ||||
| 2025-08-14 | 13F | Silvercrest Asset Management Group Llc | 7,771 | 205 | ||||||
| 2025-07-15 | 13F | GSB Wealth Management, LLC | 27,784 | -24.32 | 731 | -15.00 | ||||
| 2025-07-11 | 13F | Arrow Investment Advisors, LLC | 0 | -100.00 | 0 | |||||
| 2025-08-14 | 13F | Susquehanna International Group, Llp | Put | 0 | -100.00 | 0 | ||||
| 2025-08-14 | 13F | Wells Fargo & Company/mn | 195,667 | -53.98 | 5,150 | -48.33 | ||||
| 2025-04-29 | NP | WOAIX - WOA All Asset I Class I | 10,439 | -29.47 | 250 | -36.06 | ||||
| 2025-08-28 | NP | ICCIX - Dynamic International Opportunity Fund Class I | 5,172 | -85.38 | 136 | -83.57 | ||||
| 2025-07-10 | 13F | Polianta Ltd | 0 | -100.00 | 0 | |||||
| 2025-08-12 | 13F | Proequities, Inc. | 0 | 0 | ||||||
| 2025-08-28 | NP | Northern Lights Fund Trust - Sierra Tactical Core Growth Fund Investor Class Shares | 7,642 | 201 | ||||||
| 2025-07-22 | 13F | 4Thought Financial Group Inc. | 570 | 2.52 | 15 | 15.38 | ||||
| 2025-07-31 | 13F | Nisa Investment Advisors, Llc | 15,300 | 0.00 | 403 | 12.29 | ||||
| 2025-08-01 | 13F | Solstein Capital, LLC | 16,409 | 0.00 | 432 | 12.24 | ||||
| 2025-08-14 | 13F | GWM Advisors LLC | 18,851 | 496 | ||||||
| 2025-08-08 | 13F | Creative Planning | 72,156 | 17.70 | 1,899 | 32.24 | ||||
| 2025-07-14 | 13F | Painted Porch Advisors LLC | 98 | 7.69 | 3 | 0.00 | ||||
| 2025-08-01 | 13F | Banco Santander, S.A. | 10,943 | 1.02 | 288 | 13.83 | ||||
| 2025-08-13 | 13F | Schroder Investment Management Group | 40,863 | -52.13 | 1,066 | -46.78 | ||||
| 2025-08-14 | 13F | Evergreen Capital Management Llc | 77,692 | 11.44 | 2,045 | 25.09 | ||||
| 2025-08-11 | 13F | Mount Lucas Management LP | 136,206 | 3,585 | ||||||
| 2025-05-07 | 13F | Texas Yale Capital Corp. | 0 | -100.00 | 0 | |||||
| 2025-08-11 | 13F | Ritter Daniher Financial Advisory LLC / DE | 300 | 0.00 | 8 | 0.00 | ||||
| 2025-08-13 | 13F | Russell Investments Group, Ltd. | 412 | 1.73 | 11 | 11.11 | ||||
| 2025-07-22 | 13F | Miracle Mile Advisors, LLC | 7,800 | 205 | ||||||
| 2025-08-14 | 13F | Hrt Financial Lp | 26,400 | 1 | ||||||
| 2025-08-11 | 13F | Covestor Ltd | 19 | 0.00 | 0 | |||||
| 2025-07-24 | 13F | Acima Private Wealth, Llc | 48,245 | -1.75 | 1,270 | 10.35 | ||||
| 2025-08-14 | 13F | Mml Investors Services, Llc | 84,328 | 23.21 | 2 | 100.00 | ||||
| 2025-08-01 | 13F | Oversea-Chinese Banking CORP Ltd | 8,600 | 0.00 | 226 | 12.44 | ||||
| 2025-07-30 | NP | FILFX - Strategic Advisers International Fund This fund is a listed as child fund of Fmr Llc and if that institution has disclosed ownership in this security, then these positions will not be double counted when calculating total shares and total value | 10,001,860 | 0.00 | 258,148 | 7.59 | ||||
| 2025-08-14 | 13F | Millennium Management Llc | 0 | -100.00 | 0 | |||||
| 2025-08-07 | 13F | Laffer Investments | 10,136 | 13.77 | 267 | 27.88 | ||||
| 2025-08-12 | 13F | Steward Partners Investment Advisory, Llc | 1,710 | 6.94 | 45 | 21.62 | ||||
| 2025-08-13 | 13F | Cresset Asset Management, LLC | 8,397 | 221 | ||||||
| 2025-08-14 | 13F | Qube Research & Technologies Ltd | 1,126 | -99.06 | 30 | -98.97 | ||||
| 2025-08-05 | 13F | iA Global Asset Management Inc. | 10,629 | 7.56 | 0 | |||||
| 2025-07-28 | 13F | Rosenberg Matthew Hamilton | 4,575 | -1.63 | 120 | 10.09 | ||||
| 2025-07-28 | 13F | Copia Wealth Management | 10,835 | 16.90 | 285 | 31.34 | ||||
| 2025-05-15 | 13F | CAPROCK Group, Inc. | 21,727 | -3.03 | 509 | -4.68 | ||||
| 2025-08-14 | 13F | FIL Ltd | 1,942,868 | 33.36 | 51,136 | 49.75 | ||||
| 2025-07-24 | 13F | Rice Partnership, LLC | 36,130 | -57.83 | 951 | -52.69 | ||||
| 2025-05-13 | 13F | Quadrature Capital Ltd | 0 | -100.00 | 0 | -100.00 | ||||
| 2025-08-14 | 13F | Jane Street Group, Llc | Call | 46,900 | -98.11 | 1,234 | -97.88 | |||
| 2025-05-09 | 13F | Abc Arbitrage Sa | 0 | -100.00 | 0 | -100.00 | ||||
| 2025-08-04 | 13F | MeadowBrook Investment Advisors LLC | 0 | -100.00 | 0 | |||||
| 2025-08-14 | 13F | Integrated Wealth Concepts LLC | 28,942 | 762 | ||||||
| 2025-07-31 | 13F | Cambridge Investment Research Advisors, Inc. | 10,751 | 21.18 | 0 | |||||
| 2025-08-07 | 13F | Allworth Financial LP | 500 | 13 | ||||||
| 2025-08-13 | 13F | Green Harvest Asset Management LLC | 119,497 | -14.46 | 3,145 | -3.94 | ||||
| 2025-08-28 | NP | Northern Lights Fund Trust - Sierra Tactical Risk Spectrum 50 Fund Investor Class | 128,000 | 3,369 | ||||||
| 2025-08-28 | NP | Northern Lights Fund Trust - Ocean Park International ETF | 2,469 | 65 | ||||||
| 2025-08-14 | 13F | Tudor Investment Corp Et Al | 0 | -100.00 | 0 | |||||
| 2025-07-11 | 13F | Caldwell Securities, Inc | 0 | -100.00 | 0 | |||||
| 2025-08-05 | 13F | Bank Of Montreal /can/ | 12,808 | 337 | ||||||
| 2025-08-13 | 13F | 1832 Asset Management L.P. | 21,021 | 9.55 | 553 | 23.16 | ||||
| 2025-08-08 | 13F | Cedar Wealth Management, LLC | 19,067 | 0.00 | 502 | 12.33 | ||||
| 2025-08-18 | 13F | Wolverine Trading, Llc | 22,349 | 583 | ||||||
| 2025-07-28 | 13F | Lunt Capital Management, Inc. | 7,636 | 201 | ||||||
| 2025-08-14 | 13F | Goldman Sachs Group Inc | 3,491,982 | 36.65 | 91,909 | 53.44 | ||||
| 2025-07-15 | 13F | Pictet North America Advisors SA | 11,741 | 0.00 | 309 | 12.36 | ||||
| 2025-08-28 | NP | SYMIX - AlphaCentric Symmetry Strategy Fund Class I | 19,933 | 195.48 | 525 | 227.50 |