Mga Batayang Estadistika
| Pemilik Institusional | 127 total, 123 long only, 1 short only, 3 long/short - change of 2.40% MRQ |
| Alokasi Portofolio Rata-rata | 0.2807 % - change of 7.12% MRQ |
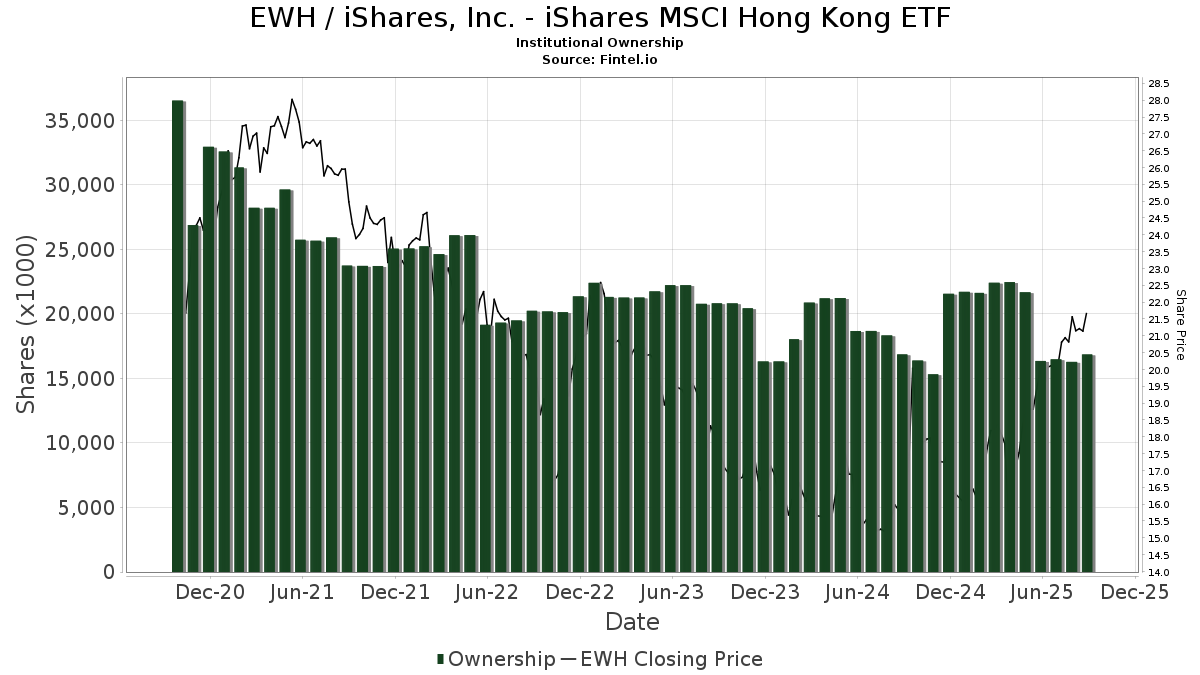
| Saham Institusional (Jangka Panjang) | 16,862,291 (ex 13D/G) - change of 0.51MM shares 3.09% MRQ |
| Nilai Institusional (Jangka Panjang) | $ 299,577 USD ($1000) |
Kepemilikan Institusional dan Pemegang Saham
iShares, Inc. - iShares MSCI Hong Kong ETF (US:EWH) memiliki 127 pemilik institusional dan pemegang saham yang telah mengajukan formulir 13D/G atau 13F kepada Komisi Bursa Efek (Securities Exchange Commission/SEC). Lembaga-lembaga ini memegang total 16,862,291 saham. Pemegang saham terbesar meliputi Wright Fund Managment, LLC, Morgan Stanley, Bank Julius Baer & Co. Ltd, Zurich, SG Americas Securities, LLC, D. E. Shaw & Co., Inc., Catalyst Capital Advisors LLC, MBXAX - Catalyst/Millburn Hedge Strategy Fund Class A, Millburn Ridgefield Corp, Northern Lights Fund Trust - Sierra Tactical Risk Spectrum 50 Fund Investor Class, and Quadrature Capital Ltd .
Struktur kepemilikan institusional iShares, Inc. - iShares MSCI Hong Kong ETF (ARCA:EWH) menunjukkan posisi terkini di perusahaan oleh institusi dan dana, serta perubahan terbaru dalam ukuran posisi. Pemegang saham utama dapat mencakup investor individu, reksa dana, dana lindung nilai, atau institusi. Jadwal 13D menunjukkan bahwa investor memegang (atau pernah memegang) lebih dari 5% saham perusahaan dan bermaksud (atau pernah bermaksud) untuk secara aktif mengejar perubahan strategi bisnis. Jadwal 13G menunjukkan investasi pasif lebih dari 5%.
The share price as of September 5, 2025 is 21.18 / share. Previously, on September 6, 2024, the share price was 15.82 / share. This represents an increase of 33.88% over that period.
Skor Sentimen Dana
Skor Sentimen Dana (sebelumnya dikenal sebagai Skor Akumulasi Kepemilikan) menemukan saham-saham yang paling banyak dibeli oleh dana. Ini adalah hasil dari model kuantitatif multi-faktor yang canggih yang mengidentifikasi perusahaan dengan tingkat akumulasi institusional tertinggi. Model penilaian menggunakan kombinasi dari total peningkatan pemilik yang diungkapkan, perubahan dalam alokasi portofolio pada pemilik tersebut, dan metrik lainnya. Angka berkisar dari 0 hingga 100, dengan angka yang lebih tinggi menunjukkan tingkat akumulasi yang lebih tinggi dibandingkan dengan perusahaan sejenisnya, dan 50 adalah rata-ratanya.
Frekuensi Pembaruan: Setiap Hari
Lihat Ownership Explorer, yang menyediakan daftar perusahaan dengan peringkat tertinggi.
Rasio Put/Call Institusional
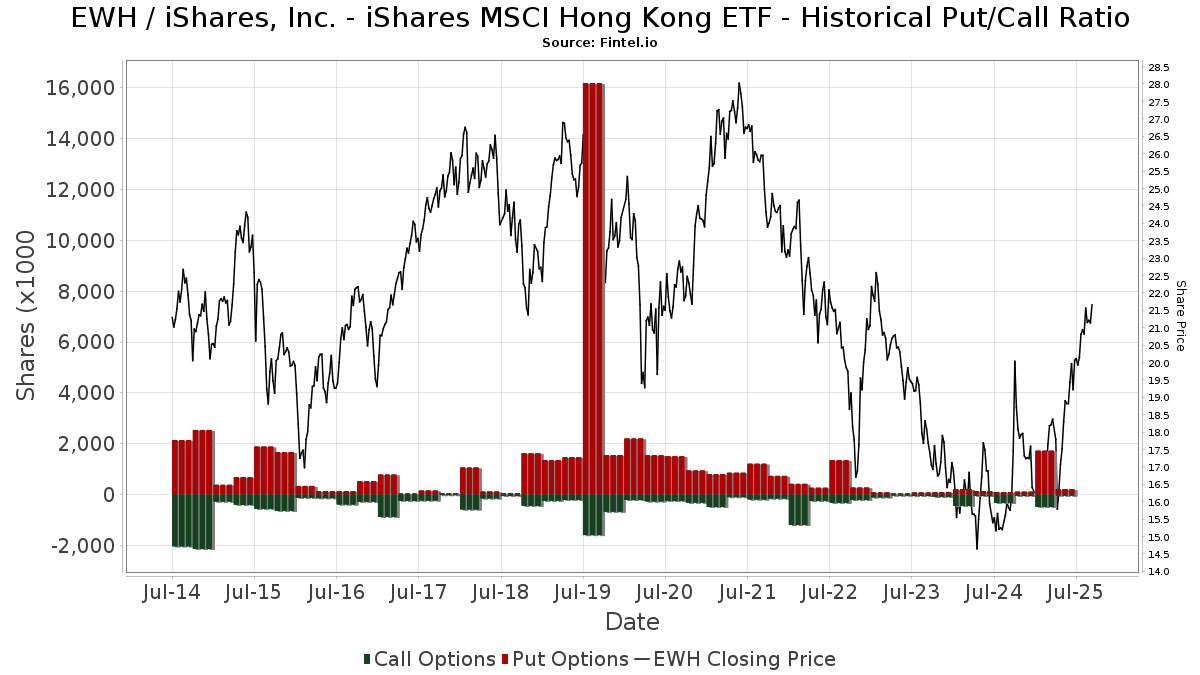
Selain melaporkan isu ekuitas dan utang standar, institusi dengan aset di bawah manajemen lebih dari 100 juta dolar AS juga harus mengungkapkan kepemilikan opsi put dan call mereka. Karena opsi put umumnya menunjukkan sentimen negatif, dan opsi call menunjukkan sentimen positif, kita dapat mengetahui sentimen institusional secara keseluruhan dengan memplot rasio put terhadap call. Grafik di sebelah kanan memplot rasio put/call historis untuk instrumen ini.
Menggunakan Rasio Put/Call sebagai indikator sentimen investor mengatasi salah satu kekurangan utama dari penggunaan total kepemilikan institusional, yaitu sejumlah besar aset yang dikelola diinvestasikan secara pasif untuk melacak indeks. Dana yang dikelola secara pasif biasanya tidak membeli opsi, sehingga indikator rasio put/call lebih akurat dalam melacak sentimen dana yang dikelola secara aktif.
Pengajuan 13F dan NPORT
Detail pada pengajuan 13F tersedia gratis. Detail pada pengajuan NP memerlukan keanggotaan premium. Baris berwarna hijau menunjukkan posisi baru. Baris berwarna merah menunjukkan posisi yang sudah ditutup. Klik tautan ini ikon untuk melihat riwayat transaksi selengkapnya.
Tingkatkan
untuk membuka data premium dan mengekspor ke Excel ![]() .
.
| Tanggal File | Sumber | Investor | Ketik | Presyo ng Avg (Silangan) |
Saham | Δ Saham (%) |
Dilaporkan Nilai ($1000) |
Nilai Δ (%) |
Alokasi Port (%) |
|
|---|---|---|---|---|---|---|---|---|---|---|
| 2025-08-12 | 13F | MAI Capital Management | 208 | 1.96 | 4 | 33.33 | ||||
| 2025-07-08 | 13F | Parallel Advisors, LLC | 500 | 0.00 | 10 | 12.50 | ||||
| 2025-08-14 | 13F | SummitTX Capital, L.P. | 11,200 | 222 | ||||||
| 2025-08-14 | 13F | Wellington Management Group Llp | 54,028 | 243.62 | 1,073 | 289.82 | ||||
| 2025-08-13 | 13F | Barclays Plc | Put | 0 | -100.00 | 0 | ||||
| 2025-07-23 | 13F | Viewpoint Capital Management LLC | 6,241 | 0.00 | 124 | 12.84 | ||||
| 2025-08-14 | 13F | Ameriprise Financial Inc | 76,862 | -60.42 | 4,229 | 24.38 | ||||
| 2025-04-16 | 13F | Wealth Enhancement Advisory Services, Llc | Put | 0 | -100.00 | 0 | ||||
| 2025-08-12 | 13F | Zacks Investment Management | 21,664 | 430 | ||||||
| 2025-08-11 | 13F | Rahlfs Capital, Llc | 11,050 | 219 | ||||||
| 2025-07-10 | 13F | Wealth Enhancement Advisory Services, Llc | 15,937 | 0.31 | 321 | 15.47 | ||||
| 2025-08-14 | 13F | Fmr Llc | 5,916 | 8.91 | 117 | 23.16 | ||||
| 2025-08-13 | 13F | Scotia Capital Inc. | 16,352 | 325 | ||||||
| 2025-08-14 | 13F | Quantitative Investment Management, LLC | 59,004 | 1 | ||||||
| 2025-08-04 | 13F | JDM Financial Group LLC | 550 | 0.00 | 11 | 11.11 | ||||
| 2025-08-06 | 13F | Pekin Hardy Strauss, Inc. | 0 | -100.00 | 0 | |||||
| 2025-03-26 | NP | MNERX - MainStay Conservative ETF Allocation Fund Class R3 | 61,191 | 9.50 | 1,010 | 1.10 | ||||
| 2025-05-29 | NP | Northern Lights Fund Trust - Sierra Tactical Risk Spectrum 70 Fund Investor Class | 152,100 | 2,663 | ||||||
| 2025-08-13 | 13F | Korea Investment CORP | 132,000 | 0.00 | 2,622 | 13.41 | ||||
| 2025-07-21 | 13F | J. Safra Sarasin Holding AG | 0 | -100.00 | 0 | |||||
| 2025-07-31 | 13F | Wright Fund Managment, LLC | 1,407,375 | 0.00 | 24,643 | 0.00 | ||||
| 2025-08-12 | 13F | Elo Mutual Pension Insurance Co | 504,498 | 0.00 | 10,019 | 13.43 | ||||
| 2025-08-05 | 13F | Huntington National Bank | 0 | |||||||
| 2025-05-29 | NP | SIRAX - Sierra Tactical All Asset Fund Class A | 517,500 | 9,061 | ||||||
| 2025-07-29 | 13F | Tradewinds Capital Management, LLC | 102 | 0.00 | 2 | 100.00 | ||||
| 2025-07-31 | 13F | Glass Jacobson Investment Advisors llc | 1,925 | 0.00 | 38 | 18.75 | ||||
| 2025-08-14 | 13F/A | Bank Julius Baer & Co. Ltd, Zurich | 1,210,055 | 24,032 | ||||||
| 2025-07-22 | 13F | Chung Wu Investment Group, LLC | 8,500 | 169 | ||||||
| 2025-07-08 | 13F/A | Salem Investment Counselors Inc | 400 | 0.00 | 8 | 0.00 | ||||
| 2025-07-31 | 13F | Sharper & Granite LLC | 82,575 | -1.19 | 1,661 | 13.47 | ||||
| 2025-08-05 | 13F | Advisors Preferred, LLC | 1,411 | 28 | ||||||
| 2025-05-14 | 13F | Flow Traders U.s. Llc | 0 | -100.00 | 0 | |||||
| 2025-08-12 | 13F | CIBC Private Wealth Group, LLC | 0 | -100.00 | 0 | |||||
| 2025-08-14 | 13F | Federation des caisses Desjardins du Quebec | 144,176 | 3,780.92 | 2,863 | 4,373.44 | ||||
| 2025-08-13 | 13F | Mount Yale Investment Advisors, LLC | 138 | 3 | ||||||
| 2025-03-26 | NP | MWFQX - MainStay Equity ETF Allocation Fund Class R3 | 129,177 | 14.38 | 2,131 | 5.60 | ||||
| 2025-05-13 | 13F | HighTower Advisors, LLC | 0 | -100.00 | 0 | |||||
| 2025-05-02 | 13F | Whittier Trust Co | 0 | -100.00 | 0 | |||||
| 2025-08-14 | 13F | UBS Group AG | 428,667 | -45.34 | 8,513 | -38.01 | ||||
| 2025-07-07 | 13F | Upper Left Wealth Management, LLC | 14,066 | 2.55 | 279 | 16.25 | ||||
| 2025-04-22 | 13F | Cambridge Investment Research Advisors, Inc. | 0 | -100.00 | 0 | |||||
| 2025-07-30 | 13F | Exencial Wealth Advisors, Llc | 46,936 | 6.80 | 932 | 21.20 | ||||
| 2025-08-13 | 13F | Provida Pension Fund Administrator | 0 | -100.00 | 0 | -100.00 | ||||
| 2025-07-31 | 13F | Catalyst Capital Advisors LLC | 646,987 | -12.03 | 12,849 | -0.23 | ||||
| 2025-08-29 | NP | MBXAX - Catalyst/Millburn Hedge Strategy Fund Class A | 646,987 | -12.03 | 12,849 | -0.23 | ||||
| 2025-08-29 | NP | CGHIX - Timber Point Global Allocations Fund Institutional Class Shares | 10,000 | -50.00 | 199 | -43.43 | ||||
| 2025-08-15 | 13F | Morgan Stanley | 1,212,315 | -14.04 | 24,077 | -2.51 | ||||
| 2025-08-12 | 13F | Picton Mahoney Asset Management | 5,970 | -21.24 | 0 | |||||
| 2025-08-14 | 13F | Royal Bank Of Canada | 117,644 | 85.41 | 2,335 | 110.17 | ||||
| 2025-07-31 | 13F | United Community Bank | 0 | -100.00 | 0 | |||||
| 2025-08-12 | 13F | BlackRock, Inc. | 42,251 | -95.07 | 839 | -94.41 | ||||
| 2025-08-13 | 13F | Hsbc Holdings Plc | 12,720 | -4.68 | 253 | 8.15 | ||||
| 2025-08-13 | 13F | National Bank Of Canada /fi/ | 0 | -100.00 | 0 | |||||
| 2025-08-12 | 13F | LPL Financial LLC | 30,307 | -55.28 | 602 | -49.33 | ||||
| 2025-08-14 | 13F | Kovitz Investment Group Partners, LLC | 94,548 | 62.56 | 1,878 | 84.38 | ||||
| 2025-06-26 | NP | SSXU - Day Hagan/Ned Davis Research Smart Sector International ETF | 128,246 | 2,247 | ||||||
| 2025-07-11 | 13F | Farther Finance Advisors, LLC | 3,600 | 0.00 | 71 | 12.70 | ||||
| 2025-09-04 | 13F/A | Advisor Group Holdings, Inc. | 16,234 | 20.02 | 323 | 36.44 | ||||
| 2025-04-22 | 13F | Moisand Fitzgerald Tamayo, LLC | 0 | -100.00 | 0 | |||||
| 2025-08-12 | 13F | Prudential Plc | 199,443 | 3,961 | ||||||
| 2025-08-13 | 13F | Walleye Trading LLC | Put | 0 | -100.00 | 0 | ||||
| 2025-08-14 | 13F | D. E. Shaw & Co., Inc. | 742,520 | 284.26 | 14,746 | 335.89 | ||||
| 2025-08-08 | 13F | Larson Financial Group LLC | 0 | -100.00 | 0 | |||||
| 2025-08-11 | 13F | Aptus Capital Advisors, LLC | 268 | 5 | ||||||
| 2025-08-13 | 13F | Jones Financial Companies Lllp | 214 | -38.86 | 4 | -33.33 | ||||
| 2025-08-13 | 13F | Quadrature Capital Ltd | 564,759 | -13.02 | 11,219 | -1.39 | ||||
| 2025-08-14 | 13F | Prelude Capital Management, Llc | 0 | -100.00 | 0 | |||||
| 2025-08-14 | 13F | Citadel Advisors Llc | Put | 20,400 | 29.94 | 405 | 47.81 | |||
| 2025-05-08 | 13F | New York Life Investment Management Llc | 0 | -100.00 | 0 | |||||
| 2025-07-24 | 13F | Blair William & Co/il | 2,896 | -22.21 | 58 | -12.31 | ||||
| 2025-07-21 | 13F | Mirae Asset Global Investments Co., Ltd. | 27,834 | 316.74 | 553 | 371.79 | ||||
| 2025-07-10 | 13F | Contravisory Investment Management, Inc. | 25,720 | 511 | ||||||
| 2025-08-14 | 13F | Citadel Advisors Llc | Call | 16,800 | -93.32 | 334 | -92.44 | |||
| 2025-08-14 | 13F | Susquehanna International Group, Llp | Call | 0 | -100.00 | 0 | ||||
| 2025-08-28 | NP | TFAFX - Tactical Growth Allocation Fund Class I | 1,600 | 32 | ||||||
| 2025-08-05 | 13F | Harel Insurance Investments & Financial Services Ltd. | 5,000 | 108.33 | 0 | |||||
| 2025-08-14 | 13F | Raymond James Financial Inc | 322,199 | -16.08 | 6,399 | -4.82 | ||||
| 2025-07-16 | 13F | Banque Pictet & Cie Sa | 215,913 | 0.00 | 4,288 | 13.44 | ||||
| 2025-07-28 | 13F | Harbour Investments, Inc. | 556 | 0.00 | 11 | 22.22 | ||||
| 2025-08-06 | 13F | Golden State Wealth Management, LLC | 115 | 0.00 | 2 | 0.00 | ||||
| 2025-05-14 | 13F | Walleye Trading LLC | 0 | -100.00 | 0 | -100.00 | ||||
| 2025-08-12 | 13F | O'shaughnessy Asset Management, Llc | 220 | -37.85 | 4 | -33.33 | ||||
| 2025-08-06 | 13F | Commonwealth Equity Services, Llc | 26,525 | 12.75 | 1 | |||||
| 2025-08-08 | 13F | Foundations Investment Advisors, LLC | 0 | -100.00 | 0 | |||||
| 2025-06-26 | NP | BlackRock ETF Trust - iShares International Country Rotation Active ETF | 2,415 | -27.24 | 42 | -22.22 | ||||
| 2025-08-14 | 13F | CIBC World Markets Inc. | 476,469 | -1.35 | 9,463 | 11.88 | ||||
| 2025-08-28 | NP | ICCIX - Dynamic International Opportunity Fund Class I | 29,101 | -19.19 | 578 | -8.41 | ||||
| 2025-08-13 | 13F | Invesco Ltd. | 10,233 | -7.18 | 203 | 5.18 | ||||
| 2025-04-25 | 13F | Mmbg Investment Advisors Co. | 0 | -100.00 | 0 | |||||
| 2025-03-26 | NP | MDAKX - MainStay Moderate ETF Allocation Fund Class C | 194,616 | 11.09 | 3,211 | 2.59 | ||||
| 2025-08-18 | 13F | Wolverine Trading, Llc | Call | 0 | -100.00 | 0 | ||||
| 2025-07-23 | 13F | Vontobel Holding Ltd. | 333,736 | -1.18 | 6,628 | 12.08 | ||||
| 2025-07-28 | 13F | Twin Tree Management, LP | 0 | -100.00 | 0 | |||||
| 2025-08-06 | 13F | Texas Yale Capital Corp. | 0 | -100.00 | 0 | |||||
| 2025-08-12 | 13F | Rhumbline Advisers | 1,431 | 0.00 | 28 | 12.00 | ||||
| 2025-08-13 | 13F | Taikang Asset Management (Hong Kong) Co Ltd | 55,029 | 0.00 | 1,093 | 13.40 | ||||
| 2025-08-13 | 13F | Capital Fund Management S.a. | 33,788 | 49.29 | 671 | 69.44 | ||||
| 2025-08-05 | 13F | Sigma Planning Corp | 24,004 | 33.87 | 477 | 52.08 | ||||
| 2025-05-15 | 13F | Optiver Holding B.V. | 0 | -100.00 | 0 | -100.00 | ||||
| 2025-08-14 | 13F | Glen Eagle Advisors, LLC | 58 | 1 | ||||||
| 2025-08-11 | 13F | TD Waterhouse Canada Inc. | 1,455 | 0.00 | 29 | 12.00 | ||||
| 2025-08-12 | 13F | Steward Partners Investment Advisory, Llc | 616 | 0.00 | 12 | 20.00 | ||||
| 2025-07-22 | 13F | 4Thought Financial Group Inc. | 184 | 3.37 | 4 | 0.00 | ||||
| 2025-08-08 | 13F | Creative Planning | 10,553 | -0.01 | 210 | 13.59 | ||||
| 2025-08-14 | 13F | Susquehanna International Group, Llp | Put | 10,100 | -79.72 | 201 | -77.04 | |||
| 2025-08-05 | 13F | Castlekeep Investment Advisors Llc | 20,757 | -3.42 | 412 | 9.57 | ||||
| 2025-08-14 | 13F | Susquehanna International Group, Llp | 12,229 | -92.56 | 243 | -91.59 | ||||
| 2025-08-14 | 13F | Tudor Investment Corp Et Al | 0 | -100.00 | 0 | |||||
| 2025-08-13 | 13F | Capital Fund Management S.a. | Call | 14,400 | -54.29 | 286 | -48.28 | |||
| 2025-05-15 | 13F | Dai-ichi Life Holdings, Inc. | 0 | -100.00 | 0 | |||||
| 2025-08-14 | 13F | Hrt Financial Lp | 179,958 | 4 | ||||||
| 2025-08-08 | 13F | SG Americas Securities, LLC | 1,195,271 | 738.32 | 24 | 1,050.00 | ||||
| 2025-08-13 | 13F | Marshall Wace, Llp | 43,000 | 854 | ||||||
| 2025-07-14 | 13F | Legacy Capital Group California, Inc. | 25,470 | 506 | ||||||
| 2025-08-14 | 13F | Bnp Paribas Arbitrage, Sa | 63,032 | -49.05 | 1,252 | -42.24 | ||||
| 2025-08-11 | 13F | Covestor Ltd | 7 | 0.00 | 0 | |||||
| 2025-08-14 | 13F | Evergreen Capital Management Llc | 124,720 | 6.09 | 2,477 | 20.31 | ||||
| 2025-08-06 | 13F | Prospera Financial Services Inc | 0 | -100.00 | 0 | |||||
| 2025-08-12 | 13F | Barings Llc | 208,539 | -8.67 | 4,142 | 3.58 | ||||
| 2025-07-29 | 13F | Millburn Ridgefield Corp | 646,987 | -12.03 | 12,849 | -0.23 | ||||
| 2025-08-13 | 13F | Baker Avenue Asset Management, LP | Put | 150,000 | -55.88 | 8 | -97.92 | |||
| 2025-05-07 | 13F | Drive Wealth Management, Llc | 0 | -100.00 | 0 | |||||
| 2025-08-14 | 13F | Citadel Advisors Llc | 0 | -100.00 | 0 | |||||
| 2025-08-05 | 13F | Bank Of Montreal /can/ | 81,957 | 0.28 | 1,628 | 13.70 | ||||
| 2025-08-13 | 13F | Cresset Asset Management, LLC | 29,020 | 8.78 | 576 | 23.34 | ||||
| 2025-08-06 | 13F | Innealta Capital, Llc | 29,101 | -19.19 | 578 | -8.41 | ||||
| 2025-08-14 | 13F | Jane Street Group, Llc | 544,097 | -22.59 | 10,806 | -12.21 | ||||
| 2025-08-14 | 13F | Gotham Asset Management, LLC | 10,426 | 0.00 | 207 | 13.74 | ||||
| 2025-08-13 | 13F | Idaho Trust Bank | 29,514 | 25.87 | 586 | 42.93 | ||||
| 2025-08-14 | 13F | Group One Trading, L.p. | 9,036 | 179 | ||||||
| 2025-08-27 | 13F/A | Squarepoint Ops LLC | 48,311 | 29.52 | 959 | 46.86 | ||||
| 2025-08-14 | 13F | Old Mission Capital Llc | 0 | -100.00 | 0 | |||||
| 2025-08-15 | 13F | Tower Research Capital LLC (TRC) | 1,837 | -37.81 | 36 | -41.94 | ||||
| 2025-08-12 | 13F | Jpmorgan Chase & Co | 192,022 | -3.68 | 3,814 | 9.26 | ||||
| 2025-07-31 | 13F | GenTrust, LLC | 20,561 | 6.03 | 408 | 20.35 | ||||
| 2025-08-14 | 13F | Comerica Bank | 1,112 | 11.87 | 22 | 29.41 | ||||
| 2025-08-05 | 13F | Tsfg, Llc | 500 | 0.00 | 0 | |||||
| 2025-08-12 | 13F | Proequities, Inc. | 0 | 0 | ||||||
| 2025-08-13 | 13F | Walleye Trading LLC | Call | 0 | -100.00 | 0 | ||||
| 2025-08-08 | 13F | Abc Arbitrage Sa | 17,827 | -80.52 | 354 | -77.90 | ||||
| 2025-07-29 | NP | HFND - Unlimited HFND Multi-Strategy Return Tracker ETF | 2,959 | 866.99 | 56 | 1,020.00 | ||||
| 2025-08-14 | 13F | Qube Research & Technologies Ltd | 927 | -98.35 | 18 | -98.17 | ||||
| 2025-07-17 | 13F | Albion Financial Group /ut | 63,000 | 0.00 | 1,251 | 13.42 | ||||
| 2025-08-13 | 13F | Renaissance Technologies Llc | 434,900 | 76.22 | 8,637 | 99.88 | ||||
| 2025-08-11 | 13F | Citigroup Inc | 26,239 | -72.07 | 521 | -68.33 | ||||
| 2025-07-18 | 13F | USA Financial Portformulas Corp | 7,706 | -38.75 | 153 | -30.45 | ||||
| 2025-08-11 | 13F | Principal Securities, Inc. | 29 | 1 | ||||||
| 2025-03-26 | NP | MOEAX - MainStay Growth ETF Allocation Fund Class A | 163,359 | 11.17 | 2,695 | 2.67 | ||||
| 2025-08-05 | 13F | Gould Asset Management Llc /ca/ | 39,511 | -3.26 | 785 | 9.65 | ||||
| 2025-08-07 | 13F | Allworth Financial LP | 20 | 0.00 | 0 | |||||
| 2025-08-14 | 13F | Two Sigma Securities, Llc | 17,106 | -68.19 | 340 | -63.97 | ||||
| 2025-05-29 | NP | Northern Lights Fund Trust - Sierra Tactical Core Growth Fund Investor Class Shares | 26,075 | 457 | ||||||
| 2025-05-29 | NP | Northern Lights Fund Trust - Sierra Tactical Risk Spectrum 50 Fund Investor Class | 568,800 | 9,960 | ||||||
| 2025-08-14 | 13F | Jane Street Group, Llc | Put | 33,500 | 665 | |||||
| 2025-07-24 | 13F | Cyndeo Wealth Partners, LLC | 15,626 | -2.78 | 310 | 10.32 | ||||
| 2025-08-14 | 13F | Wells Fargo & Company/mn | 165,021 | 382.84 | 3,277 | 447.99 | ||||
| 2025-05-15 | 13F | Barclays Plc | 0 | -100.00 | 0 | |||||
| 2025-08-14 | 13F | Integrated Wealth Concepts LLC | 54,406 | -41.23 | 1,080 | -33.33 | ||||
| 2025-05-01 | 13F | Cwm, Llc | 0 | -100.00 | 0 | |||||
| 2025-08-12 | 13F | BlackRock, Inc. | Put | 0 | -100.00 | 0 | -100.00 | |||
| 2025-08-14 | 13F | Horizon Investments, LLC | 27 | 107.69 | 1 | |||||
| 2025-08-14 | 13F | Goldman Sachs Group Inc | 87,564 | -46.51 | 1,739 | -39.32 | ||||
| 2025-05-29 | NP | Northern Lights Fund Trust - Sierra Tactical Risk Spectrum 30 Fund Instl Class | 142,900 | 2,502 | ||||||
| 2025-08-08 | NP | QALTX - Quantified Alternative Investment Fund Investor Class Shares | 1,411 | 28 | ||||||
| 2025-08-13 | 13F | Amundi | 23,414 | 7.90 | 471 | 24.01 | ||||
| 2025-08-12 | 13F | Atlas Capital Advisors Llc | 0 | -100.00 | 0 | |||||
| 2025-08-14 | 13F | Bank Of America Corp /de/ | 70,005 | -21.62 | 1,390 | -11.07 | ||||
| 2025-08-12 | 13F | XTX Topco Ltd | 15,828 | 314 | ||||||
| 2025-08-14 | 13F | Headlands Technologies LLC | 0 | -100.00 | 0 | -100.00 | ||||
| 2025-04-28 | 13F | Pictet North America Advisors SA | 0 | -100.00 | 0 | |||||
| 2025-07-16 | 13F/A | CX Institutional | 584 | -32.56 | 0 | |||||
| 2025-05-15 | 13F | Crestline Management, LP | 0 | -100.00 | 0 |