Mga Batayang Estadistika
| Saham Institusional (Jangka Panjang) | 149,434,538 - 122.06% (ex 13D/G) - change of 1.47MM shares 1.00% MRQ |
| Nilai Institusional (Jangka Panjang) | $ 2,378,048 USD ($1000) |
Kepemilikan Institusional dan Pemegang Saham
Genesis Energy, L.P. - Limited Partnership (US:GEL) memiliki 153 pemilik institusional dan pemegang saham yang telah mengajukan formulir 13D/G atau 13F kepada Komisi Bursa Efek (Securities Exchange Commission/SEC). Lembaga-lembaga ini memegang total 149,435,610 saham. Pemegang saham terbesar meliputi AMLP - ALERIAN MLP ETF, Alps Advisors Inc, Invesco Ltd., MLPRX - Invesco Oppenheimer SteelPath MLP Income Fund Class C, MLPEX - Invesco Oppenheimer SteelPath MLP Select 40 Fund Class C, MIRAE ASSET GLOBAL ETFS HOLDINGS Ltd., Jpmorgan Chase & Co, MLPA - Global X MLP ETF, Goldman Sachs Group Inc, and Chickasaw Capital Management Llc .
Struktur kepemilikan institusional Genesis Energy, L.P. - Limited Partnership (NYSE:GEL) menunjukkan posisi terkini di perusahaan oleh institusi dan dana, serta perubahan terbaru dalam ukuran posisi. Pemegang saham utama dapat mencakup investor individu, reksa dana, dana lindung nilai, atau institusi. Jadwal 13D menunjukkan bahwa investor memegang (atau pernah memegang) lebih dari 5% saham perusahaan dan bermaksud (atau pernah bermaksud) untuk secara aktif mengejar perubahan strategi bisnis. Jadwal 13G menunjukkan investasi pasif lebih dari 5%.
The share price as of September 5, 2025 is 16.61 / share. Previously, on September 9, 2024, the share price was 12.82 / share. This represents an increase of 29.56% over that period.

Skor Sentimen Dana
Skor Sentimen Dana (sebelumnya dikenal sebagai Skor Akumulasi Kepemilikan) menemukan saham-saham yang paling banyak dibeli oleh dana. Ini adalah hasil dari model kuantitatif multi-faktor yang canggih yang mengidentifikasi perusahaan dengan tingkat akumulasi institusional tertinggi. Model penilaian menggunakan kombinasi dari total peningkatan pemilik yang diungkapkan, perubahan dalam alokasi portofolio pada pemilik tersebut, dan metrik lainnya. Angka berkisar dari 0 hingga 100, dengan angka yang lebih tinggi menunjukkan tingkat akumulasi yang lebih tinggi dibandingkan dengan perusahaan sejenisnya, dan 50 adalah rata-ratanya.
Frekuensi Pembaruan: Setiap Hari
Lihat Ownership Explorer, yang menyediakan daftar perusahaan dengan peringkat tertinggi.
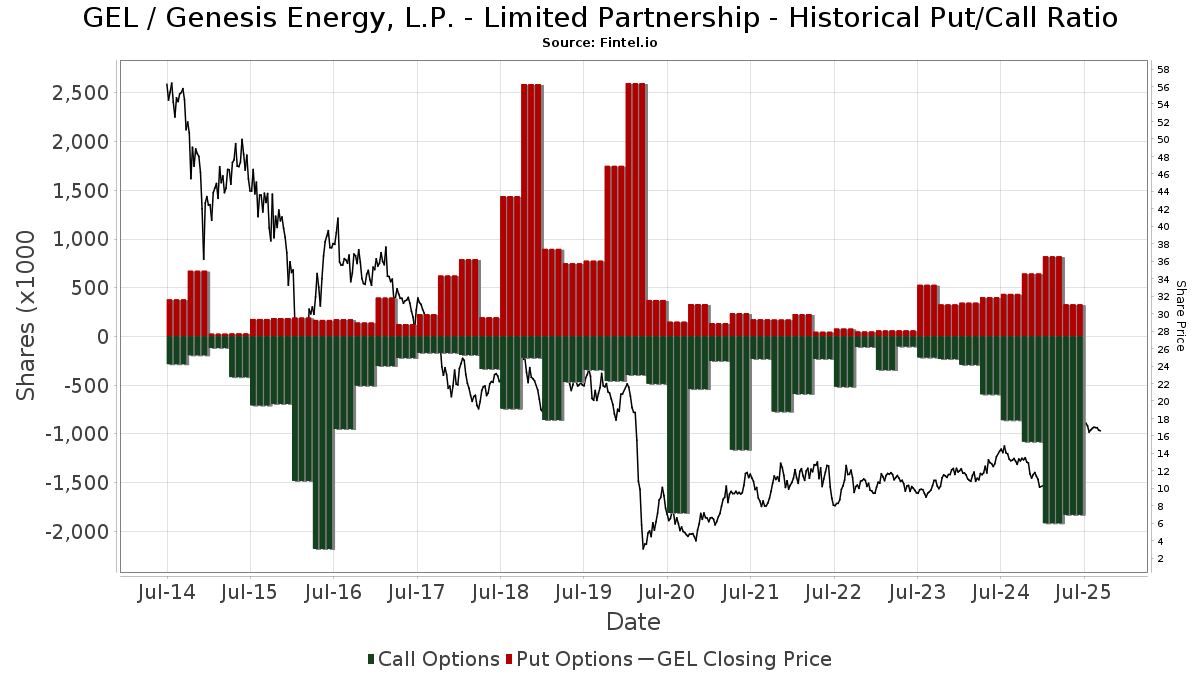
Rasio Put/Call Institusional
Selain melaporkan isu ekuitas dan utang standar, institusi dengan aset di bawah manajemen lebih dari 100 juta dolar AS juga harus mengungkapkan kepemilikan opsi put dan call mereka. Karena opsi put umumnya menunjukkan sentimen negatif, dan opsi call menunjukkan sentimen positif, kita dapat mengetahui sentimen institusional secara keseluruhan dengan memplot rasio put terhadap call. Grafik di sebelah kanan memplot rasio put/call historis untuk instrumen ini.
Menggunakan Rasio Put/Call sebagai indikator sentimen investor mengatasi salah satu kekurangan utama dari penggunaan total kepemilikan institusional, yaitu sejumlah besar aset yang dikelola diinvestasikan secara pasif untuk melacak indeks. Dana yang dikelola secara pasif biasanya tidak membeli opsi, sehingga indikator rasio put/call lebih akurat dalam melacak sentimen dana yang dikelola secara aktif.
Pengajuan 13D/G
Kami menyajikan pengajuan 13D/G secara terpisah dari pengajuan 13F karena perlakuan yang berbeda oleh SEC. Pengajuan 13D/G dapat diajukan oleh kelompok investor (dengan satu pemimpin), sedangkan pengajuan 13F tidak bisa. Hal ini mengakibatkan situasi di mana seorang investor dapat mengajukan 13D/G yang melaporkan satu nilai untuk total saham (mewakili semua saham yang dimiliki oleh kelompok investor), tetapi kemudian mengajukan 13F yang melaporkan nilai yang berbeda untuk total saham (mewakili kepemilikan mereka sendiri). Ini berarti bahwa kepemilikan saham dari pengajuan 13D/G dan pengajuan 13F seringkali tidak dapat dibandingkan secara langsung, sehingga kami menyajikannya secara terpisah.
Catatan: Mulai 16 Mei 2021, kami tidak lagi menampilkan pemilik yang belum mengajukan 13D/G dalam setahun terakhir. Sebelumnya, kami menampilkan riwayat lengkap pengajuan 13D/G. Secara umum, entitas yang diwajibkan untuk mengajukan pengajuan 13D/G harus mengajukan setidaknya setiap tahun sebelum mengirimkan pengajuan penutupan. Namun, terkadang dana keluar dari posisi tanpa mengirimkan pengajuan penutupan (misalnya, mereka menghentikan operasi), sehingga menampilkan riwayat lengkap terkadang menyebabkan kebingungan tentang kepemilikan saat ini. Untuk mencegah kebingungan, kami sekarang hanya menampilkan pemilik 'saat ini' - yaitu - pemilik yang telah mengajukan dalam setahun terakhir.
Upgrade to unlock premium data.
| Tanggal File | Formulir | Investor | Sebelumnya Saham |
Terbaru Saham |
Δ Saham (Persen) |
Kepemilikan (Persen) |
Δ Pagmamay-ari (Persen) |
|
|---|---|---|---|---|---|---|---|---|
| 2025-08-14 | Global X Management CO LLC | 6,307,420 | 4,889,794 | -22.48 | 3.99 | -22.52 | ||
| 2025-07-09 | ALPS ADVISORS INC | 24,020,175 | 23,460,058 | -2.33 | 19.16 | -2.29 | ||
| 2025-05-09 | Invesco Ltd. | 17,430,289 | 18,799,575 | 7.86 | 15.40 | 8.45 | ||
| 2025-03-10 | KKR Group Partnership L.P. | 12,668,389 | 7,847,861 | -38.05 | 6.00 | -36.17 | ||
| 2025-03-10 | Blackstone Holdings II L.P. | 10,787,197 | 7,034,927 | -34.78 | 5.50 | -32.10 |
Pengajuan 13F dan NPORT
Detail pada pengajuan 13F tersedia gratis. Detail pada pengajuan NP memerlukan keanggotaan premium. Baris berwarna hijau menunjukkan posisi baru. Baris berwarna merah menunjukkan posisi yang sudah ditutup. Klik tautan ini ikon untuk melihat riwayat transaksi selengkapnya.
Tingkatkan
untuk membuka data premium dan mengekspor ke Excel ![]() .
.
| Tanggal File | Sumber | Investor | Ketik | Presyo ng Avg (Silangan) |
Saham | Δ Saham (%) |
Dilaporkan Nilai ($1000) |
Nilai Δ (%) |
Alokasi Port (%) |
|
|---|---|---|---|---|---|---|---|---|---|---|
| 2025-08-08 | 13F | Creative Planning | 3,106,054 | 0.02 | 53,517 | 9.84 | ||||
| 2025-08-05 | 13F | Simplex Trading, Llc | Put | 20,800 | -81.21 | 0 | -100.00 | |||
| 2025-08-05 | 13F | Simplex Trading, Llc | Call | 105,700 | -16.71 | 2 | 0.00 | |||
| 2025-08-13 | 13F | Natixis | 1,027,500 | -15.36 | 17,704 | -6.64 | ||||
| 2025-08-12 | 13F | Bokf, Na | 500 | 0.00 | 9 | 14.29 | ||||
| 2025-08-13 | 13F | F/M Investments LLC | 12,070 | 0.00 | 208 | 9.52 | ||||
| 2025-08-27 | NP | Amplify ETF Trust - Amplify Natural Resources Dividend Income ETF | 0 | -100.00 | 0 | -100.00 | ||||
| 2025-07-25 | NP | AMLPX - MainGate MLP Fund Class A | 1,650,000 | -1.20 | 26,020 | 21.35 | ||||
| 2025-07-15 | 13F | Mather Group, Llc. | 0 | -100.00 | 0 | |||||
| 2025-08-14 | 13F | Grizzlyrock Capital, Llc | 630,346 | -1.09 | 10,861 | 8.62 | ||||
| 2025-08-12 | 13F | Clearbridge Investments, LLC | 2,897,883 | 0.00 | 49,931 | 9.82 | ||||
| 2025-08-14 | 13F | Peak6 Llc | 0 | -100.00 | 0 | |||||
| 2025-05-08 | 13F | Gsa Capital Partners Llp | 0 | -100.00 | 0 | |||||
| 2025-08-14 | 13F | Group One Trading, L.p. | Call | 92,900 | 260.08 | 1,601 | 296.04 | |||
| 2025-08-14 | 13F | Group One Trading, L.p. | 9,956 | -94.40 | 172 | -93.87 | ||||
| 2025-08-08 | 13F | SG Americas Securities, LLC | 7,801 | 0 | ||||||
| 2025-07-30 | NP | Cushing Mlp Total Return Fund | 130,000 | -13.33 | 2,050 | -1.39 | ||||
| 2025-06-30 | NP | CVY - Invesco Zacks Multi-Asset Income ETF This fund is a listed as child fund of Invesco Ltd. and if that institution has disclosed ownership in this security, then these positions will not be double counted when calculating total shares and total value | 57,096 | -8.44 | 784 | 19.69 | ||||
| 2025-08-14 | 13F | Group One Trading, L.p. | Put | 2,900 | -81.41 | 50 | -79.92 | |||
| 2025-08-08 | 13F | Cetera Investment Advisers | 17,543 | 42.90 | 302 | 57.29 | ||||
| 2025-07-17 | 13F | Janney Montgomery Scott LLC | 10,300 | 0.00 | 0 | |||||
| 2025-08-19 | 13F | Advisory Services Network, LLC | 25,955 | 0.00 | 451 | 10.57 | ||||
| 2025-07-23 | NP | Clearbridge Energy Mlp Opportunity Fund Inc. This fund is a listed as child fund of Clearbridge, Llc and if that institution has disclosed ownership in this security, then these positions will not be double counted when calculating total shares and total value | 2,897,883 | 0.00 | 45,700 | 22.82 | ||||
| 2025-08-11 | 13F | Alps Advisors Inc | 23,460,058 | -2.33 | 404,217 | 7.25 | ||||
| 2025-07-11 | 13F | Arrow Investment Advisors, LLC | 10,678 | -21.98 | 184 | -14.49 | ||||
| 2025-08-06 | 13F | Ing Groep Nv | 1,453,200 | 57.10 | 25,039 | 72.52 | ||||
| 2025-08-12 | 13F | Inscription Capital, LLC | 18,994 | 327 | ||||||
| 2025-08-07 | 13F | Pinnacle Holdings, LLC | 239,195 | 1.10 | 4,121 | 11.02 | ||||
| 2025-07-21 | NP | GLEAX - Goldman Sachs MLP & Energy Fund Class A Shares | 86,058 | -15.53 | 1,357 | 3.75 | ||||
| 2025-05-14 | 13F | Smartleaf Asset Management LLC | 0 | -100.00 | 0 | |||||
| 2025-07-29 | NP | Tortoise Capital Series Trust - TORTOISE NORTH AMERICAN PIPELINE FUND | 119,028 | 1,877 | ||||||
| 2025-07-11 | 13F/A | Umb Bank N A/mo | 14,000 | 0.00 | 241 | 10.05 | ||||
| 2025-07-07 | 13F | Fractal Investments LLC | 343,243 | 0.00 | 5,914 | 9.82 | ||||
| 2025-08-14 | 13F | Limestone Investment Advisors LP | 262 | |||||||
| 2025-05-13 | 13F | Lee Financial Co | 0 | -100.00 | 0 | |||||
| 2025-08-08 | 13F | Pnc Financial Services Group, Inc. | 151 | 3 | ||||||
| 2025-06-26 | NP | Voya Prime Rate Trust | Short | -1,072 | -0.00 | -15 | 27.27 | |||
| 2025-08-14 | 13F | Caption Management, LLC | Call | 197,500 | -28.83 | 3,403 | -21.85 | |||
| 2025-08-14 | 13F | Bnp Paribas Arbitrage, Sa | 208,541 | 26.12 | 3,593 | 38.51 | ||||
| 2025-07-30 | NP | ENFR - Alerian Energy Infrastructure ETF | 84,136 | -2.09 | 1,327 | 20.22 | ||||
| 2025-08-04 | 13F | Keybank National Association/oh | 21,063 | 0.00 | 363 | 9.70 | ||||
| 2025-06-17 | NP | GSRAX - Goldman Sachs Rising Dividend Growth Fund Class A | 77,337 | -20.55 | 1,063 | 3.71 | ||||
| 2025-08-15 | 13F | Tower Research Capital LLC (TRC) | 213 | 526.47 | 4 | |||||
| 2025-08-14 | 13F | GWM Advisors LLC | 4,127 | 0.00 | 71 | 10.94 | ||||
| 2025-08-13 | 13F | Brown Advisory Inc | 66,445 | 0.00 | 1,145 | 9.79 | ||||
| 2025-08-12 | 13F | Financial Advocates Investment Management | 22,159 | -28.63 | 382 | -21.77 | ||||
| 2025-08-14 | 13F | Jane Street Group, Llc | Put | 21,600 | -66.62 | 372 | -63.35 | |||
| 2025-08-18 | 13F | Castleark Management Llc | 70,540 | -24.77 | 1,215 | -17.40 | ||||
| 2025-07-15 | 13F | MCF Advisors LLC | 1,000 | 0.00 | 17 | 13.33 | ||||
| 2025-08-14 | 13F | Jane Street Group, Llc | Call | 444,600 | 43.88 | 7,660 | 58.00 | |||
| 2025-08-14 | 13F | Wells Fargo & Company/mn | 61,027 | -28.53 | 1,051 | -21.51 | ||||
| 2025-08-08 | 13F | Horrell Capital Management, Inc. | 22,000 | 0.00 | 379 | 9.86 | ||||
| 2025-07-29 | NP | OSPPX - Invesco Oppenheimer SteelPath MLP Alpha Plus Fund Class R6 | 625,358 | -0.50 | 9,862 | 22.19 | ||||
| 2025-08-14 | 13F | Rangeley Capital, LLC | 74,000 | -60.85 | 1,275 | -57.00 | ||||
| 2025-07-29 | NP | MLPEX - Invesco Oppenheimer SteelPath MLP Select 40 Fund Class C | 7,191,977 | -5.27 | 113,417 | 16.35 | ||||
| 2025-07-10 | 13F | Chickasaw Capital Management Llc | 3,551,414 | -4.75 | 61 | 5.17 | ||||
| 2025-06-25 | NP | SMLPX - Westwood Salient MLP & Energy Infrastructure Fund Institutional Shares | 657,447 | -31.73 | 9,033 | -10.83 | ||||
| 2025-08-14 | 13F | Jane Street Group, Llc | 245,781 | 4,235 | ||||||
| 2025-08-06 | 13F | Pekin Hardy Strauss, Inc. | 20,500 | 353 | ||||||
| 2025-08-14 | 13F | Hrt Financial Lp | 111,646 | 2 | ||||||
| 2025-08-13 | 13F | Manning & Napier Advisors Llc | 470,287 | 4.51 | 8,103 | 14.77 | ||||
| 2025-08-14 | 13F | Blackstone Group Inc | 575,735 | 0.00 | 9,920 | 9.81 | ||||
| 2025-08-12 | 13F | CIBC Private Wealth Group, LLC | 200 | 0.00 | 3 | 50.00 | ||||
| 2025-08-13 | 13F | RR Advisors, LLC | 2,286,000 | -9.14 | 39 | 0.00 | ||||
| 2025-08-14 | 13F | Bbr Partners, Llc | 0 | -100.00 | 0 | |||||
| 2025-08-12 | 13F | Argent Trust Co | 329,325 | 0.00 | 5,674 | 9.81 | ||||
| 2025-08-14 | 13F | Toroso Investments, LLC | 0 | -100.00 | 0 | |||||
| 2025-08-12 | 13F | Steward Partners Investment Advisory, Llc | 4,545 | 0.00 | 78 | 9.86 | ||||
| 2025-07-14 | 13F | Cushing Asset Management, Lp | 685,700 | 60.27 | 11,815 | 76.01 | ||||
| 2025-08-14 | 13F | Van Eck Associates Corp | 21,633 | 5.16 | 0 | |||||
| 2025-07-24 | 13F | Us Bancorp \de\ | 1,000 | 0.00 | 17 | 13.33 | ||||
| 2025-08-14 | 13F | Citadel Advisors Llc | 136,346 | 2,349 | ||||||
| 2025-08-14 | 13F | Citadel Advisors Llc | Put | 179,100 | -34.30 | 3,086 | -27.87 | |||
| 2025-08-05 | 13F | Huntington National Bank | 1 | 0.00 | 0 | |||||
| 2025-08-14 | 13F | Stifel Financial Corp | 66,846 | 274.03 | 1,152 | 311.07 | ||||
| 2025-08-14 | 13F | Hilltop Holdings Inc. | 31,100 | 536 | ||||||
| 2025-07-24 | 13F | Trust Co Of Toledo Na /oh/ | 500 | 9 | ||||||
| 2025-08-11 | 13F | ARS Investment Partners, LLC | 32,000 | -30.43 | 551 | 18.49 | ||||
| 2025-07-23 | 13F | Maryland State Retirement & Pension System | 100,397 | 6.26 | 1,730 | 16.67 | ||||
| 2025-08-14 | 13F | Horizon Investments, LLC | 17 | 0.00 | 0 | |||||
| 2025-08-14 | 13F/A | Barclays Plc | 381,877 | -68.35 | 7 | -66.67 | ||||
| 2025-08-14 | 13F | Citadel Advisors Llc | Call | 159,900 | -68.28 | 2,755 | -65.17 | |||
| 2025-08-13 | 13F | Quadrant Capital Group Llc | 0 | -100.00 | 0 | |||||
| 2025-08-11 | 13F | HighTower Advisors, LLC | 102,278 | 2.50 | 1,762 | 12.59 | ||||
| 2025-07-30 | NP | MLPA - Global X MLP ETF This fund is a listed as child fund of Mirae Asset Global Investments Co., Ltd. and if that institution has disclosed ownership in this security, then these positions will not be double counted when calculating total shares and total value | 4,866,790 | -12.36 | 76,749 | 7.63 | ||||
| 2025-08-12 | 13F | MAI Capital Management | 2,557 | 0.00 | 44 | 10.00 | ||||
| 2025-08-13 | 13F | Callodine Capital Management, LP | 470,287 | 4.51 | 8,103 | 14.77 | ||||
| 2025-08-15 | 13F | Binnacle Investments Inc | 350 | 0.00 | 6 | 20.00 | ||||
| 2025-08-14 | 13F | Susquehanna International Group, Llp | Put | 78,300 | -78.14 | 1,349 | -76.00 | |||
| 2025-07-29 | NP | SPMHX - Invesco Oppenheimer SteelPath MLP Alpha Fund Class R5 | 1,520,635 | 0.00 | 23,980 | 22.82 | ||||
| 2025-08-14 | 13F | Tortoise Capital Advisors, L.l.c. | 32,331 | 0.00 | 557 | 9.86 | ||||
| 2025-08-14 | 13F | Susquehanna International Group, Llp | 12,164 | -37.37 | 210 | -31.25 | ||||
| 2025-08-14 | 13F | Dividend Asset Capital, Llc | 21,400 | -1.38 | 369 | 8.24 | ||||
| 2025-08-14 | 13F | Susquehanna International Group, Llp | Call | 480,500 | 86.89 | 8,279 | 105.28 | |||
| 2025-07-30 | 13F | Sanders Morris Harris Llc | 30,700 | 2.33 | 529 | 12.10 | ||||
| 2025-08-05 | 13F | Bank Of Montreal /can/ | 14,565 | 251 | ||||||
| 2025-08-08 | 13F | Larson Financial Group LLC | 221 | 0.91 | 4 | 0.00 | ||||
| 2025-08-19 | 13F | Asset Dedication, LLC | 500 | 0.00 | 9 | 14.29 | ||||
| 2025-08-25 | NP | MANNING & NAPIER FUND, INC. - Callodine Equity Income Series Class I | 470,287 | 4.51 | 8,103 | 14.77 | ||||
| 2025-07-17 | 13F | Fort Washington Investment Advisors Inc /oh/ | 44,684 | -59.62 | 770 | -55.70 | ||||
| 2025-08-13 | 13F | Invesco Ltd. | 18,805,179 | 0.03 | 324,013 | 9.85 | ||||
| 2025-04-28 | 13F | First Horizon Advisors, Inc. | 0 | -100.00 | 0 | -100.00 | ||||
| 2025-06-30 | NP | USAI - Pacer American Energy Independence ETF | 101,799 | -27.51 | 1,399 | -5.35 | ||||
| 2025-05-15 | 13F | Murchinson Ltd. | 0 | -100.00 | 0 | |||||
| 2025-07-28 | 13F | Harbour Investments, Inc. | 100 | 0.00 | 2 | 0.00 | ||||
| 2025-08-14 | 13F | Goldman Sachs Group Inc | 4,778,325 | 17.26 | 82,331 | 28.78 | ||||
| 2025-07-28 | NP | TOLZ - ProShares DJ Brookfield Global Infrastructure ETF | 8,244 | 14.64 | 130 | 41.30 | ||||
| 2025-08-15 | 13F | Morgan Stanley | 3,355,362 | 41.10 | 57,813 | 54.95 | ||||
| 2025-08-25 | NP | ALEFX - ALPS/Alerian Energy Infrastructure Portfolio Class I | 45,067 | 19.30 | 777 | 31.08 | ||||
| 2025-08-14 | 13F | MIRAE ASSET GLOBAL ETFS HOLDINGS Ltd. | 4,955,061 | -11.56 | 85,376 | -2.88 | ||||
| 2025-08-12 | 13F | Proequities, Inc. | Put | 0 | 0 | |||||
| 2025-08-14 | 13F | Sunbelt Securities, Inc. | 200 | 0.00 | 2 | -33.33 | ||||
| 2025-08-12 | 13F | Proequities, Inc. | Call | 0 | 0 | |||||
| 2025-08-14 | 13F | Infrastructure Capital Advisors, Llc | 620,938 | 330.73 | 10,699 | 39.03 | ||||
| 2025-08-12 | 13F | Proequities, Inc. | 0 | 0 | ||||||
| 2025-07-08 | 13F | Arlington Trust Co LLC | 28,500 | 0.00 | 491 | 9.84 | ||||
| 2025-08-12 | 13F | Advisors Asset Management, Inc. | 254,981 | 2.46 | 4,393 | 12.53 | ||||
| 2025-08-13 | 13F | Cresset Asset Management, LLC | 143,290 | 0.00 | 2,469 | 9.79 | ||||
| 2025-07-28 | 13F | BRYN MAWR TRUST Co | 3,700 | 64 | ||||||
| 2025-08-12 | 13F | Jefferies Financial Group Inc. | 1,897,136 | 1.93 | 32,688 | 11.93 | ||||
| 2025-08-14 | 13F | Royal Bank Of Canada | 212,254 | 19.45 | 3,657 | 31.17 | ||||
| 2025-08-11 | 13F | Brown Brothers Harriman & Co | 10,000 | 0.00 | 172 | 10.26 | ||||
| 2025-08-07 | 13F | Argent Advisors, Inc. | 39,960 | -0.51 | 689 | 9.21 | ||||
| 2025-07-14 | 13F | Sowell Financial Services LLC | 93,651 | 0.00 | 1,614 | 9.80 | ||||
| 2025-08-05 | 13F | Claro Advisors LLC | 25,500 | 439 | ||||||
| 2025-06-25 | NP | Ultimus Managers Trust - Westwood Salient Enhanced Midstream Income ETF | 34,492 | -20.98 | 474 | 3.05 | ||||
| 2025-04-16 | 13F | Wealth Enhancement Advisory Services, Llc | 0 | -100.00 | 0 | -100.00 | ||||
| 2025-08-14 | 13F | UBS Group AG | 1,688,663 | 32.88 | 29,096 | 45.92 | ||||
| 2025-04-21 | 13F | Nelson, Van Denburg & Campbell Wealth Management Group, LLC | 0 | -100.00 | 0 | |||||
| 2025-08-18 | 13F | Wolverine Trading, Llc | 16,492 | 286 | ||||||
| 2025-08-13 | 13F | Texas Capital Bancshares Inc/tx | 200,000 | 0.00 | 3,446 | 9.82 | ||||
| 2025-07-22 | 13F | IMC-Chicago, LLC | Call | 0 | -100.00 | 0 | ||||
| 2025-07-08 | 13F | Nbc Securities, Inc. | 370 | 0 | ||||||
| 2025-08-12 | 13F | Nemes Rush Group LLC | 1,041 | 1.07 | 18 | 6.25 | ||||
| 2025-05-13 | 13F | Skopos Labs, Inc. | 0 | -100.00 | 0 | |||||
| 2025-08-01 | 13F | Envestnet Asset Management Inc | 100,652 | 21.57 | 1,734 | 33.49 | ||||
| 2025-08-18 | 13F | Wolverine Trading, Llc | Call | 17,000 | 295 | |||||
| 2025-08-14 | 13F | Bank Of America Corp /de/ | 545,746 | -4.45 | 9,403 | 4.93 | ||||
| 2025-08-18 | 13F | Wolverine Trading, Llc | Put | 26,900 | 467 | |||||
| 2025-05-07 | 13F | Texas Yale Capital Corp. | 0 | -100.00 | 0 | |||||
| 2025-08-15 | 13F | Captrust Financial Advisors | 34,320 | -0.87 | 591 | 8.84 | ||||
| 2025-08-18 | 13F/A | Westwood Holdings Group Inc | 2,033,940 | -8.55 | 35,045 | 0.43 | ||||
| 2025-07-10 | 13F | Exchange Traded Concepts, Llc | 118,768 | -3.12 | 2,046 | 6.40 | ||||
| 2025-08-12 | 13F | LPL Financial LLC | 103,396 | 567.76 | 1,782 | 635.95 | ||||
| 2025-08-14 | 13F | Douglass Winthrop Advisors, LLC | 35,000 | 0.00 | 603 | 9.84 | ||||
| 2025-08-04 | 13F | ELCO Management Co., LLC | 189,626 | 1.04 | 3,267 | 10.97 | ||||
| 2025-08-14 | 13F | Peak6 Llc | Call | 23,600 | -58.89 | 407 | -54.89 | |||
| 2025-07-28 | 13F | Pettinga Financial Advisors, LLC | 19,220 | 0.00 | 331 | 9.97 | ||||
| 2025-08-05 | 13F | Simplex Trading, Llc | 0 | -100.00 | 0 | -100.00 | ||||
| 2025-08-14 | 13F | Ameriprise Financial Inc | 0 | -100.00 | 0 | |||||
| 2025-07-30 | NP | AMLP - ALERIAN MLP ETF | 24,310,928 | 7.88 | 383,383 | 32.49 | ||||
| 2025-07-29 | NP | MLPRX - Invesco Oppenheimer SteelPath MLP Income Fund Class C | 9,370,932 | 6.24 | 147,780 | 30.48 | ||||
| 2025-05-14 | 13F | Summit Financial Wealth Advisors, LLC | 16,913 | 0.59 | 265 | 49.72 | ||||
| 2025-07-25 | NP | CSHAX - MainStay Cushing MLP Premier Fund Class A | 500,000 | 38.89 | 7,885 | 70.60 | ||||
| 2025-08-12 | 13F | XTX Topco Ltd | 53,720 | 926 | ||||||
| 2025-08-12 | 13F | Jpmorgan Chase & Co | 4,883,712 | 4.73 | 84,146 | 15.01 | ||||
| 2025-08-14 | 13F | Peak6 Llc | Put | 0 | -100.00 | 0 | ||||
| 2025-07-30 | 13F | Whittier Trust Co Of Nevada Inc | 40,000 | 0.00 | 689 | 9.73 | ||||
| 2025-08-11 | 13F | Principal Securities, Inc. | 139 | 2 | ||||||
| 2025-06-26 | NP | GYLD - Arrow Dow Jones Global Yield ETF | 8,604 | -37.13 | 118 | -17.48 | ||||
| 2025-07-24 | 13F | JNBA Financial Advisors | 1,000 | 0.00 | 17 | 13.33 | ||||
| 2025-07-25 | 13F | Avion Wealth | 0 | -100.00 | 0 | |||||
| 2025-08-14 | 13F | Aster Capital Management (DIFC) Ltd | 0 | -100.00 | 0 | |||||
| 2025-08-13 | 13F | Jones Financial Companies Lllp | 63 | 0.00 | 1 | |||||
| 2025-04-29 | 13F | Concurrent Investment Advisors, LLC | 0 | -100.00 | 0 | |||||
| 2025-08-13 | 13F | Level Four Advisory Services, Llc | 31,766 | 547 | ||||||
| 2025-07-28 | 13F | Mutual Advisors, LLC | 46,539 | 43.92 | 737 | 61.62 | ||||
| 2025-06-30 | NP | INVESCO ACTIVELY MANAGED EXCHANGE-TRADED FUND TRUST - Invesco SteelPath MLP & Energy Infrastructure ETF | 39,083 | 537 | ||||||
| 2025-05-13 | 13F | Tejara Capital Ltd | 0 | -100.00 | 0 | |||||
| 2025-08-14 | 13F | Fmr Llc | 49,600 | 855 | ||||||
| 2025-04-14 | NP | TPYP - Tortoise North American Pipeline Fund | 132,970 | 2.71 | 1,707 | 10.13 | ||||
| 2025-08-14 | 13F | Raymond James Financial Inc | 56,963 | -37.26 | 981 | -31.11 | ||||
| 2025-08-12 | 13F | Pacer Advisors, Inc. | 91,833 | -9.73 | 1,582 | -0.88 | ||||
| 2025-08-13 | 13F | Northwestern Mutual Wealth Management Co | 2,321 | 0.00 | 40 | 8.33 | ||||
| 2025-08-18 | 13F | Geneos Wealth Management Inc. | 2,819 | 49 | ||||||
| 2025-09-04 | 13F/A | Advisor Group Holdings, Inc. | 7,706 | 91.41 | 133 | 109.52 | ||||
| 2025-07-23 | 13F | Indiana Trust & Investment Management CO | 4,500 | 0.00 | 78 | 10.00 | ||||
| 2025-06-25 | NP | AMZA - InfraCap MLP ETF | 590,380 | -7.31 | 8,112 | 21.06 | ||||
| 2025-08-14 | 13F | DG Capital Management, LLC | 217,227 | 3.24 | 3,743 | 13.36 | ||||
| 2025-08-13 | 13F | Jump Financial, LLC | 178,135 | 3,069 | ||||||
| 2025-08-14 | 13F | DG Capital Management, LLC | Call | 306,200 | -7.18 | 5,276 | 1.91 | |||
| 2025-05-15 | 13F | Mariner, LLC | 0 | -100.00 | 0 | |||||
| 2025-08-13 | 13F | Summit Financial, LLC | 210,497 | 0.00 | 3,627 | 9.81 | ||||
| 2025-08-21 | NP | EINC - VanEck Vectors Energy Income ETF | 21,633 | 5.16 | 373 | 15.53 | ||||
| 2025-07-11 | 13F | Miller Howard Investments Inc /ny | 1,488,590 | 20.79 | 25,648 | 32.64 | ||||
| 2025-07-31 | 13F | Oppenheimer Asset Management Inc. | 52,962 | 7.65 | 913 | 18.29 | ||||
| 2025-08-14 | 13F/A | Rockefeller Capital Management L.P. | 14,940 | -16.62 | 257 | -8.54 | ||||
| 2025-07-21 | NP | GLPAX - Goldman Sachs MLP Energy Infrastructure Fund Class A Shares | 2,129,588 | -38.82 | 33,584 | -24.86 | ||||
| 2025-07-25 | 13F | Cwm, Llc | 1,371 | 0.51 | 0 | |||||
| 2025-08-11 | 13F | Citigroup Inc | 377,766 | 4.73 | 6,509 | 15.00 |