Mga Batayang Estadistika
| Pemilik Institusional | 258 total, 258 long only, 0 short only, 0 long/short - change of -3.70% MRQ |
| Alokasi Portofolio Rata-rata | 1.7068 % - change of -2.90% MRQ |
| Saham Institusional (Jangka Panjang) | 98,571,997 (ex 13D/G) - change of -3.30MM shares -3.24% MRQ |
| Nilai Institusional (Jangka Panjang) | $ 3,597,676 USD ($1000) |
Kepemilikan Institusional dan Pemegang Saham
DBX ETF Trust - Xtrackers USD High Yield Corporate Bond ETF (US:HYLB) memiliki 258 pemilik institusional dan pemegang saham yang telah mengajukan formulir 13D/G atau 13F kepada Komisi Bursa Efek (Securities Exchange Commission/SEC). Lembaga-lembaga ini memegang total 98,571,997 saham. Pemegang saham terbesar meliputi Bank Of America Corp /de/, Charles Schwab Investment Management Inc, Wells Fargo & Company/mn, Valmark Advisers, Inc., Voya Investment Management Llc, Pnc Financial Services Group, Inc., Northern Lights Fund Trust - Sierra Tactical Bond Fund Investor Class Shares, Envestnet Asset Management Inc, Wright Fund Managment, LLC, and Royal Bank Of Canada .
Struktur kepemilikan institusional DBX ETF Trust - Xtrackers USD High Yield Corporate Bond ETF (ARCA:HYLB) menunjukkan posisi terkini di perusahaan oleh institusi dan dana, serta perubahan terbaru dalam ukuran posisi. Pemegang saham utama dapat mencakup investor individu, reksa dana, dana lindung nilai, atau institusi. Jadwal 13D menunjukkan bahwa investor memegang (atau pernah memegang) lebih dari 5% saham perusahaan dan bermaksud (atau pernah bermaksud) untuk secara aktif mengejar perubahan strategi bisnis. Jadwal 13G menunjukkan investasi pasif lebih dari 5%.
The share price as of September 5, 2025 is 36.96 / share. Previously, on September 9, 2024, the share price was 36.46 / share. This represents an increase of 1.37% over that period.

Skor Sentimen Dana
Skor Sentimen Dana (sebelumnya dikenal sebagai Skor Akumulasi Kepemilikan) menemukan saham-saham yang paling banyak dibeli oleh dana. Ini adalah hasil dari model kuantitatif multi-faktor yang canggih yang mengidentifikasi perusahaan dengan tingkat akumulasi institusional tertinggi. Model penilaian menggunakan kombinasi dari total peningkatan pemilik yang diungkapkan, perubahan dalam alokasi portofolio pada pemilik tersebut, dan metrik lainnya. Angka berkisar dari 0 hingga 100, dengan angka yang lebih tinggi menunjukkan tingkat akumulasi yang lebih tinggi dibandingkan dengan perusahaan sejenisnya, dan 50 adalah rata-ratanya.
Frekuensi Pembaruan: Setiap Hari
Lihat Ownership Explorer, yang menyediakan daftar perusahaan dengan peringkat tertinggi.
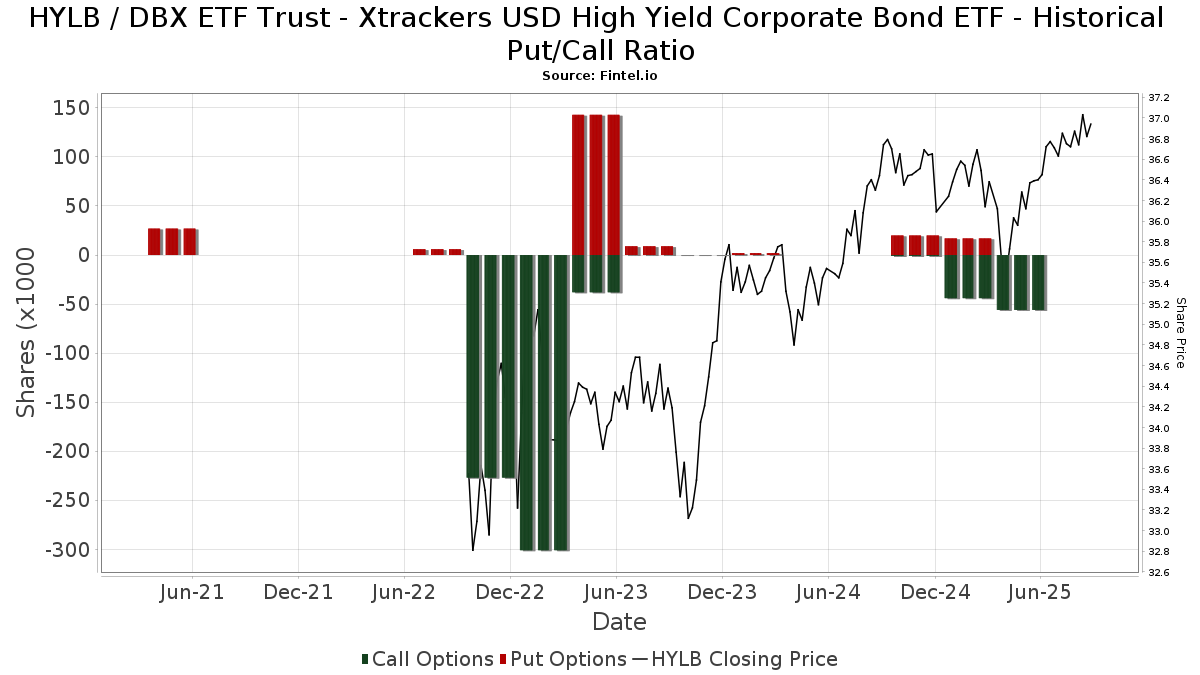
Rasio Put/Call Institusional
Selain melaporkan isu ekuitas dan utang standar, institusi dengan aset di bawah manajemen lebih dari 100 juta dolar AS juga harus mengungkapkan kepemilikan opsi put dan call mereka. Karena opsi put umumnya menunjukkan sentimen negatif, dan opsi call menunjukkan sentimen positif, kita dapat mengetahui sentimen institusional secara keseluruhan dengan memplot rasio put terhadap call. Grafik di sebelah kanan memplot rasio put/call historis untuk instrumen ini.
Menggunakan Rasio Put/Call sebagai indikator sentimen investor mengatasi salah satu kekurangan utama dari penggunaan total kepemilikan institusional, yaitu sejumlah besar aset yang dikelola diinvestasikan secara pasif untuk melacak indeks. Dana yang dikelola secara pasif biasanya tidak membeli opsi, sehingga indikator rasio put/call lebih akurat dalam melacak sentimen dana yang dikelola secara aktif.
Pengajuan 13F dan NPORT
Detail pada pengajuan 13F tersedia gratis. Detail pada pengajuan NP memerlukan keanggotaan premium. Baris berwarna hijau menunjukkan posisi baru. Baris berwarna merah menunjukkan posisi yang sudah ditutup. Klik tautan ini ikon untuk melihat riwayat transaksi selengkapnya.
Tingkatkan
untuk membuka data premium dan mengekspor ke Excel ![]() .
.
| Tanggal File | Sumber | Investor | Ketik | Presyo ng Avg (Silangan) |
Saham | Δ Saham (%) |
Dilaporkan Nilai ($1000) |
Nilai Δ (%) |
Alokasi Port (%) |
|
|---|---|---|---|---|---|---|---|---|---|---|
| 2025-08-14 | 13F | Navigoe, LLC | 0 | -100.00 | 0 | |||||
| 2025-08-26 | NP | Northern Lights Variable Trust - TOPS Moderate Growth ETF Portfolio Class 1 shares | 276,550 | 4.95 | 10,210 | 7.19 | ||||
| 2025-05-06 | 13F | Fpc Investment Advisory, Inc. | 0 | -100.00 | 0 | |||||
| 2025-08-13 | 13F | Continuum Advisory, LLC | 0 | -100.00 | 0 | |||||
| 2025-05-02 | 13F | United Community Bank | 0 | -100.00 | 0 | |||||
| 2025-08-08 | 13F | Financial Gravity Companies, Inc. | 677,665 | 15.61 | 25,019 | 18.30 | ||||
| 2025-05-13 | 13F | Adams Wealth Management | 6,486 | -4.25 | 234 | -4.10 | ||||
| 2025-07-28 | 13F | Toews Corp /adv | 628,100 | 23,189 | ||||||
| 2025-08-08 | 13F | Fortis Group Advisors, LLC | 106 | 0.00 | 4 | 0.00 | ||||
| 2025-08-04 | 13F | Arkadios Wealth Advisors | 15,245 | -0.55 | 563 | 1.44 | ||||
| 2025-08-13 | 13F | Renaissance Technologies Llc | 377,700 | -9.36 | 13,945 | -7.43 | ||||
| 2025-08-14 | 13F | Engineers Gate Manager LP | 0 | -100.00 | 0 | |||||
| 2025-08-14 | 13F | Great Valley Advisor Group, Inc. | 40,834 | -3.09 | 1,508 | -1.05 | ||||
| 2025-07-17 | 13F | Wolff Wiese Magana Llc | 4 | 0 | ||||||
| 2025-05-12 | 13F | Sandy Spring Bank | 743 | 18.50 | 27 | 18.18 | ||||
| 2025-07-21 | 13F | New Century Financial Group, LLC | 0 | -100.00 | 0 | |||||
| 2025-08-12 | 13F | LPL Financial LLC | 375,703 | -32.94 | 13,871 | -31.51 | ||||
| 2025-08-13 | 13F | Employees Retirement System of Texas | 470 | 2.17 | ||||||
| 2025-08-28 | NP | GPIFX - GuidePath(R) Flexible Income Allocation Fund Service Shares | 1,125,182 | 99.13 | 41,542 | 103.37 | ||||
| 2025-07-18 | 13F | Bartlett & Co. Wealth Management Llc | 31 | 0.00 | 1 | 0.00 | ||||
| 2025-05-13 | 13F | CacheTech Inc. | 6,486 | -4.25 | 234 | -4.10 | ||||
| 2025-08-14 | 13F | Bank Of America Corp /de/ | 21,218,380 | 8.85 | 783,383 | 11.17 | ||||
| 2025-05-16 | 13F/A | Kestra Investment Management, LLC | 0 | -100.00 | 0 | |||||
| 2025-07-24 | 13F | Us Bancorp \de\ | 2,312 | -40.09 | 85 | -38.85 | ||||
| 2025-08-26 | NP | Northern Lights Variable Trust - TOPS Growth ETF Portfolio Class 2 shares | 208,595 | 10.11 | 7,701 | 12.46 | ||||
| 2025-08-18 | 13F | Geneos Wealth Management Inc. | 5,892 | -0.81 | 218 | 1.40 | ||||
| 2025-07-17 | 13F | Beacon Capital Management, LLC | 15 | 1 | ||||||
| 2025-07-24 | 13F | Endeavor Private Wealth, Inc. | 8,363 | -47.24 | 309 | -46.25 | ||||
| 2025-08-14 | 13F | Colony Group, LLC | 411,888 | 4.46 | 15,207 | 6.68 | ||||
| 2025-05-01 | 13F | Rational Advisors Llc | 0 | -100.00 | 0 | |||||
| 2025-08-14 | 13F | Susquehanna International Group, Llp | 0 | -100.00 | 0 | |||||
| 2025-07-08 | 13F | Nbc Securities, Inc. | 18,329 | 109.55 | 1 | |||||
| 2025-08-12 | 13F | Jpmorgan Chase & Co | 223,441 | 1,103.04 | 8,249 | 1,129.36 | ||||
| 2025-07-25 | 13F | Allspring Global Investments Holdings, LLC | 8,410 | 0.00 | 310 | 1.97 | ||||
| 2025-08-14 | 13F | Aqr Capital Management Llc | 240,956 | 0.00 | 8,896 | 2.14 | ||||
| 2025-06-27 | NP | THY - Agility Shares Dynamic Tactical Income ETF | 253,100 | 7.29 | 9,119 | 5.68 | ||||
| 2025-08-14 | 13F | Horizon Investments, LLC | 838,233 | 68.30 | 30,621 | 71.83 | ||||
| 2025-05-14 | 13F | Truvestments Capital Llc | 0 | -100.00 | 0 | |||||
| 2025-07-30 | 13F | Brookstone Capital Management | 24,586 | -11.75 | 908 | -9.93 | ||||
| 2025-08-14 | 13F | Hurley Capital, LLC | 0 | -100.00 | 0 | |||||
| 2025-07-28 | 13F | Harbour Investments, Inc. | 705 | -0.28 | 26 | 4.00 | ||||
| 2025-08-13 | 13F | WCG Wealth Advisors LLC | 22,634 | -9.64 | 836 | -7.73 | ||||
| 2025-07-07 | 13F | Thurston, Springer, Miller, Herd & Titak, Inc. | 187 | 567.86 | 7 | 500.00 | ||||
| 2025-08-11 | 13F | Brown Brothers Harriman & Co | 3 | 0 | ||||||
| 2025-08-11 | 13F | Citigroup Inc | 143,475 | 86.07 | 5,297 | 90.06 | ||||
| 2025-08-14 | 13F | Sunbelt Securities, Inc. | 0 | -100.00 | 0 | |||||
| 2025-05-12 | 13F | Founders Financial Securities Llc | 0 | -100.00 | 0 | |||||
| 2025-08-14 | 13F | Kovitz Investment Group Partners, LLC | 219,160 | 8,091 | ||||||
| 2025-07-11 | 13F | Pinnacle Bancorp, Inc. | 41 | 0.00 | 2 | 0.00 | ||||
| 2025-08-13 | 13F | Hsbc Holdings Plc | 31,777 | 77.68 | 1,173 | 81.58 | ||||
| 2025-08-14 | 13F | Wells Fargo & Company/mn | 4,826,048 | -1.50 | 178,178 | 0.59 | ||||
| 2025-08-06 | 13F | AE Wealth Management LLC | 2,308 | 2.21 | 85 | 4.94 | ||||
| 2025-07-21 | 13F | Mendota Financial Group, LLC | 68 | 0.00 | 3 | 0.00 | ||||
| 2025-08-28 | NP | BTSAX - BTS Managed Income Fund Class A Shares | 23,613 | -10.89 | 872 | -8.99 | ||||
| 2025-08-13 | 13F | EverSource Wealth Advisors, LLC | 508 | -25.18 | 19 | -25.00 | ||||
| 2025-08-14 | 13F | Two Sigma Securities, Llc | 0 | -100.00 | 0 | |||||
| 2025-08-15 | 13F | Kestra Advisory Services, LLC | 48,877 | 0.99 | 1,805 | 3.14 | ||||
| 2025-08-07 | 13F | FDx Advisors, Inc. | 10,596 | -1.33 | 0 | |||||
| 2025-08-28 | NP | BTFAX - BTS Tactical Fixed Income Fund Class A Shares | 571,191 | -23.52 | 21,088 | -21.89 | ||||
| 2025-08-14 | 13F | Goldman Sachs Group Inc | 1,096,690 | -47.65 | 40,490 | -46.53 | ||||
| 2025-07-30 | 13F | Bogart Wealth, LLC | 205 | 52.99 | 8 | 75.00 | ||||
| 2025-05-14 | 13F | Van Hulzen Asset Management, LLC | 0 | -100.00 | 0 | |||||
| 2025-07-25 | 13F | Envestnet Portfolio Solutions, Inc. | 12,732 | -97.05 | 470 | -96.98 | ||||
| 2025-08-07 | 13F | Resources Investment Advisors, LLC. | 7,732 | -58.19 | 285 | -57.34 | ||||
| 2025-07-09 | 13F | Christopher J. Hasenberg, Inc | 55 | 0.00 | 2 | 100.00 | ||||
| 2025-07-18 | 13F | Truist Financial Corp | 14,320 | 23.19 | 529 | 25.71 | ||||
| 2025-07-28 | 13F | WealthPlan Investment Management, LLC | 14,210 | -0.55 | 525 | 1.55 | ||||
| 2025-08-26 | NP | TBFC - The Brinsmere Fund - Conservative ETF | 173,047 | -2.62 | 6,389 | -0.54 | ||||
| 2025-07-24 | NP | HTFNX - Horizon Tactical Fixed Income Fund Investor Class | 842,587 | -36.19 | 30,721 | -36.64 | ||||
| 2025-08-04 | 13F | Assetmark, Inc | 1,118,080 | 97.95 | 41,280 | 102.17 | ||||
| 2025-08-07 | 13F | PFG Advisors | 0 | -100.00 | 0 | |||||
| 2025-07-25 | 13F | Concord Wealth Partners | 4,293 | 0.96 | 159 | 3.27 | ||||
| 2025-08-11 | 13F | Performa Ltd (US), LLC | 1,298,956 | 8.25 | 47,957 | 10.56 | ||||
| 2025-07-24 | 13F | Robertson Stephens Wealth Management, LLC | 409,926 | 15,134 | ||||||
| 2025-08-05 | 13F | Tme Financial, Inc. | 6,100 | -4.73 | 225 | -2.60 | ||||
| 2025-08-05 | 13F | Key FInancial Inc | 8 | 0.00 | 0 | |||||
| 2025-08-01 | 13F | Koss-Olinger Consulting, LLC | 14,856 | 6.59 | 548 | 8.73 | ||||
| 2025-08-14 | 13F/A | Rockefeller Capital Management L.P. | 32,945 | 111.93 | 1,216 | 116.76 | ||||
| 2025-08-08 | 13F | Avantax Advisory Services, Inc. | 18,041 | -12.53 | 666 | -10.60 | ||||
| 2025-08-11 | 13F | Strategic Wealth Partners, Ltd. | 123 | 5 | ||||||
| 2025-08-11 | 13F | Banque Cantonale Vaudoise | 760 | 0.00 | 0 | |||||
| 2025-08-11 | 13F | Root Financial Partners, LLC | 6,560 | -0.26 | 242 | 2.11 | ||||
| 2025-08-05 | 13F | Fourth Dimension Wealth, LLC | 1,989 | -15.65 | 73 | -14.12 | ||||
| 2025-08-26 | NP | Northern Lights Variable Trust - TOPS Managed Risk Growth ETF Portfolio Class 1 shares | 115,635 | -3.01 | 4,269 | -0.93 | ||||
| 2025-08-13 | 13F | Jones Financial Companies Lllp | 2,835 | 32.17 | 104 | 35.06 | ||||
| 2025-07-29 | 13F | Koshinski Asset Management, Inc. | 13,208 | -0.22 | 488 | 1.88 | ||||
| 2025-08-05 | 13F | Huntington National Bank | 0 | -100.00 | ||||||
| 2025-07-25 | 13F | Cwm, Llc | 11,405 | 24.60 | 0 | |||||
| 2025-08-12 | 13F | MAI Capital Management | 559 | 0.00 | 21 | 0.00 | ||||
| 2025-08-13 | 13F | Tranquilli Financial Advisor LLC | 0 | -100.00 | 0 | |||||
| 2025-07-25 | 13F | Sequoia Financial Advisors, LLC | 6,929 | -13.47 | 256 | -11.76 | ||||
| 2025-07-07 | 13F | Investors Research Corp | 35 | 0.00 | 1 | 0.00 | ||||
| 2025-08-15 | 13F | Morgan Stanley | 585,926 | 14.81 | 21,632 | 17.26 | ||||
| 2025-07-24 | NP | AIHAX - Horizon Active Income Fund Advisor Class | 1,753 | -99.58 | 64 | -99.59 | ||||
| 2025-08-13 | 13F/A | StoneX Group Inc. | 0 | -100.00 | 0 | -100.00 | ||||
| 2025-08-11 | 13F | HighTower Advisors, LLC | 63,220 | 14.10 | 2,334 | 16.53 | ||||
| 2025-08-14 | 13F | Citadel Advisors Llc | Put | 0 | -100.00 | 0 | ||||
| 2025-05-15 | 13F | Tower Research Capital LLC (TRC) | 0 | -100.00 | 0 | |||||
| 2025-07-29 | 13F | Liberty Square Wealth Partners Llc | 57,532 | -12.49 | 2,124 | -10.61 | ||||
| 2025-06-27 | NP | THHYX - Toews Tactical Income Fund | 300,000 | -61.29 | 10,809 | -61.87 | ||||
| 2025-08-12 | 13F | Bokf, Na | 0 | -100.00 | 0 | |||||
| 2025-08-14 | 13F | Sentinus, LLC | 21,025 | 33.82 | 776 | 36.86 | ||||
| 2025-08-07 | 13F | Commerce Bank | 9,519 | 0.68 | 351 | 2.93 | ||||
| 2025-08-11 | 13F | Hexagon Capital Partners LLC | 0 | -100.00 | 0 | |||||
| 2025-07-22 | NP | DGFFX - Destinations Global Fixed Income Opportunities Fund Class I | 271,069 | 33.75 | 9,883 | 32.82 | ||||
| 2025-08-12 | 13F | BlackRock, Inc. | 360 | 13 | ||||||
| 2025-08-13 | 13F | Beacon Pointe Advisors, LLC | 9,030 | -1.24 | 333 | 0.91 | ||||
| 2025-07-15 | 13F | Revisor Wealth Management LLC | 0 | -100.00 | 0 | |||||
| 2025-08-14 | 13F | Comerica Bank | 42,725 | -4.58 | 1,577 | -2.53 | ||||
| 2025-07-09 | 13F | Westbourne Investments, Inc. | 7,515 | 0.00 | 277 | 2.21 | ||||
| 2025-07-15 | 13F | Financial Management Professionals, Inc. | 8 | 0.00 | 0 | |||||
| 2025-07-16 | 13F | St Germain D J Co Inc | 0 | -100.00 | 0 | |||||
| 2025-07-08 | 13F | Braun-Bostich & Associates Inc. | 9,005 | 332 | ||||||
| 2025-07-07 | 13F | Horizons Wealth Management | 3,823 | -40.03 | 141 | -38.70 | ||||
| 2025-04-23 | 13F | GenTrust, LLC | 0 | -100.00 | 0 | |||||
| 2025-07-29 | 13F | Regions Financial Corp | 419,906 | 0.84 | 15,503 | 2.99 | ||||
| 2025-08-13 | 13F | Transce3nd, LLC | 52 | 0.00 | 2 | 0.00 | ||||
| 2025-04-30 | 13F | Sofos Investments, Inc. | 631,250 | 8.41 | 22,820 | 11.25 | ||||
| 2025-08-12 | 13F | AlphaCore Capital LLC | 114 | 714.29 | 4 | |||||
| 2025-08-11 | 13F | Aptus Capital Advisors, LLC | 1,665 | 27.20 | 61 | 29.79 | ||||
| 2025-08-14 | 13F | Fmr Llc | 3,416 | 5.46 | 126 | 7.69 | ||||
| 2025-07-28 | 13F | Kiker Wealth Management, LLC | 64 | 68.42 | 2 | 100.00 | ||||
| 2025-08-12 | 13F | Deutsche Bank Ag\ | 2,384,675 | -0.11 | 88,042 | 2.02 | ||||
| 2025-08-05 | 13F | Bank Of Montreal /can/ | 9,585 | 20,736.96 | 354 | 35,200.00 | ||||
| 2025-08-11 | 13F | Lake Street Financial Llc | 0 | -100.00 | 0 | |||||
| 2025-07-25 | 13F | Atria Wealth Solutions, Inc. | 0 | -100.00 | 0 | |||||
| 2025-07-15 | 13F | Boyd Wealth Management, LLC | 323,073 | -0.84 | 11,928 | 1.27 | ||||
| 2025-05-07 | 13F | Objective Capital Management, LLC | 0 | -100.00 | 0 | |||||
| 2025-07-15 | 13F | Heritage Oak Wealth Advisors Llc | 99,711 | -0.71 | 3,681 | 1.40 | ||||
| 2025-07-22 | 13F | DAVENPORT & Co LLC | 9,786 | -12.41 | 361 | -10.42 | ||||
| 2025-08-14 | 13F | Voya Investment Management Llc | 4,458,140 | 2.23 | 164,595 | 4.40 | ||||
| 2025-07-29 | 13F | Activest Wealth Management | 0 | 0 | ||||||
| 2025-07-15 | 13F | Td Private Client Wealth Llc | 253,299 | 15.96 | 9,352 | 18.43 | ||||
| 2025-07-30 | 13F | BTS Asset Management, Inc. | 823,411 | -22.56 | 30,400 | -20.91 | ||||
| 2025-07-16 | 13F | ORG Partners LLC | 0 | -100.00 | 0 | |||||
| 2025-08-11 | 13F | Theory Financial Llc | 208,465 | 43.53 | 7,665 | 46.00 | ||||
| 2025-08-26 | NP | IDXKX - Voya Index Solution 2040 Portfolio Class ADV | 564,879 | 0.24 | 20,855 | 2.37 | ||||
| 2025-07-25 | NP | USCRX - Cornerstone Moderately Aggressive Fund | 286,722 | 0.00 | 10,454 | -0.71 | ||||
| 2025-07-22 | 13F | Merit Financial Group, LLC | 65,273 | 695.04 | 2,410 | 713.85 | ||||
| 2025-08-25 | 13F/A | Promus Capital, LLC | 18 | 0.00 | 1 | |||||
| 2025-08-13 | 13F | Flow Traders U.s. Llc | 16,084 | 1 | ||||||
| 2025-08-18 | 13F/A | National Bank Of Canada /fi/ | 267,000 | 20.40 | 9,858 | 22.97 | ||||
| 2025-08-18 | 13F | Front Row Advisors LLC | 40 | 0.00 | 1 | 0.00 | ||||
| 2025-08-06 | 13F | Commonwealth Equity Services, Llc | 38,189 | -69.53 | 1 | -75.00 | ||||
| 2025-07-25 | 13F | Prostatis Group LLC | 0 | -100.00 | 0 | -100.00 | ||||
| 2025-07-16 | 13F | Signaturefd, Llc | 33 | 1 | ||||||
| 2025-07-15 | 13F | GSB Wealth Management, LLC | 12 | 0.00 | 0 | |||||
| 2025-07-23 | 13F | Columbus Macro, LLC | 8,643 | -1.56 | 319 | 0.63 | ||||
| 2025-07-16 | 13F | Maridea Wealth Management LLC | 17,965 | -1.14 | 663 | 1.07 | ||||
| 2025-07-25 | NP | UCAGX - Cornerstone Aggressive Fund | 42,134 | 0.00 | 1,536 | -0.71 | ||||
| 2025-08-08 | 13F | Wiser Advisor Group LLC | 33,363 | 2.27 | 1,232 | 4.41 | ||||
| 2025-05-14 | 13F | BOK Financial Private Wealth, Inc. | 0 | -100.00 | 0 | |||||
| 2025-07-03 | 13F | Whitcomb & Hess, Inc. | 18,188 | 0.80 | 671 | 2.91 | ||||
| 2025-08-14 | 13F | Aspen Grove Capital, LLC | 0 | -100.00 | 0 | |||||
| 2025-08-13 | 13F | NEOS Investment Management LLC | 1,200,718 | 22.74 | 44,091 | 25.28 | ||||
| 2025-08-07 | 13F | Allworth Financial LP | 2,290 | -5.25 | 85 | -3.45 | ||||
| 2025-08-29 | 13F | Total Investment Management Inc | 17 | 1 | ||||||
| 2025-08-12 | 13F | Proequities, Inc. | 0 | 0 | ||||||
| 2025-08-01 | 13F | May Hill Capital, LLC | 0 | -100.00 | 0 | |||||
| 2025-08-14 | 13F | Smartleaf Asset Management LLC | 2 | 0.00 | 0 | |||||
| 2025-08-11 | 13F | Wbi Investments, Inc. | 33,775 | -4.15 | 1,247 | -2.12 | ||||
| 2025-08-14 | 13F | Mml Investors Services, Llc | 20,186 | 1.38 | 1 | |||||
| 2025-07-24 | NP | HYGY - NEOS Enhanced Income Credit Select ETF | 1,226,968 | 23.24 | 44,735 | 22.36 | ||||
| 2025-04-17 | 13F | Stewardship Advisors, LLC | 0 | -100.00 | 0 | |||||
| 2025-07-25 | NP | USBSX - Cornerstone Moderate Fund | 127,113 | 0.00 | 4,635 | -0.71 | ||||
| 2025-08-14 | 13F | Ameriprise Financial Inc | 679,733 | 0.74 | 25,005 | 2.49 | ||||
| 2025-08-14 | 13F | Raymond James Financial Inc | 211,199 | -25.41 | 7,797 | -23.83 | ||||
| 2025-07-16 | 13F | ORG Wealth Partners, LLC | 46 | 0.00 | 2 | 0.00 | ||||
| 2025-08-08 | 13F | Larson Financial Group LLC | 330 | -74.46 | 12 | -73.91 | ||||
| 2025-08-14 | 13F | Wiley Bros.-aintree Capital, Llc | 105,980 | 9.57 | 3,915 | 12.47 | ||||
| 2025-07-21 | 13F | Ameriflex Group, Inc. | 1,017 | 9.00 | 37 | 12.12 | ||||
| 2025-05-13 | 13F | Franklin Resources Inc | 0 | -100.00 | 0 | |||||
| 2025-07-17 | 13F | Keystone Global Partners, LLC | 0 | -100.00 | 0 | |||||
| 2025-08-27 | 13F/A | Brinker Capital Investments, LLC | 11,046 | 408 | ||||||
| 2025-08-01 | 13F | Solstein Capital, LLC | 11 | 0 | ||||||
| 2025-07-14 | 13F | AdvisorNet Financial, Inc | 156 | -21.21 | 6 | -28.57 | ||||
| 2025-08-19 | 13F | National Asset Management, Inc. | 0 | -100.00 | 0 | |||||
| 2025-08-06 | 13F | Atlantic Union Bankshares Corp | 631 | 23 | ||||||
| 2025-04-08 | 13F | Avenue 1 Advisors, LLC | 0 | -100.00 | 0 | |||||
| 2025-07-17 | 13F | Hengehold Capital Management Llc | 23,844 | -1.57 | 880 | 0.57 | ||||
| 2025-08-11 | 13F | Rothschild Investment Llc | 12 | 0 | ||||||
| 2025-08-05 | 13F | Optivise Advisory Services LLC | 44,195 | 1,632 | ||||||
| 2025-07-18 | 13F/A | MJT & Associates Financial Advisory Group, Inc. | 5,035 | -0.18 | 186 | 1.65 | ||||
| 2025-08-13 | 13F | Northwestern Mutual Wealth Management Co | 1,988 | 9.59 | 73 | 12.31 | ||||
| 2025-07-21 | 13F | Curran Financial Partners, LLC | 120,728 | 15.53 | 4,457 | 18.00 | ||||
| 2025-08-11 | 13F | Principal Securities, Inc. | 21,655 | -75.32 | 800 | -74.76 | ||||
| 2025-06-20 | NP | ABXB - TrimTabs Donoghue Forlines Tactical High Yield ETF | 1,955 | -83.12 | 70 | -83.45 | ||||
| 2025-08-11 | 13F | Delta Asset Management Llc/tn | 147 | 0.00 | 5 | 0.00 | ||||
| 2025-08-13 | 13F | Capital Analysts, Inc. | 2,522 | 79.37 | 0 | |||||
| 2025-04-29 | 13F | Pensionmark Financial Group, Llc | 0 | -100.00 | 0 | |||||
| 2025-07-14 | 13F | Iams Wealth Management, Llc | 22,706 | 838 | ||||||
| 2025-08-07 | 13F | Retirement Investment Advisors, Inc. | 508,003 | 5.34 | 18,755 | 7.58 | ||||
| 2025-08-14 | 13F | MIRAE ASSET GLOBAL ETFS HOLDINGS Ltd. | 329,612 | 10.18 | 12,130 | 12.32 | ||||
| 2025-08-12 | 13F | Ameritas Investment Partners, Inc. | 2,591 | -37.75 | 96 | -36.67 | ||||
| 2025-08-05 | 13F | Marion Wealth Management | 171,253 | 2.34 | 6,323 | 4.51 | ||||
| 2025-08-13 | 13F | Baird Financial Group, Inc. | 104,831 | 2.13 | 3,870 | 4.31 | ||||
| 2025-07-31 | 13F | Wright Fund Managment, LLC | 2,470,000 | 0.00 | 89,290 | 0.00 | ||||
| 2025-08-13 | 13F | Russell Investments Group, Ltd. | 0 | -100.00 | 0 | |||||
| 2025-08-07 | 13F | Efficient Advisors, LLC | 0 | -100.00 | 0 | |||||
| 2025-08-14 | 13F | Bnp Paribas Arbitrage, Sa | 69,903 | 2,581 | ||||||
| 2025-07-10 | 13F | Wealth Enhancement Advisory Services, Llc | 43,974 | -37.93 | 1,617 | -36.86 | ||||
| 2025-08-12 | 13F | Wayfinding Financial, LLC | 0 | -100.00 | 0 | |||||
| 2025-08-05 | 13F | GPS Wealth Strategies Group, LLC | 135 | 2,600.00 | 5 | |||||
| 2025-05-15 | 13F | Rakuten Investment Management, Inc. | 248,156 | 16.94 | 8,958 | 14.35 | ||||
| 2025-07-21 | 13F | Barrett & Company, Inc. | 0 | -100.00 | 0 | |||||
| 2025-08-01 | 13F | Ashton Thomas Private Wealth, LLC | 0 | -100.00 | 0 | |||||
| 2025-05-16 | 13F | Coppell Advisory Solutions LLC | 0 | -100.00 | 0 | |||||
| 2025-05-02 | 13F | Leelyn Smith, LLC | 0 | -100.00 | 0 | |||||
| 2025-08-08 | 13F | Pnc Financial Services Group, Inc. | 2,770,286 | 16.45 | 102,279 | 18.93 | ||||
| 2025-07-24 | 13F | Ronald Blue Trust, Inc. | 1,109 | 176.56 | 41 | 185.71 | ||||
| 2025-08-12 | 13F | Steward Partners Investment Advisory, Llc | 11,454 | -28.02 | 423 | -26.61 | ||||
| 2025-07-17 | 13F | Fifth Third Securities, Inc. | 38,692 | -4.77 | 1,429 | -2.72 | ||||
| 2025-07-08 | 13F | Parallel Advisors, LLC | 197 | 7.65 | 7 | 16.67 | ||||
| 2025-07-30 | 13F | Onyx Bridge Wealth Group LLC | 55,498 | -3.73 | 2,049 | -1.68 | ||||
| 2025-08-26 | NP | IDXHX - Voya Index Solution 2030 Portfolio Class S | 511,356 | -0.26 | 18,879 | 1.87 | ||||
| 2025-04-11 | 13F | Davis Capital Management | 359 | 0.00 | 13 | 0.00 | ||||
| 2025-08-08 | 13F | Hartland & Co., LLC | 453,808 | -14.84 | 16,755 | -13.03 | ||||
| 2025-08-12 | NP | KAMIX - Kensington Managed Income Fund Institutional Class Shares | 1,889,800 | 94.82 | 69,771 | 98.98 | ||||
| 2025-08-12 | 13F | Charles Schwab Investment Management Inc | 6,310,158 | -3.54 | 232,971 | -1.48 | ||||
| 2025-07-22 | 13F | Simplicity Wealth,LLC | 23,256 | 110.06 | 859 | 114.50 | ||||
| 2025-08-06 | 13F | Adviser Investments LLC | 0 | -100.00 | 0 | |||||
| 2025-08-12 | 13F | TCTC Holdings, LLC | 1,961 | 72 | ||||||
| 2025-04-14 | 13F | Umb Bank N A/mo | 0 | -100.00 | 0 | |||||
| 2025-07-17 | 13F | Sound Income Strategies, LLC | 2,755 | -2.30 | 102 | 0.00 | ||||
| 2025-07-21 | 13F | Ameritas Advisory Services, LLC | 269 | 10 | ||||||
| 2025-08-07 | 13F | Vise Technologies, Inc. | 31,863 | 143.53 | 1,176 | 149.15 | ||||
| 2025-08-26 | NP | Northern Lights Variable Trust - TOPS Managed Risk Balanced ETF Portfolio Class 2 shares | 55,809 | -3.12 | 2,060 | -1.06 | ||||
| 2025-08-13 | 13F | Townsquare Capital Llc | 0 | -100.00 | 0 | |||||
| 2025-07-25 | 13F | Concurrent Investment Advisors, LLC | 5,618 | 207 | ||||||
| 2025-08-14 | 13F | CoreCap Advisors, LLC | 1,045 | 150.60 | 39 | 153.33 | ||||
| 2025-07-14 | 13F | Park Avenue Securities Llc | 8,263 | -13.97 | 0 | |||||
| 2025-08-14 | 13F | GWM Advisors LLC | 22,985 | 35.56 | 849 | 38.56 | ||||
| 2025-08-14 | 13F | UBS Group AG | 283,892 | -69.42 | 10,481 | -68.77 | ||||
| 2025-08-26 | NP | ISDAX - Voya Index Solution 2025 Portfolio Class ADV | 938,990 | 11.77 | 34,668 | 14.15 | ||||
| 2025-08-28 | NP | Northern Lights Fund Trust - Sierra Tactical Bond Fund Investor Class Shares | 2,755,500 | 11.56 | 101,733 | 13.94 | ||||
| 2025-04-15 | 13F | Transform Wealth, LLC | 166,491 | -13.65 | 6,019 | -13.48 | ||||
| 2025-08-14 | 13F | Jane Street Group, Llc | 0 | -100.00 | 0 | |||||
| 2025-08-06 | 13F | First Horizon Advisors, Inc. | 323 | -94.28 | 12 | -94.61 | ||||
| 2025-08-13 | 13F | Virtue Capital Management, LLC | 23,438 | 865 | ||||||
| 2025-07-31 | 13F | CVA Family Office, LLC | 65 | 0.00 | 2 | 0.00 | ||||
| 2025-08-14 | 13F | Prelude Capital Management, Llc | 0 | -100.00 | 0 | |||||
| 2025-08-14 | 13F | Royal Bank Of Canada | 2,467,457 | -28.59 | 91,099 | -27.07 | ||||
| 2025-07-15 | 13F | Fifth Third Bancorp | 557,239 | -14.27 | 20,573 | -12.44 | ||||
| 2025-07-24 | 13F | IFP Advisors, Inc | 2,254 | 17.89 | 83 | 20.29 | ||||
| 2025-08-13 | 13F | Congress Wealth Management LLC / DE / | 54,176 | 2.91 | 2,000 | 5.10 | ||||
| 2025-08-26 | NP | Northern Lights Variable Trust - TOPS Balanced ETF Portfolio Class 1 shares | 144,821 | 2.22 | 5,347 | 4.39 | ||||
| 2025-07-15 | 13F | World Equity Group, Inc. | 17,659 | 652 | ||||||
| 2025-07-09 | 13F | Dynamic Advisor Solutions LLC | 181,140 | 4.39 | 6,688 | 6.62 | ||||
| 2025-08-13 | 13F | Amundi | 226,793 | -31.17 | 8,339 | -29.06 | ||||
| 2025-08-26 | NP | ISKAX - Voya Index Solution Income Portfolio Class ADV | 605,895 | -2.25 | 22,370 | -0.17 | ||||
| 2025-08-05 | 13F | Centennial Bank/AR/ | 1,056 | 0.00 | 39 | 0.00 | ||||
| 2025-08-12 | 13F | Prudential Plc | 880,259 | -46.24 | 32,499 | -45.10 | ||||
| 2025-08-13 | 13F | Quadrature Capital Ltd | 180,946 | 6,681 | ||||||
| 2025-08-14 | 13F | Headlands Technologies LLC | 0 | -100.00 | 0 | -100.00 | ||||
| 2025-05-09 | 13F | GeoWealth Management, LLC | 0 | -100.00 | 0 | |||||
| 2025-08-05 | 13F | Bank of New York Mellon Corp | 0 | -100.00 | 0 | |||||
| 2025-08-07 | 13F | 1620 Investment Advisors, Inc. | 206 | 0.00 | 8 | 0.00 | ||||
| 2025-08-26 | NP | ISEIX - Voya Index Solution 2035 Portfolio Class I | 867,248 | -0.48 | 32,019 | 1.64 | ||||
| 2025-07-17 | 13F | C2C Wealth Management, LLC | 38,298 | 0.00 | 1,414 | 2.10 | ||||
| 2025-08-12 | 13F | American Century Companies Inc | 1,459,555 | -0.32 | 53,887 | 1.81 | ||||
| 2025-08-14 | 13F | Betterment LLC | 263,187 | -8.22 | 10 | -10.00 | ||||
| 2025-08-11 | 13F | HHM Wealth Advisors, LLC | 718 | 0.00 | 27 | 4.00 | ||||
| 2025-08-12 | 13F | Coldstream Capital Management Inc | 0 | -100.00 | 0 | |||||
| 2025-08-13 | 13F | Kilter Group LLC | 8 | 0 | ||||||
| 2025-08-14 | 13F | Citadel Advisors Llc | Call | 56,600 | 26.91 | 2,090 | 29.59 | |||
| 2025-08-04 | 13F | Atria Investments Llc | 137,038 | 42.34 | 5,059 | 45.37 | ||||
| 2025-04-22 | 13F | Castleview Partners, Llc | 0 | -100.00 | 0 | |||||
| 2025-08-19 | 13F | Delos Wealth Advisors, LLC | 46 | 2 | ||||||
| 2025-09-04 | 13F/A | Advisor Group Holdings, Inc. | 36,837 | 17.36 | 1,360 | 19.82 | ||||
| 2025-07-11 | 13F | Farther Finance Advisors, LLC | 4,037 | 1.46 | 149 | 4.20 | ||||
| 2025-08-01 | 13F | Envestnet Asset Management Inc | 2,470,463 | -48.14 | 91,209 | -47.04 | ||||
| 2025-08-12 | 13F | Kensington Asset Management, LLC | 1,889,800 | 94.82 | 69,771 | 98.98 | ||||
| 2025-08-12 | 13F | Richard W. Paul & Associates, LLC | 31 | 0.00 | 1 | 0.00 | ||||
| 2025-08-14 | 13F | Citadel Advisors Llc | 18,744 | 692 | ||||||
| 2025-08-14 | 13F | Stifel Financial Corp | 11,144 | 6.76 | 411 | 9.02 | ||||
| 2025-08-14 | 13F | Mercer Global Advisors Inc /adv | 9,253 | -32.88 | 342 | -31.53 | ||||
| 2025-08-13 | 13F | Edgestream Partners, L.P. | 12,072 | 47.80 | 446 | 50.85 | ||||
| 2025-04-04 | 13F | Legacy Private Trust Co. | 0 | -100.00 | 0 | |||||
| 2025-07-25 | NP | UCMCX - Cornerstone Moderately Conservative Fund | 20,332 | 0.00 | 741 | -0.67 | ||||
| 2025-07-23 | 13F | Prime Capital Investment Advisors, LLC | 7,503 | -2.37 | 277 | 0.00 | ||||
| 2025-08-26 | NP | ISJAX - Voya Index Solution 2045 Portfolio Class ADV | 728,264 | 1.23 | 26,888 | 3.39 | ||||
| 2025-07-31 | 13F | Wealthfront Advisers Llc | 1,146,590 | 7.73 | 42,332 | 10.02 | ||||
| 2025-07-23 | 13F | Valmark Advisers, Inc. | 4,658,164 | 3.28 | 171,979 | 5.48 | ||||
| 2025-08-19 | 13F | Newbridge Financial Services Group, Inc. | 0 | -100.00 | 0 | |||||
| 2025-04-28 | 13F | Mutual Advisors, LLC | 0 | -100.00 | 0 | -100.00 | ||||
| 2025-05-15 | 13F | Colton Groome Financial Advisors, Llc | 0 | -100.00 | 0 | |||||
| 2025-08-06 | 13F | Aspect Partners, LLC | 242 | 9 | ||||||
| 2025-07-31 | 13F | Cambridge Investment Research Advisors, Inc. | 109,676 | -28.68 | 4 | -20.00 | ||||
| 2025-07-30 | 13F | Strategic Blueprint, LLC | 9,471 | -3.19 | 350 | -1.13 | ||||
| 2025-08-06 | 13F | Penserra Capital Management LLC | 380,896 | -0.80 | 14 | 7.69 | ||||
| 2025-08-08 | 13F | Cercano Management LLC | 706,147 | 0.00 | 26,071 | 2.13 | ||||
| 2025-08-08 | 13F | Cetera Investment Advisers | 39,488 | -88.83 | 1,458 | -88.60 | ||||
| 2025-07-16 | 13F | Perigon Wealth Management, LLC | 47,418 | -0.15 | 1,751 | 1.98 | ||||
| 2025-08-14 | 13F | Hrt Financial Lp | 78,475 | 67.16 | 3 | 100.00 | ||||
| 2025-08-26 | NP | Northern Lights Variable Trust - TOPS Conservative ETF Portfolio Class 1 shares | 45,253 | 1.91 | 1,671 | 4.05 | ||||
| 2025-07-18 | 13F | Martel Wealth Advisors Inc | 69,350 | -1.44 | 2,560 | 0.67 | ||||
| 2025-07-25 | NP | HYRM - Xtrackers Risk Managed USD High Yield Strategy ETF | 1,230,279 | 1.08 | 44,856 | 0.36 | ||||
| 2025-05-08 | 13F | Moors & Cabot, Inc. | 0 | -100.00 | 0 | |||||
| 2025-08-14 | 13F | Graney & King, LLC | 6 | 0.00 | 0 | |||||
| 2025-08-08 | 13F | Creative Planning | 6,195 | -24.90 | 229 | -23.49 | ||||
| 2025-08-13 | 13F | Johnson Financial Group, Inc. | 4,700 | -9.62 | 174 | -7.49 | ||||
| 2025-05-01 | 13F | Quest 10 Wealth Builders, Inc. | 5 | 0.00 | 0 | |||||
| 2025-07-18 | 13F | SigFig Wealth Management, LLC | 22,005 | 10.10 | 810 | 12.21 | ||||
| 2025-05-14 | 13F | Oarsman Capital, Inc. | 0 | -100.00 | 0 | -100.00 | ||||
| 2025-08-26 | NP | Northern Lights Variable Trust - TOPS Managed Risk Flex ETF Portfolio | 122,902 | -4.89 | 4,538 | -2.87 | ||||
| 2025-05-08 | 13F | We Are One Seven, LLC | 0 | -100.00 | 0 | |||||
| 2025-08-14 | 13F | Toroso Investments, LLC | 61,166 | 2,246 | ||||||
| 2025-07-29 | NP | JOJO - ATAC Credit Rotation ETF | 70,336 | 185.99 | 2,564 | 185.84 | ||||
| 2025-08-14 | 13F | Old Mission Capital Llc | 139,886 | 5,165 | ||||||
| 2025-07-08 | 13F | Webster Bank, N. A. | 983 | -56.16 | 36 | -55.56 | ||||
| 2025-08-14 | 13F | Millennium Management Llc | 0 | -100.00 | 0 | |||||
| 2025-08-14 | 13F | Hilltop Holdings Inc. | 29,724 | 2.12 | 1,097 | 4.28 | ||||
| 2025-08-15 | 13F | American Family Investments, Inc. | 284,808 | 0.00 | 10,515 | 2.14 | ||||
| 2025-08-26 | NP | TBFG - The Brinsmere Fund - Growth ETF | 207,849 | 0.77 | 7,674 | 2.91 | ||||
| 2025-07-09 | 13F | VisionPoint Advisory Group, LLC | 79,396 | 618.52 | 2,931 | 634.59 | ||||
| 2025-08-12 | 13F | CIBC Private Wealth Group, LLC | 189 | 0.00 | 7 | 0.00 | ||||
| 2025-04-25 | 13F | Hutchens & Kramer Investment Management Group, LLC | 0 | -100.00 | 0 | |||||
| 2025-07-24 | 13F | rebel Financial LLC | 112,614 | 4,158 | ||||||
| 2025-08-26 | NP | Northern Lights Variable Trust - TOPS Managed Risk Moderate Growth ETF Portfolio Class 1 shares | 121,704 | -4.40 | 4,493 | -2.37 | ||||
| 2025-08-13 | 13F | Victory Capital Management Inc | 476,301 | 0.00 | 17,585 | 2.13 | ||||
| 2025-04-25 | 13F | Smallwood Wealth Investment Management, LLC | 11 | 0 | ||||||
| 2025-07-17 | 13F | Nelson, Van Denburg & Campbell Wealth Management Group, LLC | 306,381 | 1.38 | 11,312 | 3.54 | ||||
| 2025-07-15 | 13F | Fortitude Family Office, LLC | 0 | -100.00 | 0 | |||||
| 2025-08-12 | 13F | O'shaughnessy Asset Management, Llc | 1 | -92.86 | 0 | |||||
| 2025-08-14 | 13F | Gotham Asset Management, LLC | 7,729 | 285 | ||||||
| 2025-08-12 | 13F | Global Retirement Partners, LLC | 2,001 | -12.54 | 74 | -10.98 | ||||
| 2025-08-06 | 13F | Wedbush Securities Inc | 5,994 | -6.26 | 0 | |||||
| 2025-05-15 | 13F | Manufacturers Life Insurance Company, The | 0 | -100.00 | 0 | |||||
| 2025-07-14 | 13F | Sowell Financial Services LLC | 10,817 | 0.45 | 399 | 2.57 | ||||
| 2025-07-10 | 13F | Global Financial Private Client, LLC | 15,651 | 3.92 | 578 | 6.07 |