Mga Batayang Estadistika
| Pemilik Institusional | 275 total, 275 long only, 0 short only, 0 long/short - change of 0.73% MRQ |
| Alokasi Portofolio Rata-rata | 0.9919 % - change of -1.57% MRQ |
| Saham Institusional (Jangka Panjang) | 86,379,251 (ex 13D/G) - change of 2.36MM shares 2.80% MRQ |
| Nilai Institusional (Jangka Panjang) | $ 4,846,997 USD ($1000) |
Kepemilikan Institusional dan Pemegang Saham
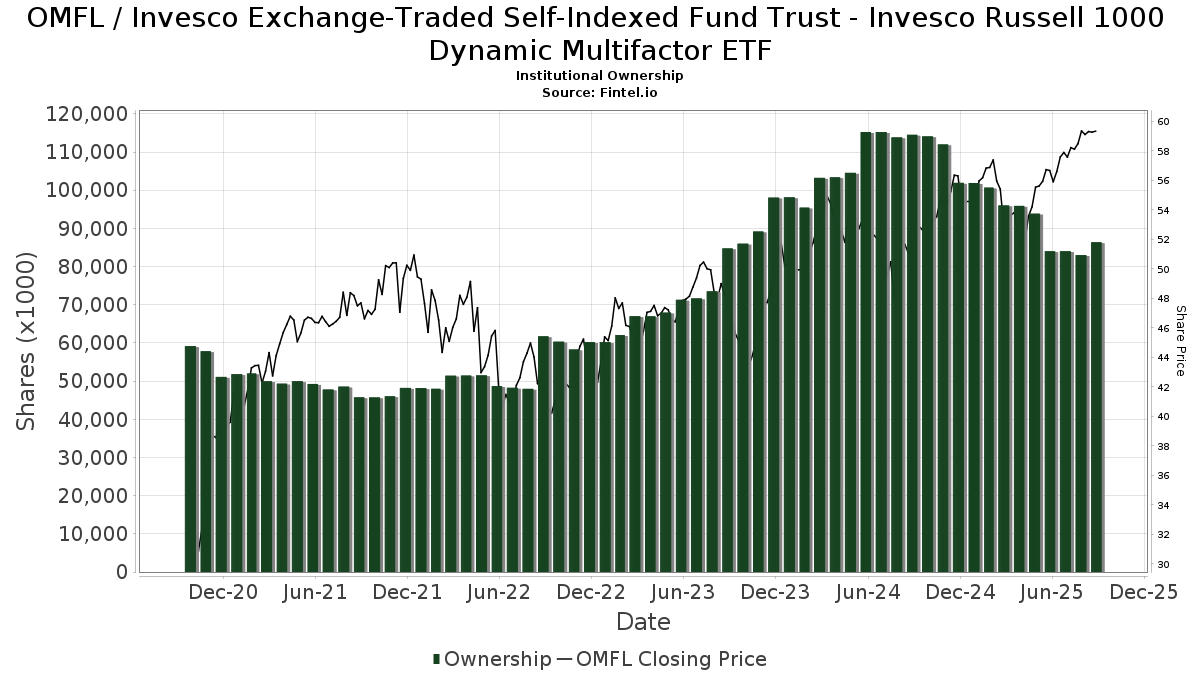
Invesco Exchange-Traded Self-Indexed Fund Trust - Invesco Russell 1000 Dynamic Multifactor ETF (US:OMFL) memiliki 275 pemilik institusional dan pemegang saham yang telah mengajukan formulir 13D/G atau 13F kepada Komisi Bursa Efek (Securities Exchange Commission/SEC). Lembaga-lembaga ini memegang total 86,379,251 saham. Pemegang saham terbesar meliputi Invesco Ltd., Balentine LLC, Arizona PSPRS Trust, Morgan Stanley, AIM GROWTH SERIES (INVESCO GROWTH SERIES) - Invesco Oppenheimer Portfolio Series: Active Allocation Fund Class R5, AIM INVESTMENT FUNDS (INVESCO INVESTMENT FUNDS) - Invesco Oppenheimer Global Allocation Fund Class R, AIM GROWTH SERIES (INVESCO GROWTH SERIES) - Invesco Oppenheimer Portfolio Series: Moderate Investor Fund Class C, LPL Financial LLC, Bank of New York Mellon Corp, and AADAX - INVESCO Growth Allocation Fund Class A .
Struktur kepemilikan institusional Invesco Exchange-Traded Self-Indexed Fund Trust - Invesco Russell 1000 Dynamic Multifactor ETF (BATS:OMFL) menunjukkan posisi terkini di perusahaan oleh institusi dan dana, serta perubahan terbaru dalam ukuran posisi. Pemegang saham utama dapat mencakup investor individu, reksa dana, dana lindung nilai, atau institusi. Jadwal 13D menunjukkan bahwa investor memegang (atau pernah memegang) lebih dari 5% saham perusahaan dan bermaksud (atau pernah bermaksud) untuk secara aktif mengejar perubahan strategi bisnis. Jadwal 13G menunjukkan investasi pasif lebih dari 5%.
The share price as of September 5, 2025 is 59.39 / share. Previously, on September 9, 2024, the share price was 50.51 / share. This represents an increase of 17.58% over that period.
Skor Sentimen Dana
Skor Sentimen Dana (sebelumnya dikenal sebagai Skor Akumulasi Kepemilikan) menemukan saham-saham yang paling banyak dibeli oleh dana. Ini adalah hasil dari model kuantitatif multi-faktor yang canggih yang mengidentifikasi perusahaan dengan tingkat akumulasi institusional tertinggi. Model penilaian menggunakan kombinasi dari total peningkatan pemilik yang diungkapkan, perubahan dalam alokasi portofolio pada pemilik tersebut, dan metrik lainnya. Angka berkisar dari 0 hingga 100, dengan angka yang lebih tinggi menunjukkan tingkat akumulasi yang lebih tinggi dibandingkan dengan perusahaan sejenisnya, dan 50 adalah rata-ratanya.
Frekuensi Pembaruan: Setiap Hari
Lihat Ownership Explorer, yang menyediakan daftar perusahaan dengan peringkat tertinggi.
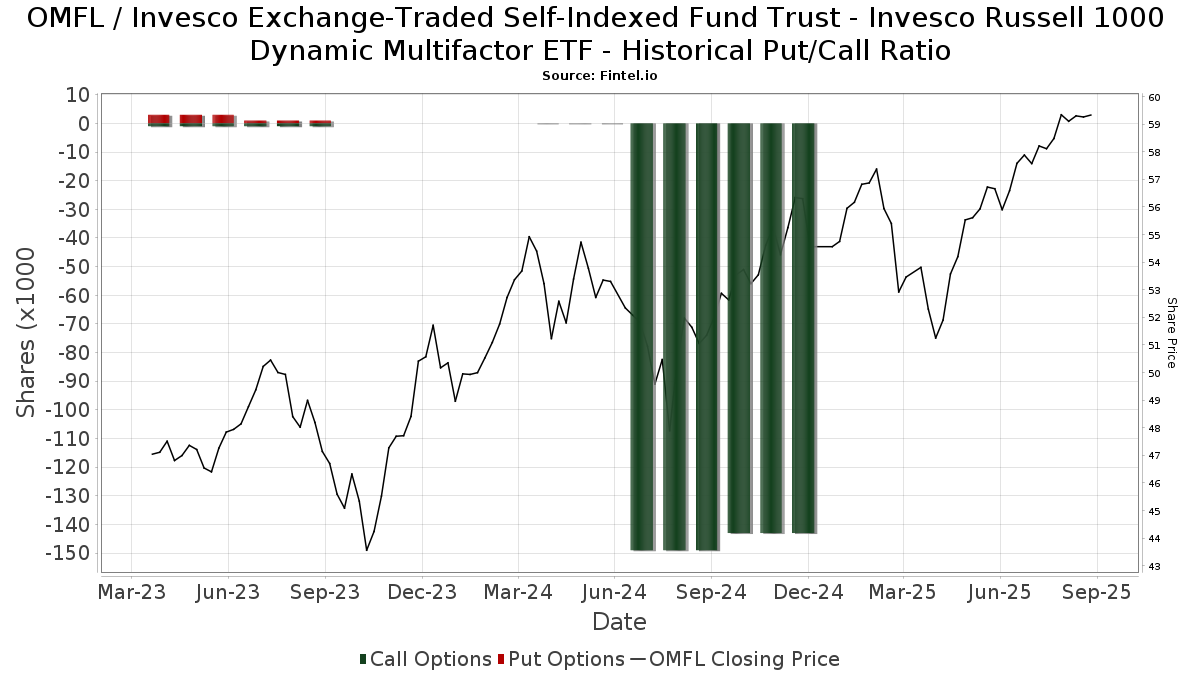
Rasio Put/Call Institusional
Selain melaporkan isu ekuitas dan utang standar, institusi dengan aset di bawah manajemen lebih dari 100 juta dolar AS juga harus mengungkapkan kepemilikan opsi put dan call mereka. Karena opsi put umumnya menunjukkan sentimen negatif, dan opsi call menunjukkan sentimen positif, kita dapat mengetahui sentimen institusional secara keseluruhan dengan memplot rasio put terhadap call. Grafik di sebelah kanan memplot rasio put/call historis untuk instrumen ini.
Menggunakan Rasio Put/Call sebagai indikator sentimen investor mengatasi salah satu kekurangan utama dari penggunaan total kepemilikan institusional, yaitu sejumlah besar aset yang dikelola diinvestasikan secara pasif untuk melacak indeks. Dana yang dikelola secara pasif biasanya tidak membeli opsi, sehingga indikator rasio put/call lebih akurat dalam melacak sentimen dana yang dikelola secara aktif.
Pengajuan 13D/G
Kami menyajikan pengajuan 13D/G secara terpisah dari pengajuan 13F karena perlakuan yang berbeda oleh SEC. Pengajuan 13D/G dapat diajukan oleh kelompok investor (dengan satu pemimpin), sedangkan pengajuan 13F tidak bisa. Hal ini mengakibatkan situasi di mana seorang investor dapat mengajukan 13D/G yang melaporkan satu nilai untuk total saham (mewakili semua saham yang dimiliki oleh kelompok investor), tetapi kemudian mengajukan 13F yang melaporkan nilai yang berbeda untuk total saham (mewakili kepemilikan mereka sendiri). Ini berarti bahwa kepemilikan saham dari pengajuan 13D/G dan pengajuan 13F seringkali tidak dapat dibandingkan secara langsung, sehingga kami menyajikannya secara terpisah.
Catatan: Mulai 16 Mei 2021, kami tidak lagi menampilkan pemilik yang belum mengajukan 13D/G dalam setahun terakhir. Sebelumnya, kami menampilkan riwayat lengkap pengajuan 13D/G. Secara umum, entitas yang diwajibkan untuk mengajukan pengajuan 13D/G harus mengajukan setidaknya setiap tahun sebelum mengirimkan pengajuan penutupan. Namun, terkadang dana keluar dari posisi tanpa mengirimkan pengajuan penutupan (misalnya, mereka menghentikan operasi), sehingga menampilkan riwayat lengkap terkadang menyebabkan kebingungan tentang kepemilikan saat ini. Untuk mencegah kebingungan, kami sekarang hanya menampilkan pemilik 'saat ini' - yaitu - pemilik yang telah mengajukan dalam setahun terakhir.
Upgrade to unlock premium data.
| Tanggal File | Formulir | Investor | Sebelumnya Saham |
Terbaru Saham |
Δ Saham (Persen) |
Kepemilikan (Persen) |
Δ Pagmamay-ari (Persen) |
|
|---|---|---|---|---|---|---|---|---|
| 2025-08-07 | Invesco Ltd. | 18,974,344 | 20,645,448 | 8.81 | 24.10 | 9.55 |
Pengajuan 13F dan NPORT
Detail pada pengajuan 13F tersedia gratis. Detail pada pengajuan NP memerlukan keanggotaan premium. Baris berwarna hijau menunjukkan posisi baru. Baris berwarna merah menunjukkan posisi yang sudah ditutup. Klik tautan ini ikon untuk melihat riwayat transaksi selengkapnya.
Tingkatkan
untuk membuka data premium dan mengekspor ke Excel ![]() .
.
| Tanggal File | Sumber | Investor | Ketik | Presyo ng Avg (Silangan) |
Saham | Δ Saham (%) |
Dilaporkan Nilai ($1000) |
Nilai Δ (%) |
Alokasi Port (%) |
|
|---|---|---|---|---|---|---|---|---|---|---|
| 2025-08-08 | 13F | Gts Securities Llc | 0 | -100.00 | 0 | |||||
| 2025-07-16 | 13F | Moisand Fitzgerald Tamayo, LLC | 0 | -100.00 | 0 | |||||
| 2025-07-10 | 13F | Stewardship Advisors, LLC | 12,990 | -22.66 | 751 | -16.20 | ||||
| 2025-08-08 | 13F | Fortis Group Advisors, LLC | 0 | -100.00 | 0 | |||||
| 2025-08-12 | 13F | Solano Wealth Investment Advisors LLC | 155,576 | -2.30 | 8,989 | 5.90 | ||||
| 2025-08-06 | 13F | AE Wealth Management LLC | 2,459 | -15.21 | 142 | -7.79 | ||||
| 2025-08-04 | 13F | Creative Financial Designs Inc /adv | 78 | 0.00 | 5 | 0.00 | ||||
| 2025-08-12 | 13F | Proequities, Inc. | 0 | 0 | ||||||
| 2025-08-14 | 13F | Federation des caisses Desjardins du Quebec | 1,895 | 0.00 | 109 | 9.00 | ||||
| 2025-08-04 | 13F | Spinnaker Trust | 4,631 | 0.00 | 268 | 8.54 | ||||
| 2025-08-14 | 13F | Herold Advisors, Inc. | 10,990 | -8.34 | 635 | -0.63 | ||||
| 2025-07-28 | 13F | Harbour Investments, Inc. | 792 | 58.08 | 46 | 73.08 | ||||
| 2025-08-12 | 13F | Change Path, LLC | 18,003 | 2.09 | 1,040 | 10.64 | ||||
| 2025-08-14 | 13F | Ausdal Financial Partners, Inc. | 10,755 | 84.16 | 621 | 99.68 | ||||
| 2025-08-15 | 13F | Kestra Advisory Services, LLC | 255,347 | 66.23 | 14,754 | 80.16 | ||||
| 2025-08-07 | 13F | Kestra Private Wealth Services, Llc | 8,052 | 0.01 | 465 | 8.39 | ||||
| 2025-07-22 | 13F | Wealthcare Advisory Partners LLC | 42,823 | -1.59 | 2,474 | 6.68 | ||||
| 2025-08-01 | 13F | First National Trust Co | 26,382 | -0.13 | 1,524 | 8.24 | ||||
| 2025-08-14 | 13F | Wiley Bros.-aintree Capital, Llc | 63,781 | -2.60 | 3,672 | 7.06 | ||||
| 2025-08-04 | 13F | HBK Sorce Advisory LLC | 873,283 | -6.12 | 50,458 | 1.75 | ||||
| 2025-08-13 | 13F | MONECO Advisors, LLC | 17,048 | 0.02 | 985 | 8.48 | ||||
| 2025-08-06 | 13F | Able Wealth Management LLC | 0 | -100.00 | 0 | |||||
| 2025-07-25 | 13F | Muirfield Wealth Advisors Llc | 25,756 | 20.12 | 1,488 | 30.18 | ||||
| 2025-08-06 | 13F | Centerpoint Advisory Group | 74,506 | -0.97 | 4,305 | 7.33 | ||||
| 2025-08-11 | 13F | Aptus Capital Advisors, LLC | 1,764 | -4.60 | 102 | 3.06 | ||||
| 2025-08-13 | 13F | VestGen Advisors, LLC | 88,497 | -4.75 | 5,113 | 3.25 | ||||
| 2025-05-15 | 13F | Cambria Investment Management, L.P. | 0 | -100.00 | 0 | |||||
| 2025-07-30 | 13F | Paul Damon & Associates, Inc. | 4,423 | 0.00 | 256 | 8.51 | ||||
| 2025-08-15 | 13F | CI Private Wealth, LLC | 366,161 | 21,157 | ||||||
| 2025-08-04 | 13F | Cottage Street Advisors LLC | 4,001 | -4.74 | 231 | 3.59 | ||||
| 2025-08-15 | 13F | WFA of San Diego, LLC | 68 | 0.00 | 4 | 0.00 | ||||
| 2025-07-09 | 13F | Burt Wealth Advisors | 360,719 | 3.03 | 20,842 | 11.67 | ||||
| 2025-08-08 | 13F | Cetera Investment Advisers | 100,781 | 4.28 | 5,823 | 13.05 | ||||
| 2025-07-22 | 13F | Merit Financial Group, LLC | 55,496 | -12.15 | 3,207 | -4.78 | ||||
| 2025-07-17 | 13F | Financial Designs Corp | 219,670 | -6.87 | 12,693 | 0.94 | ||||
| 2025-08-14 | 13F | Integrated Wealth Concepts LLC | 216,793 | 2.71 | 12,526 | 11.32 | ||||
| 2025-07-30 | 13F | Cullen/frost Bankers, Inc. | 24,263 | 0.83 | 1,402 | 9.28 | ||||
| 2025-08-13 | 13F | Valued Retirements, Inc. | 35,678 | 0.00 | 2,061 | 8.42 | ||||
| 2025-08-11 | 13F | HighTower Advisors, LLC | 40,360 | -0.14 | 2,332 | 8.22 | ||||
| 2025-08-12 | 13F | Archer Investment Corp | 559 | 0.18 | 32 | 10.34 | ||||
| 2025-07-25 | 13F | Concord Asset Management, LLC/VA | 3,915 | 226 | ||||||
| 2025-08-08 | 13F | MTM Investment Management, LLC | 114 | 7 | ||||||
| 2025-08-12 | 13F | SRS Capital Advisors, Inc. | 2,493 | -0.99 | 144 | 7.46 | ||||
| 2025-07-17 | 13F | Janney Montgomery Scott LLC | 146,299 | -51.79 | 8 | -50.00 | ||||
| 2025-07-29 | 13F | Elevation Capital Advisory, LLC | 26,584 | 4.07 | 1,536 | 12.86 | ||||
| 2025-07-31 | 13F | Glass Jacobson Investment Advisors llc | 7,359 | -25.07 | 425 | -20.11 | ||||
| 2025-05-08 | 13F | Bank of Jackson Hole Trust | 0 | -100.00 | 0 | |||||
| 2025-07-18 | 13F | Consolidated Planning Corp | 69,016 | 3,988 | ||||||
| 2025-07-21 | 13F | Ameritas Advisory Services, LLC | 183 | 11 | ||||||
| 2025-04-25 | 13F | Smith, Salley & Associates | 0 | -100.00 | 0 | |||||
| 2025-05-14 | 13F | Eqis Capital Management, Inc. | 0 | -100.00 | 0 | -100.00 | ||||
| 2025-08-08 | 13F | Good Life Advisors, LLC | 5,111 | -33.19 | 295 | -27.52 | ||||
| 2025-08-12 | 13F | O'shaughnessy Asset Management, Llc | 350 | 20 | ||||||
| 2025-05-12 | 13F | Independent Advisor Alliance | 0 | -100.00 | 0 | |||||
| 2025-07-25 | 13F | Apollon Wealth Management, LLC | 22,655 | -17.56 | 1,309 | -10.59 | ||||
| 2025-08-11 | 13F | Perennial Investment Advisors, LLC | 94,850 | -26.81 | 5,480 | -20.67 | ||||
| 2025-08-13 | 13F | Northwestern Mutual Wealth Management Co | 136,883 | -36.02 | 7,909 | -30.65 | ||||
| 2025-07-14 | 13F | Abound Wealth Management | 317 | 0.00 | 18 | 12.50 | ||||
| 2025-07-31 | 13F | CAP Partners, LLC | 11,797 | -0.14 | 682 | 8.27 | ||||
| 2025-07-17 | 13F | HB Wealth Management, LLC | 3,631 | -51.05 | 210 | -47.09 | ||||
| 2025-08-28 | NP | AIM GROWTH SERIES (INVESCO GROWTH SERIES) - Invesco Oppenheimer Portfolio Series: Active Allocation Fund Class R5 | 4,646,943 | 15.97 | 268,500 | 25.69 | ||||
| 2025-05-29 | 13F/A | Modern Wealth Management, LLC | 5,532 | 0.00 | 290 | -2.68 | ||||
| 2025-07-23 | 13F | Kingswood Wealth Advisors, Llc | 5,070 | -6.90 | 293 | 0.69 | ||||
| 2025-08-11 | 13F | PAX Financial Group, LLC | 122,806 | 0.02 | 7,096 | 8.40 | ||||
| 2025-08-12 | 13F/A | Cozad Asset Management Inc | 51,914 | -7.58 | 3,000 | 0.17 | ||||
| 2025-05-09 | 13F | North Ridge Wealth Advisors, Inc. | 0 | -100.00 | 0 | |||||
| 2025-08-14 | 13F | Ameriprise Financial Inc | 154,289 | -13.18 | 8,950 | -5.53 | ||||
| 2025-08-14 | 13F | Hamilton Capital, LLC | 0 | -100.00 | 0 | |||||
| 2025-08-14 | 13F | Quantinno Capital Management LP | 85,753 | -12.25 | 4,955 | -4.90 | ||||
| 2025-08-14 | 13F | Money Concepts Capital Corp | 3,633 | -97.72 | 210 | -97.53 | ||||
| 2025-07-08 | 13F | Beacon Wealthcare LLC | 4,210 | 0.00 | 243 | 8.48 | ||||
| 2025-08-12 | 13F | Jpmorgan Chase & Co | 177,616 | -10.63 | 10,263 | -3.14 | ||||
| 2025-07-09 | 13F | Dynamic Advisor Solutions LLC | 261,811 | 1.28 | 15,127 | 9.78 | ||||
| 2025-07-31 | 13F | Waldron Private Wealth LLC | 11,526 | -98.82 | 666 | -98.73 | ||||
| 2025-08-04 | 13F | Elite Life Management LLC | 5,267 | -35.27 | 304 | -29.79 | ||||
| 2025-08-12 | 13F | J.w. Cole Advisors, Inc. | 7,683 | -14.50 | 444 | -7.52 | ||||
| 2025-07-11 | 13F | SILVER OAK SECURITIES, Inc | 139,399 | 0.57 | 8,054 | 10.10 | ||||
| 2025-07-30 | 13F | WESPAC Advisors SoCal, LLC | 5,945 | 0.00 | 344 | 8.54 | ||||
| 2025-08-14 | 13F | Susquehanna International Group, Llp | 38,988 | 63.77 | 2,253 | 77.46 | ||||
| 2025-04-23 | 13F | Embree Financial Group | 0 | -100.00 | 0 | |||||
| 2025-08-13 | 13F | Cerity Partners LLC | 27,618 | -39.15 | 1,596 | -34.06 | ||||
| 2025-07-21 | 13F | Ameriflex Group, Inc. | 882 | 0.00 | 50 | 6.38 | ||||
| 2025-07-29 | 13F | Empirical Asset Management, LLC | 7,345 | 15.45 | 424 | 25.07 | ||||
| 2025-08-01 | 13F | Gwn Securities Inc. | 0 | -100.00 | 0 | |||||
| 2025-08-12 | 13F | PSI Advisors, LLC | 0 | -100.00 | 0 | |||||
| 2025-07-25 | 13F | Retirement Planning Group, Llc / Ny | 22,542 | -7.36 | 1,302 | 0.39 | ||||
| 2025-04-28 | 13F | Oregon Pacific Wealth Management, LLC | 0 | -100.00 | 0 | |||||
| 2025-07-22 | 13F | Mascoma Wealth Management LLC | 0 | -100.00 | 0 | |||||
| 2025-08-01 | 13F | Envestnet Asset Management Inc | 481,456 | -7.79 | 27,817 | -0.07 | ||||
| 2025-08-05 | 13F | Landmark Wealth Management, Inc. | 12,596 | -59.52 | 728 | -56.15 | ||||
| 2025-07-11 | 13F | Farther Finance Advisors, LLC | 6,646 | 124.60 | 384 | 143.04 | ||||
| 2025-08-14 | 13F | Comerica Bank | 6,329 | -65.52 | 366 | -62.68 | ||||
| 2025-07-10 | 13F | Sovran Advisors, LLC | 4,493 | 259 | ||||||
| 2025-08-13 | 13F | Capital Analysts, Inc. | 1,067 | 68.83 | 0 | |||||
| 2025-08-14 | 13F | EP Wealth Advisors, Inc. | 10,328 | -23.37 | 597 | -16.99 | ||||
| 2025-07-25 | 13F | Atria Wealth Solutions, Inc. | 8,264 | -5.95 | 477 | 1.92 | ||||
| 2025-07-15 | 13F | ACT Advisors, LLC. | 8,603 | -46.41 | 497 | -41.87 | ||||
| 2025-07-10 | 13F | Signal Advisors Wealth, LLC | 53,284 | 87.07 | 3,079 | 102.77 | ||||
| 2025-05-14 | 13F | Flow Traders U.s. Llc | 0 | -100.00 | 0 | |||||
| 2025-07-16 | 13F | Perigon Wealth Management, LLC | 7,969 | 0.04 | 460 | 8.49 | ||||
| 2025-07-25 | 13F | Concurrent Investment Advisors, LLC | 71,733 | 154.46 | 4,145 | 175.90 | ||||
| 2025-08-14 | 13F | UBS Group AG | 1,232,585 | 2.16 | 71,219 | 10.73 | ||||
| 2025-08-04 | 13F | Arkadios Wealth Advisors | 671,995 | 0.86 | 38,828 | 9.32 | ||||
| 2025-08-14 | 13F | Arizona PSPRS Trust | 5,402,688 | 0.19 | 312,167 | 8.59 | ||||
| 2025-08-13 | 13F | WCG Wealth Advisors LLC | 35,044 | -11.08 | 2,025 | -3.62 | ||||
| 2025-08-11 | 13F | SFI Advisors, LLC | 5,494 | 317 | ||||||
| 2025-08-08 | 13F | Pnc Financial Services Group, Inc. | 300 | 17 | ||||||
| 2025-08-11 | 13F | Principal Securities, Inc. | 28,571 | 11.25 | 1,651 | 18.53 | ||||
| 2025-07-17 | 13F | White Pine Investment CO | 109,709 | -4.44 | 6 | 0.00 | ||||
| 2025-08-14 | 13F | Coppell Advisory Solutions LLC | 0 | -100.00 | 0 | |||||
| 2025-07-16 | 13F | ORG Partners LLC | 27,933 | -29.81 | 1,610 | -27.84 | ||||
| 2025-07-09 | 13F | Channel Wealth Llc | 11,883 | -11.34 | 687 | -3.92 | ||||
| 2025-07-24 | 13F | IFP Advisors, Inc | 40,117 | -27.79 | 2,318 | -21.75 | ||||
| 2025-07-23 | 13F | Richardson Capital Management LLC | 0 | -100.00 | 0 | |||||
| 2025-05-14 | 13F | Level Four Advisory Services, Llc | 0 | -100.00 | 0 | |||||
| 2025-08-13 | 13F | Colonial Trust Advisors | 0 | -100.00 | 0 | |||||
| 2025-07-11 | 13F | Orrstown Financial Services Inc | 999,063 | 1.23 | 57,726 | 9.72 | ||||
| 2025-08-05 | 13F | Tsfg, Llc | 28 | 0.00 | 0 | |||||
| 2025-07-07 | 13F | Thurston, Springer, Miller, Herd & Titak, Inc. | 125 | 0.00 | 7 | 16.67 | ||||
| 2025-06-30 | NP | AIM INVESTMENT FUNDS (INVESCO INVESTMENT FUNDS) - Invesco Oppenheimer Global Allocation Fund Class R | 4,151,760 | 0.00 | 222,410 | -4.82 | ||||
| 2025-07-14 | 13F | Rooted Wealth Advisors, Inc. | 89,724 | 8.11 | 5,158 | 26.61 | ||||
| 2025-07-28 | 13F | BRYN MAWR TRUST Co | 41,149 | 0.00 | 2,378 | 8.39 | ||||
| 2025-08-13 | 13F | Milestone Investment Advisors LLC | 30,330 | -26.08 | 1,752 | -19.89 | ||||
| 2025-08-28 | NP | AIM GROWTH SERIES (INVESCO GROWTH SERIES) - Invesco Oppenheimer Portfolio Series: Moderate Investor Fund Class C | 3,479,632 | 16.42 | 201,053 | 26.18 | ||||
| 2025-07-15 | 13F | Axis Wealth Partners, LLC | 9,338 | 0.59 | 540 | 9.11 | ||||
| 2025-08-12 | 13F | Running Point Capital Advisors, LLC | 59,540 | 4.62 | 3,440 | 13.42 | ||||
| 2025-08-14 | 13F | LWM Advisory Services, LLC | 4,305 | -7.72 | 249 | 0.00 | ||||
| 2025-08-18 | 13F | Arq Wealth Advisors, Llc | 5,545 | 0.00 | 296 | 0.00 | ||||
| 2025-04-22 | 13F | Denver Wealth Management, Inc. | 0 | -100.00 | 0 | |||||
| 2025-07-14 | 13F | Golden State Equity Partners | 7,160 | 0.00 | 414 | 8.40 | ||||
| 2025-07-08 | 13F | Nbc Securities, Inc. | 68 | 0.00 | 0 | |||||
| 2025-08-13 | 13F | Jones Financial Companies Lllp | 289,214 | 5.25 | 16,604 | 14.48 | ||||
| 2025-07-28 | 13F | Copia Wealth Management | 130 | 0.00 | 8 | 16.67 | ||||
| 2025-08-07 | 13F | PFG Advisors | 55,075 | 7.10 | 3,182 | 16.09 | ||||
| 2025-08-28 | NP | CMAIX - Invesco Conservative Allocation Fund CLASS R5 | 318,428 | 10.83 | 18,399 | 20.11 | ||||
| 2025-07-17 | 13F | San Luis Wealth Advisors LLC | 98,351 | 1.01 | 6 | 0.00 | ||||
| 2025-08-11 | 13F | TD Waterhouse Canada Inc. | 36,396 | 42.88 | 2,100 | 55.02 | ||||
| 2025-08-13 | 13F | Advocacy Wealth Management Services, LLC | 46,803 | 0.00 | 2,704 | 8.38 | ||||
| 2025-08-14 | 13F | Old Mission Capital Llc | 4,221 | 244 | ||||||
| 2025-07-17 | 13F | Wolff Wiese Magana Llc | 71 | 0.00 | 4 | 33.33 | ||||
| 2025-07-14 | 13F | Signature Securities Group Corporation | 14,512 | 0.84 | 838 | 9.26 | ||||
| 2025-08-11 | 13F | Private Advisor Group, LLC | 264,593 | -57.42 | 15,288 | -53.85 | ||||
| 2025-08-28 | NP | AIM GROWTH SERIES (INVESCO GROWTH SERIES) - Invesco Oppenheimer Portfolio Series: Growth Investor Fund Class R6 | 2,384,561 | 17.76 | 137,780 | 27.63 | ||||
| 2025-08-14 | 13F | Two Sigma Securities, Llc | 6,027 | 348 | ||||||
| 2025-08-14 | 13F | Hrt Financial Lp | 0 | -100.00 | 0 | |||||
| 2025-08-13 | 13F | Marshall Wace, Llp | 3,775 | 218 | ||||||
| 2025-08-11 | 13F | GW&K Investment Management, LLC | 364 | 0 | ||||||
| 2025-07-31 | 13F | Daido Life Insurance Co | 403,056 | 0.00 | 23 | 9.52 | ||||
| 2025-08-04 | 13F | NBZ Investment Advisors LLC | 63,936 | -31.25 | 3,694 | -25.48 | ||||
| 2025-08-14 | 13F | Catalyst Financial Partners Llc | 13,855 | 801 | ||||||
| 2025-07-15 | 13F | Colonial River Wealth Management, LLC | 26,653 | 27.95 | 1,542 | 38.83 | ||||
| 2025-08-08 | 13F | Petix & Botte Co | 15,190 | -18.68 | 878 | -11.86 | ||||
| 2025-08-27 | 13F/A | Brinker Capital Investments, LLC | 7,196 | -20.71 | 416 | -14.08 | ||||
| 2025-05-15 | 13F | Squarepoint Ops LLC | Call | 0 | -100.00 | 0 | ||||
| 2025-08-13 | 13F | Baird Financial Group, Inc. | 7,736 | 447 | ||||||
| 2025-04-22 | 13F | Synergy Financial Management, LLC | 0 | -100.00 | 0 | |||||
| 2025-07-31 | 13F | Longview Financial Advisors, Inc. | 26,570 | -13.20 | 1,535 | -5.89 | ||||
| 2025-07-16 | 13F | John W. Brooker & Co., CPAs | 5,841 | -90.41 | 338 | -89.62 | ||||
| 2025-08-08 | 13F | Avantax Advisory Services, Inc. | 41,385 | 3.59 | 2,391 | 12.31 | ||||
| 2025-08-28 | NP | AIM GROWTH SERIES (INVESCO GROWTH SERIES) - Invesco Oppenheimer Portfolio Series: Conservative Investor Fund Class R6 | 195,355 | 18.87 | 11,288 | 28.83 | ||||
| 2025-08-15 | 13F | Equitable Holdings, Inc. | 69,803 | 2.22 | 4,033 | 10.80 | ||||
| 2025-07-25 | 13F | Cwm, Llc | 4,134 | 4.13 | 0 | |||||
| 2025-08-14 | 13F | Paces Ferry Wealth Advisors, Llc | 3,948 | -9.66 | 228 | -1.72 | ||||
| 2025-07-29 | 13F | Private Trust Co Na | 1,824 | -30.57 | 105 | -25.00 | ||||
| 2025-07-08 | 13F | Apella Capital, LLC | 32,548 | -1.87 | 1,884 | 8.59 | ||||
| 2025-07-25 | 13F | Apollon Financial, LLC | 16,247 | -11.45 | 939 | -4.09 | ||||
| 2025-08-26 | 13F/A | Thrivent Financial For Lutherans | 3,999 | -88.73 | 0 | -100.00 | ||||
| 2025-08-14 | 13F | Graney & King, LLC | 8,047 | -1.91 | 465 | 6.18 | ||||
| 2025-07-11 | 13F | Diversified Trust Co | 6,538 | -3.68 | 378 | 4.43 | ||||
| 2025-07-17 | 13F | Beacon Capital Management, LLC | 0 | -100.00 | 0 | |||||
| 2025-08-04 | 13F | Assetmark, Inc | 10,839 | 19.60 | 626 | 29.61 | ||||
| 2025-08-11 | 13F | Advisor Resource Council | 0 | -100.00 | 0 | |||||
| 2025-08-07 | 13F | Fox Financial, Inc | 14,963 | -0.41 | 865 | 8.00 | ||||
| 2025-07-22 | 13F | Clarius Group, LLC | 193,360 | -4.34 | 11,172 | 3.68 | ||||
| 2025-08-01 | 13F | Bessemer Group Inc | 0 | -100.00 | 0 | |||||
| 2025-07-24 | 13F | Baldwin Brothers Inc/ma | 449,830 | 1.33 | 25,991 | 9.83 | ||||
| 2025-08-13 | 13F/A | StoneX Group Inc. | 0 | -100.00 | 0 | -100.00 | ||||
| 2025-08-14 | 13F | Mariner, LLC | 867,759 | -4.69 | 50,139 | 3.31 | ||||
| 2025-08-11 | 13F | Western Wealth Management, LLC | 31,749 | -0.75 | 1,834 | 7.57 | ||||
| 2025-05-15 | 13F/A | Orion Portfolio Solutions, LLC | 9,075 | 484 | ||||||
| 2025-07-10 | 13F | Focus Financial Network, Inc. | 54,856 | 125.49 | 3,170 | 144.52 | ||||
| 2025-05-15 | 13F | Citadel Advisors Llc | Call | 0 | -100.00 | 0 | -100.00 | |||
| 2025-04-23 | 13F | Alpha Financial Advisors, LLC | 0 | -100.00 | 0 | |||||
| 2025-07-21 | 13F | Seros Financial, LLC | 13,173 | 0.00 | 761 | 8.40 | ||||
| 2025-07-25 | 13F | Concord Wealth Partners | 3,915 | 1.08 | 226 | 9.71 | ||||
| 2025-08-14 | 13F | Sunbelt Securities, Inc. | 369 | -20.65 | 20 | -16.67 | ||||
| 2025-07-25 | 13F | We Are One Seven, LLC | 59,585 | -2.55 | 3,443 | 5.62 | ||||
| 2025-08-14 | 13F | Goldman Sachs Group Inc | 231,184 | 43.81 | 13,358 | 55.88 | ||||
| 2025-08-25 | 13F/A | Neuberger Berman Group LLC | 4,436 | 0.00 | 256 | 8.47 | ||||
| 2025-08-12 | 13F | Global Retirement Partners, LLC | 8,941 | 8.86 | 517 | 15.96 | ||||
| 2025-08-14 | 13F | Qube Research & Technologies Ltd | 51,334 | -0.41 | 2,966 | 7.97 | ||||
| 2025-08-12 | 13F | BlackRock, Inc. | 3,326 | 0.00 | 192 | 8.47 | ||||
| 2025-08-13 | 13F | EverSource Wealth Advisors, LLC | 2,596 | -16.69 | 150 | -10.24 | ||||
| 2025-08-18 | 13F | Goodman Advisory Group, LLC | 0 | -100.00 | 0 | |||||
| 2025-07-18 | 13F | Truist Financial Corp | 197,976 | -31.51 | 11,439 | -25.76 | ||||
| 2025-08-13 | 13F | Elios Financial Group Inc. | 46,093 | 15.01 | 2,663 | 24.67 | ||||
| 2025-08-15 | 13F | Morgan Stanley | 4,876,451 | -1.01 | 281,761 | 7.30 | ||||
| 2025-06-30 | NP | Northern Lights Fund Trust - PFG Invesco(R) Thematic ESG Strategy Class R Shares | 219,600 | 1.71 | 11,764 | -3.19 | ||||
| 2025-08-08 | 13F | Capital Investment Advisory Services, LLC | 920 | 0.11 | 53 | 8.16 | ||||
| 2025-04-23 | 13F | GHP Investment Advisors, Inc. | 0 | -100.00 | 0 | |||||
| 2025-08-14 | 13F | Royal Bank Of Canada | 152,384 | -48.52 | 8,806 | -44.20 | ||||
| 2025-05-16 | 13F | Arete Wealth Advisors, LLC | 0 | -100.00 | 0 | |||||
| 2025-08-06 | 13F | ORBA Wealth Advisors, L.L.C. | 23,378 | -50.65 | 1,351 | -46.53 | ||||
| 2025-08-14 | 13F | Aqr Capital Management Llc | 30,105 | -16.87 | 1,739 | -9.90 | ||||
| 2025-08-15 | 13F | Tower Research Capital LLC (TRC) | 4,120 | -90.60 | 238 | -89.81 | ||||
| 2025-07-18 | 13F | Bartlett & Co. Wealth Management Llc | 23 | 0.00 | 1 | 0.00 | ||||
| 2025-07-30 | 13F | Retirement Planning Group | 44,151 | 6.34 | 2,551 | 15.27 | ||||
| 2025-08-14 | 13F | Citadel Advisors Llc | 24,172 | 22.38 | 1,397 | 32.70 | ||||
| 2025-07-29 | NP | MVFG - Monarch Volume Factor Global Unconstrained Index ETF | 66,052 | 3,718 | ||||||
| 2025-08-04 | 13F | Atria Investments Llc | 5,980 | 346 | ||||||
| 2025-08-27 | NP | ALAAX - INVESCO Income Allocation Fund Class A | 154,129 | -4.10 | 8,906 | 3.95 | ||||
| 2025-08-13 | 13F | GeoWealth Management, LLC | 6,779 | -5.31 | 392 | 2.62 | ||||
| 2025-04-23 | 13F | International Assets Investment Management, Llc | 0 | -100.00 | 0 | -100.00 | ||||
| 2025-05-16 | 13F | Empowered Funds, LLC | 0 | -100.00 | 0 | |||||
| 2025-07-10 | 13F | Wealth Enhancement Advisory Services, Llc | 1,049,713 | -2.91 | 61,020 | 5.86 | ||||
| 2025-08-08 | 13F | TD Capital Management LLC | 1,225 | 0.00 | 71 | 7.69 | ||||
| 2025-08-14 | 13F | Jane Street Group, Llc | 16,970 | 232.35 | 981 | 260.29 | ||||
| 2025-08-07 | 13F | 49 Wealth Management, Llc | 6,232 | -20.95 | 360 | -14.29 | ||||
| 2025-07-14 | 13F | Sowell Financial Services LLC | 18,712 | 1.48 | 1,081 | 9.97 | ||||
| 2025-08-12 | 13F | PKS Advisory Services, LLC | 5,503 | -0.31 | 318 | 7.82 | ||||
| 2025-07-31 | 13F | Oppenheimer & Co Inc | 55,791 | -0.63 | 3,224 | 7.72 | ||||
| 2025-07-02 | 13F | Waller Financial Planning Group, Inc | 592,265 | 19.22 | 34,221 | 29.21 | ||||
| 2025-08-14 | 13F | CoreCap Advisors, LLC | 857 | 29.65 | 50 | 40.00 | ||||
| 2025-08-14 | 13F | GWM Advisors LLC | 15,859 | -9.20 | 916 | -1.61 | ||||
| 2025-08-14 | 13F | NCM Capital Management, LLC | 6,250 | -0.79 | 361 | 7.76 | ||||
| 2025-08-14 | 13F | Wells Fargo & Company/mn | 912,056 | -25.10 | 52,699 | -18.82 | ||||
| 2025-08-12 | 13F | Steward Partners Investment Advisory, Llc | 3,444 | 0.67 | 199 | 8.79 | ||||
| 2025-07-22 | 13F | Cedar Mountain Advisors, LLC | 1 | 0.00 | 0 | |||||
| 2025-07-17 | 13F | ERn Financial, LLC | 264,060 | -1.32 | 15,257 | 6.95 | ||||
| 2025-05-15 | 13F | MAI Capital Management | 0 | -100.00 | 0 | |||||
| 2025-07-14 | 13F | Financial Enhancement Group LLC | 334,900 | 1.62 | 19,253 | 13.91 | ||||
| 2025-08-14 | 13F | Sequent Planning LLC | 26,764 | 12.33 | 1,546 | 21.73 | ||||
| 2025-08-04 | 13F | Integrity Alliance, Llc. | 36,165 | 2,090 | ||||||
| 2025-04-02 | 13F/A | Industrial Alliance Investment Management Inc. | 0 | -100.00 | 0 | |||||
| 2025-08-13 | 13F | RPg Family Wealth Advisory, LLC | 64,798 | -2.52 | 3,744 | 5.67 | ||||
| 2025-07-16 | 13F | Signaturefd, Llc | 22 | 0.00 | 1 | 0.00 | ||||
| 2025-07-16 | 13F | EdgeRock Capital LLC | 4,955 | 0.08 | 286 | 8.75 | ||||
| 2025-08-12 | 13F | Journey Strategic Wealth Llc | 279,548 | 1.55 | 16,152 | 10.06 | ||||
| 2025-08-05 | 13F | Bank of New York Mellon Corp | 2,680,538 | 1.82 | 154,882 | 10.36 | ||||
| 2025-07-08 | 13F | Goldstone Financial Group, LLC | 14,823 | 4.08 | 862 | 13.44 | ||||
| 2025-08-11 | 13F | Citigroup Inc | 0 | -100.00 | 0 | |||||
| 2025-05-19 | 13F/A | Jane Street Group, Llc | Call | 0 | -100.00 | 0 | -100.00 | |||
| 2025-08-13 | 13F | Avestar Capital, LLC | 90,401 | 28.57 | 5,223 | 39.35 | ||||
| 2025-08-14 | 13F | Great Valley Advisor Group, Inc. | 71,634 | -7.65 | 4,139 | 0.10 | ||||
| 2025-07-30 | 13F | Brookstone Capital Management | 449,356 | 8.86 | 25,964 | 17.99 | ||||
| 2025-08-06 | 13F | Commonwealth Equity Services, Llc | 145,806 | -15.71 | 8 | -11.11 | ||||
| 2025-08-28 | NP | AADAX - INVESCO Growth Allocation Fund Class A | 2,405,926 | 16.21 | 139,014 | 25.96 | ||||
| 2025-08-13 | 13F | Daner Wealth Management, LLC | 244,574 | -14.77 | 14,491 | -10.63 | ||||
| 2025-08-12 | 13F | Financial Advocates Investment Management | 3,757 | 217 | ||||||
| 2025-08-14 | 13F | Mpwm Advisory Solutions, Llc | 0 | -100.00 | 0 | |||||
| 2025-04-09 | 13F | Roxbury Financial LLC | 0 | -100.00 | 0 | |||||
| 2025-08-06 | 13F | Atlas Legacy Advisors, LLC | 26,391 | 30.00 | 1,525 | 38.55 | ||||
| 2025-08-05 | 13F | Key FInancial Inc | 456 | 0.00 | 26 | 8.33 | ||||
| 2025-08-05 | 13F | GPS Wealth Strategies Group, LLC | 2,100 | -1.36 | 121 | 7.08 | ||||
| 2025-07-31 | 13F | Cambridge Investment Research Advisors, Inc. | 506,359 | 5.08 | 29 | 16.00 | ||||
| 2025-07-16 | 13F | ORG Wealth Partners, LLC | 256 | 0.00 | 15 | 7.69 | ||||
| 2025-08-12 | 13F | Wood Tarver Financial Group, LLC | 13,258 | -7.17 | 1 | -100.00 | ||||
| 2025-08-14 | 13F | Fmr Llc | 9,348 | 21.47 | 540 | 31.71 | ||||
| 2025-05-01 | 13F | Freedom Day Solutions, LLC | 0 | -100.00 | 0 | -100.00 | ||||
| 2025-08-04 | 13F | IFG Advisory, LLC | 381,412 | -13.43 | 22,038 | -6.17 | ||||
| 2025-08-14 | 13F | LM Advisors LLC | 627,898 | -0.73 | 36 | 9.09 | ||||
| 2025-08-18 | 13F/A | National Bank Of Canada /fi/ | 16,035 | -25.09 | 925 | -18.57 | ||||
| 2025-07-29 | 13F | Stratos Wealth Partners, LTD. | 4,045 | -14.54 | 234 | -7.54 | ||||
| 2025-08-01 | 13F | Ashton Thomas Private Wealth, LLC | 25,393 | 2.64 | 1,467 | 11.31 | ||||
| 2025-07-08 | 13F | Parallel Advisors, LLC | 560 | 0.00 | 32 | 10.34 | ||||
| 2025-07-30 | 13F | Bogart Wealth, LLC | 17 | 0.00 | 1 | |||||
| 2025-07-31 | 13F | Richards, Merrill & Peterson, Inc. | 2,875 | 9.03 | 166 | 18.57 | ||||
| 2025-07-31 | 13F | Moloney Securities Asset Management, LLC | 13,486 | 3.48 | 779 | 12.25 | ||||
| 2025-08-01 | 13F | First Command Advisory Services, Inc. | 4,767 | -23.09 | 275 | -16.67 | ||||
| 2025-08-13 | 13F | Transce3nd, LLC | 234 | 0.00 | 14 | 8.33 | ||||
| 2025-08-14 | 13F | Colony Group, LLC | 3,639 | 210 | ||||||
| 2025-07-15 | 13F | Mather Group, Llc. | 0 | -100.00 | 0 | |||||
| 2025-07-21 | 13F | Triad Wealth Partners, LLC | 31,441 | -19.69 | 1,817 | -12.99 | ||||
| 2025-08-05 | 13F | Bank Of Montreal /can/ | 7,021 | 55.99 | 406 | 69.46 | ||||
| 2025-08-19 | 13F | Advisory Services Network, LLC | 4,095 | -21.88 | 238 | -14.70 | ||||
| 2025-08-07 | 13F | Sierra Ocean, Llc | 4,301 | 0.00 | 249 | 8.30 | ||||
| 2025-08-15 | 13F | Captrust Financial Advisors | 990,079 | -1.62 | 57,207 | 6.63 | ||||
| 2025-08-13 | 13F | Proactive Wealth Strategies LLC | 25,939 | -50.36 | 1 | -50.00 | ||||
| 2025-08-15 | 13F | Asset Allocation Strategies LLC | 153,146 | -42.24 | 8,849 | -37.40 | ||||
| 2025-08-14 | 13F | Bank Of America Corp /de/ | 2,143,686 | 36.51 | 123,862 | 47.96 | ||||
| 2025-08-14 | 13F | Stifel Financial Corp | 98,156 | -18.05 | 5,671 | -11.18 | ||||
| 2025-07-28 | 13F | Kiker Wealth Management, LLC | 0 | -100.00 | 0 | |||||
| 2025-04-15 | 13F | Capital Advisors, Ltd. LLC | 0 | -100.00 | 0 | |||||
| 2025-07-21 | 13F | Ashton Thomas Securities, Llc | 151,936 | -20.11 | 8,779 | -13.41 | ||||
| 2025-07-22 | 13F | Foguth Wealth Management, LLC. | 54,982 | 78.35 | 3,177 | 93.30 | ||||
| 2025-08-07 | 13F | Meeder Advisory Services, Inc. | 0 | -100.00 | 0 | |||||
| 2025-09-04 | 13F/A | Advisor Group Holdings, Inc. | 336,948 | -9.32 | 19,470 | -1.74 | ||||
| 2025-07-29 | 13F | Activest Wealth Management | 0 | 0 | ||||||
| 2025-08-14 | 13F | Cubist Systematic Strategies, LLC | 13,082 | 756 | ||||||
| 2025-08-05 | 13F | Sigma Planning Corp | 10,505 | -2.32 | 607 | 5.76 | ||||
| 2025-04-29 | 13F | Callan Capital, LLC | 58,415 | 0.00 | 3,114 | -1.67 | ||||
| 2025-08-05 | 13F | Huntington National Bank | 15 | 7.69 | ||||||
| 2025-08-14 | 13F | Mml Investors Services, Llc | 81,673 | -2.30 | 5 | 0.00 | ||||
| 2025-08-04 | 13F | Spire Wealth Management | 16,330 | 0.00 | 944 | 8.39 | ||||
| 2025-08-08 | 13F | Thoroughbred Financial Services, Llc | 6,665 | 0.00 | 0 | |||||
| 2025-07-30 | 13F | Lionsbridge Wealth Management LLC | 29,246 | -2.20 | 1,690 | 5.96 | ||||
| 2025-08-04 | 13F | Balentine LLC | 5,619,451 | 0.18 | 324,692 | 8.58 | ||||
| 2025-07-28 | 13F | Frazier Financial Advisors, LLC | 13 | 0.00 | 1 | |||||
| 2025-04-24 | 13F | Transcend Wealth Collective, Llc | 0 | -100.00 | 0 | |||||
| 2025-07-02 | 13F | HBW Advisory Services LLC | 4,287 | 0.19 | 248 | 8.33 | ||||
| 2025-07-17 | 13F | Camelot Portfolios, LLC | 19,705 | -5.03 | 1,139 | 2.89 | ||||
| 2025-08-12 | 13F | Up Strategic Wealth Investment Advisors Llc | 11,488 | -10.05 | 664 | -2.50 | ||||
| 2025-07-09 | 13F | Defined Wealth Management, Llc | 41,995 | 2.21 | 2,426 | 10.78 | ||||
| 2025-08-06 | 13F | Golden State Wealth Management, LLC | 76 | 0.00 | 4 | 0.00 | ||||
| 2025-08-14 | 13F | CIBC World Markets Inc. | 27,128 | -3.57 | 1,567 | 4.54 | ||||
| 2025-07-28 | 13F | Axxcess Wealth Management, Llc | 52,215 | 11.47 | 3,017 | 20.78 | ||||
| 2025-08-11 | 13F | Alteri Wealth LLC | 13,559 | 19.15 | 783 | 29.21 | ||||
| 2025-08-14 | 13F | IHT Wealth Management, LLC | 540,620 | 4.19 | 31,237 | 12.93 | ||||
| 2025-08-18 | 13F | Geneos Wealth Management Inc. | 1,645 | 0.00 | 95 | 9.20 | ||||
| 2025-08-12 | 13F | LPL Financial LLC | 2,741,828 | -2.94 | 158,423 | 5.20 | ||||
| 2025-08-14 | 13F | Two Sigma Investments, Lp | 232,200 | 13,417 | ||||||
| 2025-04-23 | 13F | Mascagni Wealth Management, Inc. | 0 | -100.00 | 0 | -100.00 | ||||
| 2025-08-08 | 13F | Kingsview Wealth Management, LLC | 182,632 | 207.50 | 10,552 | 233.29 | ||||
| 2025-08-13 | 13F | Invesco Ltd. | 20,645,448 | 8.81 | 1,192,894 | 17.93 | ||||
| 2025-08-04 | 13F | Deseret Mutual Benefit Administrators | 792,983 | 0.00 | 45,819 | 8.39 | ||||
| 2025-07-24 | 13F | Us Bancorp \de\ | 5,130 | -14.40 | 296 | -7.21 | ||||
| 2025-07-25 | 13F | Envestnet Portfolio Solutions, Inc. | 6,436 | -32.00 | 372 | -26.39 | ||||
| 2025-08-14 | 13F | Raymond James Financial Inc | 575,217 | 19.01 | 33,236 | 28.99 | ||||
| 2025-08-14 | 13F | Bnp Paribas Arbitrage, Sa | 0 | -100.00 | 0 | |||||
| 2025-07-31 | 13F | Briaud Financial Planning, Inc | 17 | 0 | ||||||
| 2025-08-01 | 13F | Y-Intercept (Hong Kong) Ltd | 5,487 | 317 | ||||||
| 2025-08-12 | 13F | Gladstone Institutional Advisory LLC | 252,580 | 12.45 | 14,594 | 21.88 | ||||
| 2025-07-22 | 13F | Simplicity Wealth,LLC | 7,204 | 61.24 | 416 | 74.79 | ||||
| 2025-08-11 | 13F | Rothschild Investment Llc | 1 | 0.00 | 0 | |||||
| 2025-08-14 | 13F | Ancora Advisors, LLC | 160 | 0.00 | 9 | 12.50 | ||||
| 2025-08-14 | 13F | Beaird Harris Wealth Management, LLC | 2,051 | 0.00 | 119 | 8.26 | ||||
| 2025-08-11 | 13F | United Advisor Group, LLC | 5,344 | 0.00 | 309 | 8.45 | ||||
| 2025-07-17 | 13F | Archford Capital Strategies, LLC | 33,723 | -6.53 | 1,949 | 1.30 |