Mga Batayang Estadistika
| Pemilik Institusional | 239 total, 231 long only, 1 short only, 7 long/short - change of 0.84% MRQ |
| Alokasi Portofolio Rata-rata | 0.0714 % - change of -38.45% MRQ |
| Saham Institusional (Jangka Panjang) | 98,614,439 (ex 13D/G) - change of 31.63MM shares 47.21% MRQ |
| Nilai Institusional (Jangka Panjang) | $ 199,067 USD ($1000) |
Kepemilikan Institusional dan Pemegang Saham
Prospect Capital Corporation (US:PSEC) memiliki 239 pemilik institusional dan pemegang saham yang telah mengajukan formulir 13D/G atau 13F kepada Komisi Bursa Efek (Securities Exchange Commission/SEC). Lembaga-lembaga ini memegang total 99,202,642 saham. Pemegang saham terbesar meliputi Kingstone Capital Partners Texas, LLC, Van Eck Associates Corp, BIZD - VanEck Vectors BDC Income ETF, Balyasny Asset Management Llc, Two Sigma Advisers, Lp, Marshall Wace, Llp, UBS Group AG, Morgan Stanley, Legal & General Group Plc, and Tudor Investment Corp Et Al .
Struktur kepemilikan institusional Prospect Capital Corporation (NasdaqGS:PSEC) menunjukkan posisi terkini di perusahaan oleh institusi dan dana, serta perubahan terbaru dalam ukuran posisi. Pemegang saham utama dapat mencakup investor individu, reksa dana, dana lindung nilai, atau institusi. Jadwal 13D menunjukkan bahwa investor memegang (atau pernah memegang) lebih dari 5% saham perusahaan dan bermaksud (atau pernah bermaksud) untuk secara aktif mengejar perubahan strategi bisnis. Jadwal 13G menunjukkan investasi pasif lebih dari 5%.
The share price as of September 5, 2025 is 2.89 / share. Previously, on September 9, 2024, the share price was 5.30 / share. This represents a decline of 45.47% over that period.

Skor Sentimen Dana
Skor Sentimen Dana (sebelumnya dikenal sebagai Skor Akumulasi Kepemilikan) menemukan saham-saham yang paling banyak dibeli oleh dana. Ini adalah hasil dari model kuantitatif multi-faktor yang canggih yang mengidentifikasi perusahaan dengan tingkat akumulasi institusional tertinggi. Model penilaian menggunakan kombinasi dari total peningkatan pemilik yang diungkapkan, perubahan dalam alokasi portofolio pada pemilik tersebut, dan metrik lainnya. Angka berkisar dari 0 hingga 100, dengan angka yang lebih tinggi menunjukkan tingkat akumulasi yang lebih tinggi dibandingkan dengan perusahaan sejenisnya, dan 50 adalah rata-ratanya.
Frekuensi Pembaruan: Setiap Hari
Lihat Ownership Explorer, yang menyediakan daftar perusahaan dengan peringkat tertinggi.
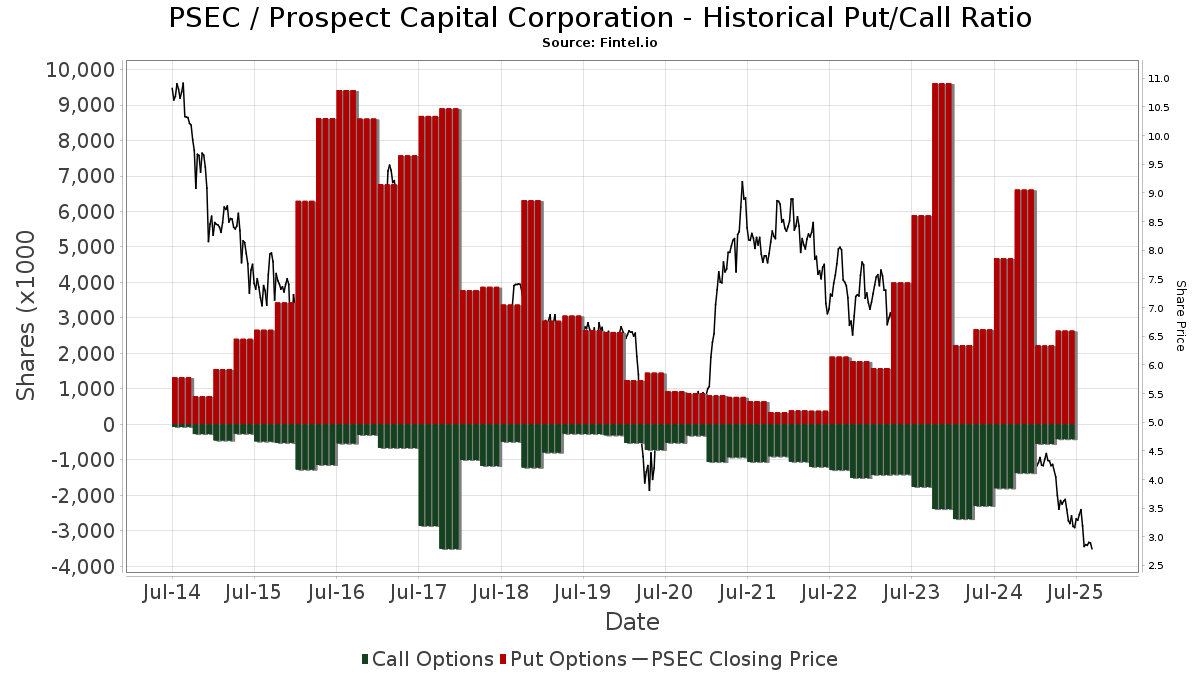
Rasio Put/Call Institusional
Selain melaporkan isu ekuitas dan utang standar, institusi dengan aset di bawah manajemen lebih dari 100 juta dolar AS juga harus mengungkapkan kepemilikan opsi put dan call mereka. Karena opsi put umumnya menunjukkan sentimen negatif, dan opsi call menunjukkan sentimen positif, kita dapat mengetahui sentimen institusional secara keseluruhan dengan memplot rasio put terhadap call. Grafik di sebelah kanan memplot rasio put/call historis untuk instrumen ini.
Menggunakan Rasio Put/Call sebagai indikator sentimen investor mengatasi salah satu kekurangan utama dari penggunaan total kepemilikan institusional, yaitu sejumlah besar aset yang dikelola diinvestasikan secara pasif untuk melacak indeks. Dana yang dikelola secara pasif biasanya tidak membeli opsi, sehingga indikator rasio put/call lebih akurat dalam melacak sentimen dana yang dikelola secara aktif.
Pengajuan 13D/G
Kami menyajikan pengajuan 13D/G secara terpisah dari pengajuan 13F karena perlakuan yang berbeda oleh SEC. Pengajuan 13D/G dapat diajukan oleh kelompok investor (dengan satu pemimpin), sedangkan pengajuan 13F tidak bisa. Hal ini mengakibatkan situasi di mana seorang investor dapat mengajukan 13D/G yang melaporkan satu nilai untuk total saham (mewakili semua saham yang dimiliki oleh kelompok investor), tetapi kemudian mengajukan 13F yang melaporkan nilai yang berbeda untuk total saham (mewakili kepemilikan mereka sendiri). Ini berarti bahwa kepemilikan saham dari pengajuan 13D/G dan pengajuan 13F seringkali tidak dapat dibandingkan secara langsung, sehingga kami menyajikannya secara terpisah.
Catatan: Mulai 16 Mei 2021, kami tidak lagi menampilkan pemilik yang belum mengajukan 13D/G dalam setahun terakhir. Sebelumnya, kami menampilkan riwayat lengkap pengajuan 13D/G. Secara umum, entitas yang diwajibkan untuk mengajukan pengajuan 13D/G harus mengajukan setidaknya setiap tahun sebelum mengirimkan pengajuan penutupan. Namun, terkadang dana keluar dari posisi tanpa mengirimkan pengajuan penutupan (misalnya, mereka menghentikan operasi), sehingga menampilkan riwayat lengkap terkadang menyebabkan kebingungan tentang kepemilikan saat ini. Untuk mencegah kebingungan, kami sekarang hanya menampilkan pemilik 'saat ini' - yaitu - pemilik yang telah mengajukan dalam setahun terakhir.
Upgrade to unlock premium data.
| Tanggal File | Formulir | Investor | Sebelumnya Saham |
Terbaru Saham |
Δ Saham (Persen) |
Kepemilikan (Persen) |
Δ Pagmamay-ari (Persen) |
|
|---|---|---|---|---|---|---|---|---|
| 2024-11-22 | Barry John F | 109,009,024 | 121,520,954 | 11.48 | 27.86 | 6.13 |
Pengajuan 13F dan NPORT
Detail pada pengajuan 13F tersedia gratis. Detail pada pengajuan NP memerlukan keanggotaan premium. Baris berwarna hijau menunjukkan posisi baru. Baris berwarna merah menunjukkan posisi yang sudah ditutup. Klik tautan ini ikon untuk melihat riwayat transaksi selengkapnya.
Tingkatkan
untuk membuka data premium dan mengekspor ke Excel ![]() .
.
| Tanggal File | Sumber | Investor | Ketik | Presyo ng Avg (Silangan) |
Saham | Δ Saham (%) |
Dilaporkan Nilai ($1000) |
Nilai Δ (%) |
Alokasi Port (%) |
|
|---|---|---|---|---|---|---|---|---|---|---|
| 2025-08-15 | 13F | Morgan Stanley | 3,109,006 | 3.13 | 9,887 | -20.01 | ||||
| 2025-05-15 | 13F | Jain Global LLC | 0 | -100.00 | 0 | |||||
| 2025-07-31 | 13F | Moloney Securities Asset Management, LLC | 120,239 | 388.94 | 382 | 282.00 | ||||
| 2025-08-01 | 13F | Gwn Securities Inc. | 0 | -100.00 | 0 | |||||
| 2025-08-05 | 13F | Claro Advisors LLC | 27,165 | -0.01 | 86 | -22.52 | ||||
| 2025-08-14 | 13F | Moneta Group Investment Advisors Llc | 12,553 | 1.63 | 40 | -22.00 | ||||
| 2025-08-13 | 13F | Fisher Asset Management, LLC | 20,384 | 65 | ||||||
| 2025-08-05 | 13F | AGH Wealth Advisors, LLC | 0 | -100.00 | 0 | |||||
| 2025-08-12 | 13F | MAI Capital Management | 13,255 | 0.00 | 42 | -22.22 | ||||
| 2025-07-24 | 13F | Ronald Blue Trust, Inc. | 1 | 0.00 | 0 | |||||
| 2025-07-11 | 13F | Kingstone Capital Partners Texas, LLC | 23,798,618 | 173 | ||||||
| 2025-08-08 | 13F | Creative Planning | 188,464 | 14.97 | 599 | -10.86 | ||||
| 2025-08-12 | 13F | J.w. Cole Advisors, Inc. | 23,017 | -2.33 | 73 | -23.96 | ||||
| 2025-08-11 | 13F | Inspire Advisors, LLC | 27,432 | 17.15 | 87 | -9.37 | ||||
| 2025-08-06 | 13F | Legacy Investment Solutions, LLC | 639 | 0.00 | 2 | 0.00 | ||||
| 2025-08-11 | 13F | HighTower Advisors, LLC | 12,980 | 3.53 | 41 | -19.61 | ||||
| 2025-08-14 | 13F | Brevan Howard Capital Management LP | 412,695 | 204.56 | 1,312 | 136.40 | ||||
| 2025-08-19 | 13F | Cape Investment Advisory, Inc. | 559 | 0.00 | 2 | -50.00 | ||||
| 2025-08-11 | 13F | Citigroup Inc | 10 | -99.96 | 0 | -100.00 | ||||
| 2025-07-21 | 13F | Hilltop National Bank | 380 | 0.00 | 1 | 0.00 | ||||
| 2025-07-22 | 13F | Wealthcare Advisory Partners LLC | 10,852 | 4.21 | 35 | -19.05 | ||||
| 2025-08-11 | 13F | Universal- Beteiligungs- und Servicegesellschaft mbH | 105,900 | 0.00 | 337 | -22.58 | ||||
| 2025-08-14 | 13F | Sunbelt Securities, Inc. | 25,084 | -15.21 | 108 | -10.74 | ||||
| 2025-04-25 | 13F | New Wave Wealth Advisors Llc | 0 | -100.00 | 0 | |||||
| 2025-07-29 | 13F | Stephens Inc /ar/ | 16,421 | -21.51 | 52 | -38.82 | ||||
| 2025-07-31 | 13F | Caitong International Asset Management Co., Ltd | 2,954 | 1,723.46 | 9 | |||||
| 2025-08-08 | 13F | Alberta Investment Management Corp | 0 | -100.00 | 0 | |||||
| 2025-08-08 | 13F | Larson Financial Group LLC | 0 | -100.00 | 0 | |||||
| 2025-08-13 | 13F | Millstone Evans Group, LLC | 14 | 0.00 | 0 | |||||
| 2025-08-14 | 13F | Modern Wealth Management, LLC | 33,602 | 3.18 | 107 | -20.30 | ||||
| 2025-07-17 | 13F | KG&L Capital Management,LLC | 10,096 | -0.01 | 32 | -21.95 | ||||
| 2025-07-29 | 13F | Harbor Asset Planning, Inc. | 1,275 | 4 | ||||||
| 2025-08-14 | 13F | Van Eck Associates Corp | 9,388,780 | 8.47 | 30 | -17.14 | ||||
| 2025-08-28 | NP | TRIFX - Catalyst/SMH Total Return Income Fund Class A | 95,140 | 0.00 | 303 | -22.56 | ||||
| 2025-08-12 | 13F | CIBC Private Wealth Group, LLC | 1 | 0.00 | 0 | |||||
| 2025-07-25 | 13F | Cwm, Llc | 18,241 | 2,528.39 | 0 | |||||
| 2025-05-13 | 13F | Bokf, Na | 0 | -100.00 | 0 | |||||
| 2025-04-24 | 13F | Decker Retirement Planning Inc. | 0 | -100.00 | 0 | |||||
| 2025-05-13 | 13F | Quadrant Capital Group Llc | 0 | -100.00 | 0 | |||||
| 2025-07-24 | 13F | Blair William & Co/il | 53,473 | 17.27 | 170 | -8.60 | ||||
| 2025-08-14 | 13F | Citadel Advisors Llc | 0 | -100.00 | 0 | |||||
| 2025-05-06 | 13F | PFG Advisors | 0 | -100.00 | 0 | -100.00 | ||||
| 2025-07-22 | 13F | Beacon Financial Advisory LLC | 15,406 | 49 | ||||||
| 2025-07-22 | 13F | Merit Financial Group, LLC | 20,007 | 0.01 | 64 | -23.17 | ||||
| 2025-08-18 | 13F | Tactive Advisors, LLC | 586,123 | 82.54 | 1,864 | 5.14 | ||||
| 2025-07-24 | 13F | Us Bancorp \de\ | 130,000 | -1.97 | 413 | -23.94 | ||||
| 2025-08-06 | 13F | Csenge Advisory Group | 43,922 | -0.00 | 145 | -7.69 | ||||
| 2025-08-04 | 13F | IFG Advisory, LLC | 19,045 | -42.63 | 61 | -55.88 | ||||
| 2025-08-08 | 13F | Cetera Investment Advisers | 262,719 | 1.93 | 835 | -20.93 | ||||
| 2025-08-13 | 13F | Jump Financial, LLC | 27,463 | 87 | ||||||
| 2025-08-06 | 13F | Carnegie Lake Advisors LLC | 12,800 | 0.00 | 0 | |||||
| 2025-07-16 | 13F | Littlejohn Financial Services, Inc. | 58,936 | 187 | ||||||
| 2025-05-14 | 13F | CI Private Wealth, LLC | 0 | -100.00 | 0 | -100.00 | ||||
| 2025-08-14 | 13F | Two Sigma Securities, Llc | 83,912 | 187.57 | 267 | 123.53 | ||||
| 2025-08-11 | 13F | Empowered Funds, LLC | 0 | -100.00 | 0 | |||||
| 2025-05-15 | 13F | Edenbrook Capital, LLC | Put | 0 | -100.00 | 0 | ||||
| 2025-07-29 | 13F | International Assets Investment Management, Llc | 120,045 | -13.79 | 382 | -33.16 | ||||
| 2025-07-23 | 13F | Tcfg Wealth Management, Llc | 277,072 | 0.88 | 881 | -21.76 | ||||
| 2025-04-30 | 13F | Peoples Financial Services Corp. | 0 | -100.00 | 0 | |||||
| 2025-08-19 | 13F | Advisory Services Network, LLC | 11,512 | -45.41 | 36 | -59.30 | ||||
| 2025-08-13 | 13F | Northwestern Mutual Wealth Management Co | 816 | -0.12 | 3 | -33.33 | ||||
| 2025-08-14 | 13F | Ameriprise Financial Inc | 60,659 | -20.21 | 193 | -38.26 | ||||
| 2025-07-15 | 13F | Family Wealth Partners, Llc | 81,186 | 91.78 | 258 | 49.13 | ||||
| 2025-08-13 | 13F | Jones Financial Companies Lllp | 7,337 | -55.96 | 23 | -66.18 | ||||
| 2025-07-18 | 13F | Generali Investments CEE, investicni spolecnost, a.s. | 116,251 | 5.72 | 370 | -18.00 | ||||
| 2025-08-14 | 13F | Stifel Financial Corp | 194,264 | -2.88 | 618 | -24.76 | ||||
| 2025-08-14 | 13F | Two Sigma Advisers, Lp | 5,267,100 | -11.11 | 16,749 | -31.06 | ||||
| 2025-08-12 | 13F | Legal & General Group Plc | 3,048,527 | 7.14 | 9,679 | -17.13 | ||||
| 2025-08-06 | 13F | Smh Capital Advisors Inc | 145,536 | -0.55 | 463 | -22.87 | ||||
| 2025-07-17 | 13F | Sound Income Strategies, LLC | 400 | 0.00 | 1 | 0.00 | ||||
| 2025-08-18 | 13F | Wolverine Trading, Llc | Put | 34,900 | -11.87 | 111 | -32.10 | |||
| 2025-05-15 | 13F | Foursixthree Capital Lp | Call | 0 | -100.00 | 0 | ||||
| 2025-07-31 | 13F | CNB Bank | 7,500 | 0.00 | 24 | -23.33 | ||||
| 2025-08-01 | 13F | Brinker Capital Investments, LLC | 0 | -100.00 | 0 | -100.00 | ||||
| 2025-08-15 | 13F | Kestra Advisory Services, LLC | 72,054 | 4.32 | 229 | -19.08 | ||||
| 2025-08-11 | 13F | EMC Capital Management | 0 | -100.00 | 0 | |||||
| 2025-07-31 | 13F/A | Avion Wealth | 4,423 | 7.22 | 0 | |||||
| 2025-07-28 | NP | PEX - ProShares Global Listed Private Equity ETF | 78,935 | 4.06 | 260 | -22.22 | ||||
| 2025-08-15 | 13F | Captrust Financial Advisors | 24,568 | 92.24 | 78 | 50.00 | ||||
| 2025-05-12 | 13F | Independent Advisor Alliance | 0 | -100.00 | 0 | |||||
| 2025-08-08 | 13F | Sculati Wealth Management, LLC | 29,219 | -4.23 | 93 | -26.40 | ||||
| 2025-08-27 | 13F/A | Squarepoint Ops LLC | 89,263 | -21.84 | 284 | -39.53 | ||||
| 2025-05-12 | 13F | Alta Fundamental Advisers LLC | Call | 0 | -100.00 | 0 | ||||
| 2025-08-18 | 13F | Wolverine Trading, Llc | 16,725 | -7.42 | 53 | -28.38 | ||||
| 2025-08-18 | 13F | Wolverine Trading, Llc | Call | 20,000 | 3.63 | 64 | -20.25 | |||
| 2025-08-14 | 13F | Bank Of America Corp /de/ | 660,665 | 291.12 | 2,101 | 203.47 | ||||
| 2025-08-14 | 13F | Citadel Advisors Llc | Call | 25,600 | -54.69 | 81 | -64.94 | |||
| 2025-08-14 | 13F | Susquehanna International Group, Llp | 1,111,526 | 35.61 | 3,535 | 5.18 | ||||
| 2025-08-14 | 13F | Citadel Advisors Llc | Put | 468,900 | 85.92 | 1,491 | 44.20 | |||
| 2025-08-14 | 13F | Susquehanna International Group, Llp | Call | 171,400 | -49.24 | 545 | -60.62 | |||
| 2025-08-14 | 13F | Susquehanna International Group, Llp | Put | 1,265,100 | -12.05 | 4,023 | -31.78 | |||
| 2025-08-07 | 13F | Samalin Investment Counsel, LLC | 0 | -100.00 | 0 | |||||
| 2025-08-12 | 13F | Aigen Investment Management, Lp | 77,875 | 55.36 | 248 | 20.49 | ||||
| 2025-08-19 | 13F | Newbridge Financial Services Group, Inc. | 108,037 | 344 | ||||||
| 2025-08-13 | 13F | Navis Wealth Advisors, LLC | 50,000 | 16.72 | 159 | -9.14 | ||||
| 2025-07-17 | 13F | Elwood & Goetz Wealth Advisory Group, LLC | 16,437 | 52 | ||||||
| 2025-08-07 | 13F | Allworth Financial LP | 28,348 | 1,485.46 | 90 | 1,400.00 | ||||
| 2025-08-14 | 13F | Cubist Systematic Strategies, LLC | 1,149,553 | 272.31 | 3,656 | 188.93 | ||||
| 2025-08-14 | 13F | Wells Fargo & Company/mn | 146,804 | -20.87 | 467 | -38.68 | ||||
| 2025-08-04 | 13F | Creative Financial Designs Inc /adv | 9,405 | 4.20 | 30 | -21.62 | ||||
| 2025-08-05 | 13F | Huntington National Bank | 1,500 | 0.00 | 5 | -33.33 | ||||
| 2025-05-14 | 13F | Orion Portfolio Solutions, LLC | 35,315 | 0.00 | 152 | 0.00 | ||||
| 2025-07-16 | 13F | American National Bank | 10,000 | 32 | ||||||
| 2025-05-30 | NP | ERNZ - TrueShares Active Yield ETF | 564,932 | 12.55 | 2,316 | 7.07 | ||||
| 2025-08-14 | 13F | Qube Research & Technologies Ltd | 36,561 | 116 | ||||||
| 2025-08-12 | 13F | Advisors Asset Management, Inc. | 0 | -100.00 | 0 | |||||
| 2025-08-15 | 13F | Great West Life Assurance Co /can/ | 319,545 | 5.24 | 1 | 0.00 | ||||
| 2025-08-13 | 13F | Cerity Partners LLC | 15,400 | 0.00 | 49 | -23.81 | ||||
| 2025-07-22 | 13F | Global Assets Advisory, LLC | 0 | -100.00 | 0 | |||||
| 2025-05-13 | 13F | Bank Of Montreal /can/ | 0 | -100.00 | 0 | |||||
| 2025-05-14 | 13F | Rockefeller Capital Management L.P. | 0 | -100.00 | 0 | |||||
| 2025-07-14 | 13F | AdvisorNet Financial, Inc | 3,827 | 3.97 | 12 | -20.00 | ||||
| 2025-08-11 | 13F | Nomura Asset Management Co Ltd | 0 | -100.00 | 0 | |||||
| 2025-08-14 | 13F | Great Valley Advisor Group, Inc. | 20,667 | 3.86 | 66 | -19.75 | ||||
| 2025-08-18 | 13F/A | Westwood Holdings Group Inc | 93,246 | 0.00 | 297 | -22.51 | ||||
| 2025-07-17 | 13F | Janney Montgomery Scott LLC | 10,042 | -0.86 | 0 | |||||
| 2025-08-14 | 13F | Oxford Asset Management Llp | 12,974 | -62.99 | 41 | -71.33 | ||||
| 2025-08-13 | 13F | Thomas J. Herzfeld Advisors, Inc. | 0 | -100.00 | 0 | |||||
| 2025-08-14 | 13F | Dark Forest Capital Management Lp | 545,395 | 63.17 | 1,734 | 26.57 | ||||
| 2025-08-04 | 13F | Family Wealth Group, LLC | 27,945 | 89 | ||||||
| 2025-08-05 | 13F | Simplex Trading, Llc | Put | 97,700 | 146.72 | 0 | ||||
| 2025-08-05 | 13F | Sigma Planning Corp | 41,478 | -5.18 | 132 | -26.82 | ||||
| 2025-08-14 | 13F | BI Asset Management Fondsmaeglerselskab A/S | 520,592 | 1.27 | 2 | -50.00 | ||||
| 2025-06-30 | 13F/A | Deutsche Bank Ag\ | 0 | -100.00 | 0 | |||||
| 2025-08-11 | 13F | HHM Wealth Advisors, LLC | 5,372 | 0.00 | 17 | -22.73 | ||||
| 2025-07-14 | 13F | Sowell Financial Services LLC | 18,894 | -9.98 | 60 | -30.23 | ||||
| 2025-08-04 | 13F | Spire Wealth Management | 157,875 | 40.47 | 502 | 9.13 | ||||
| 2025-08-06 | 13F | LeClair Wealth Partners LLC | 105,220 | 74.98 | 335 | 35.77 | ||||
| 2025-08-13 | 13F | Northern Trust Corp | 327,411 | 232.51 | 1,041 | 158.31 | ||||
| 2025-08-13 | 13F | Centiva Capital, LP | 57,863 | 184 | ||||||
| 2025-05-15 | 13F | Foursixthree Capital Lp | Put | 0 | -100.00 | 0 | ||||
| 2025-07-30 | 13F | Dudley Capital Management, Llc | 0 | -100.00 | 0 | |||||
| 2025-07-16 | 13F | Signaturefd, Llc | 5,174 | -13.92 | 16 | -33.33 | ||||
| 2025-05-12 | 13F | Townsquare Capital Llc | 0 | -100.00 | 0 | |||||
| 2025-06-25 | NP | VPC - Virtus Private Credit Strategy ETF | 344,093 | 11.29 | 1,228 | -7.60 | ||||
| 2025-08-08 | 13F | Pnc Financial Services Group, Inc. | 16,806 | -83.89 | 53 | -87.59 | ||||
| 2025-07-29 | NP | COPY - Tweedy, Browne Insider + Value ETF | 41,928 | 146.53 | 138 | 85.14 | ||||
| 2025-05-12 | 13F | Simplex Trading, Llc | 0 | -100.00 | 0 | |||||
| 2025-05-16 | 13F | Prostatis Group LLC | 0 | -100.00 | 0 | |||||
| 2025-08-05 | 13F | Simplex Trading, Llc | Call | 96,200 | 52.22 | 0 | ||||
| 2025-08-14 | 13F | Mml Investors Services, Llc | 12,717 | -4.57 | 0 | |||||
| 2025-09-04 | 13F/A | Advisor Group Holdings, Inc. | 169,208 | -17.76 | 538 | -36.18 | ||||
| 2025-05-09 | 13F | CenterBook Partners LP | 0 | -100.00 | 0 | |||||
| 2025-07-30 | 13F | Crewe Advisors LLC | 2,362 | 141.27 | 8 | 75.00 | ||||
| 2025-08-06 | 13F | Ethos Financial Group, LLC | 43,547 | 0.06 | 138 | -22.47 | ||||
| 2025-08-11 | 13F | Shufro Rose & Co Llc | 12,700 | 0.00 | 52 | 0.00 | ||||
| 2025-07-31 | 13F | Catalyst Capital Advisors LLC | 95,140 | 0.00 | 303 | -22.56 | ||||
| 2025-08-13 | 13F | Level Four Advisory Services, Llc | 21,320 | 0.84 | 68 | -22.09 | ||||
| 2025-07-30 | 13F/A | Old Point Trust & Financial Services N A | 300 | 1 | ||||||
| 2025-08-11 | 13F | Principal Securities, Inc. | 151 | 0.00 | 0 | |||||
| 2025-08-14 | 13F | Garden State Investment Advisory Services LLC | 72,635 | 1.01 | 231 | -21.77 | ||||
| 2025-07-16 | 13F | West Branch Capital LLC | 514 | 2.80 | 2 | -50.00 | ||||
| 2025-08-13 | 13F | Lido Advisors, LLC | 135,073 | 222.73 | 435 | 151.45 | ||||
| 2025-07-29 | 13F | Activest Wealth Management | 3,300 | 0.00 | 10 | -23.08 | ||||
| 2025-08-15 | 13F | Semmax Financial Advisors Inc. | 1,524 | 2.97 | 4 | -20.00 | ||||
| 2025-08-18 | 13F | Geneos Wealth Management Inc. | 1,500 | -34.78 | 5 | -55.56 | ||||
| 2025-07-07 | 13F | Teamwork Financial Advisors, LLC | 15,874 | -49.18 | 50 | -60.94 | ||||
| 2025-05-16 | 13F | Coppell Advisory Solutions LLC | 0 | -100.00 | 0 | |||||
| 2025-07-31 | 13F | 180 Wealth Advisors, Llc | 83,839 | 368.71 | 267 | 264.38 | ||||
| 2025-08-12 | 13F | Trexquant Investment LP | 0 | -100.00 | 0 | |||||
| 2025-05-15 | 13F | Barclays Plc | 0 | -100.00 | 0 | |||||
| 2025-07-21 | 13F | West Financial Advisors, LLC | 274 | -47.21 | 1 | -100.00 | ||||
| 2025-08-04 | 13F | Kovack Advisors, Inc. | 345,080 | 146.54 | 1,097 | 91.45 | ||||
| 2025-07-31 | 13F | Buckingham Strategic Partners | 86,730 | 81.15 | 276 | 40.31 | ||||
| 2025-08-14 | 13F | Engineers Gate Manager LP | 111,594 | 492.04 | 355 | 359.74 | ||||
| 2025-07-11 | 13F | Farther Finance Advisors, LLC | 1,455 | 0.00 | 5 | -20.00 | ||||
| 2025-07-25 | 13F | Cypress Capital Group | 56,400 | 179 | ||||||
| 2025-08-14 | 13F | Jane Street Group, Llc | Call | 22,900 | -27.30 | 73 | -44.19 | |||
| 2025-08-13 | 13F | Marshall Wace, Llp | 3,907,025 | 12,424 | ||||||
| 2025-08-06 | 13F | Legacy Wealth Managment, LLC/ID | 639 | 0.00 | 2 | 0.00 | ||||
| 2025-08-12 | 13F | BlackRock, Inc. | 1,972,468 | 32.71 | 6,272 | 2.92 | ||||
| 2025-08-14 | 13F | Comerica Bank | 51,051 | 0.33 | 162 | -22.12 | ||||
| 2025-07-18 | 13F | Founders Capital Management | 4,000 | 0.00 | 13 | -25.00 | ||||
| 2025-08-08 | 13F | Kingsview Wealth Management, LLC | 18,490 | -0.10 | 59 | -22.67 | ||||
| 2025-08-25 | 13F | Silverlake Wealth Management Llc | 14,545 | 1.61 | 46 | -20.69 | ||||
| 2025-08-14 | 13F | Jane Street Group, Llc | Put | 0 | -100.00 | 0 | ||||
| 2025-08-08 | 13F | Smithfield Trust Co | 47 | 0.00 | 0 | |||||
| 2025-08-13 | 13F | Quantbot Technologies LP | 240,709 | 45,575.33 | 765 | 38,150.00 | ||||
| 2025-07-11 | 13F | Ridgeline Wealth, LLC | 94,334 | 0.00 | 300 | -22.54 | ||||
| 2025-07-28 | 13F | Naviter Wealth, LLC | 680,135 | 50.29 | 2,183 | 15.94 | ||||
| 2025-08-14 | 13F | GWM Advisors LLC | 12 | -80.00 | 0 | |||||
| 2025-08-12 | 13F | Cutter & CO Brokerage, Inc. | 0 | -100.00 | 0 | |||||
| 2025-08-14 | 13F | Mariner, LLC | 56,093 | -10.24 | 178 | -30.47 | ||||
| 2025-08-14 | 13F | Headlands Technologies LLC | 11,839 | -81.22 | 38 | -85.66 | ||||
| 2025-08-13 | 13F | Garner Asset Management Corp | 49,267 | -10.29 | 157 | -30.67 | ||||
| 2025-07-10 | 13F | Wealth Enhancement Advisory Services, Llc | 33,694 | -9.63 | 112 | -26.97 | ||||
| 2025-07-30 | 13F | Berkeley Capital Partners, LLC | 13,426 | 43 | ||||||
| 2025-07-30 | 13F | Denali Advisors Llc | 124,960 | -2.56 | 397 | -24.38 | ||||
| 2025-04-28 | 13F | Detalus Advisors, LLC | 0 | -100.00 | 0 | |||||
| 2025-07-29 | 13F | TrueMark Investments, LLC | 0 | -100.00 | 0 | |||||
| 2025-08-14 | 13F | Graney & King, LLC | 0 | -100.00 | 0 | |||||
| 2025-04-03 | 13F | Central Pacific Bank - Trust Division | 0 | -100.00 | 0 | -100.00 | ||||
| 2025-08-14 | 13F | Jane Street Group, Llc | 0 | -100.00 | 0 | |||||
| 2025-05-06 | 13F | Wedbush Securities Inc | 0 | -100.00 | 0 | |||||
| 2025-05-14 | 13F | Virtus ETF Advisers LLC | 0 | -100.00 | 0 | |||||
| 2025-07-21 | 13F | Ameritas Advisory Services, LLC | 6,460 | 21 | ||||||
| 2025-07-29 | 13F | Stratos Wealth Partners, LTD. | 53,837 | -0.64 | 171 | -22.97 | ||||
| 2025-07-24 | 13F | IFP Advisors, Inc | 20,319 | 2,609.20 | 65 | 2,033.33 | ||||
| 2025-08-14 | 13F | Group One Trading, L.p. | Call | 79,800 | 111.67 | 254 | 64.29 | |||
| 2025-08-14 | 13F | Group One Trading, L.p. | 105,260 | 278.27 | 335 | 192.98 | ||||
| 2025-08-11 | 13F | Heritage Wealth Advisors | 100 | 0.00 | 0 | |||||
| 2025-08-07 | 13F | Kestra Private Wealth Services, Llc | 204,412 | 3.20 | 650 | -19.95 | ||||
| 2025-08-14 | 13F | Group One Trading, L.p. | Put | 274,300 | 108.28 | 872 | 61.78 | |||
| 2025-05-13 | 13F | Horizon Investments, LLC | 0 | -100.00 | 0 | |||||
| 2025-08-04 | 13F | Arkadios Wealth Advisors | 44,218 | 18.44 | 141 | -8.50 | ||||
| 2025-08-13 | 13F | Virtus Investment Advisers, Inc. | 424,478 | 12.68 | 1,350 | -12.63 | ||||
| 2025-07-24 | 13F | WMG Financial Advisors, LLC | 27,950 | 0.00 | 89 | -22.81 | ||||
| 2025-08-12 | 13F | OneAscent Investment Solutions LLC | 33,243 | 0 | ||||||
| 2025-08-04 | 13F | Hantz Financial Services, Inc. | 3 | 0 | ||||||
| 2025-08-14 | 13F | Mercer Global Advisors Inc /adv | 21,332 | -32.65 | 68 | -48.06 | ||||
| 2025-07-21 | 13F | Ameriflex Group, Inc. | 0 | -100.00 | 0 | |||||
| 2025-05-15 | 13F | Concorde Asset Management, LLC | 72,900 | 149.23 | 271 | 115.08 | ||||
| 2025-08-14 | 13F | Glenview Trust Co | 14,788 | -83.70 | 47 | -87.33 | ||||
| 2025-04-29 | 13F | Hexagon Capital Partners LLC | 0 | -100.00 | 0 | |||||
| 2025-07-29 | 13F | Private Trust Co Na | 11,639 | 38.54 | 37 | 8.82 | ||||
| 2025-07-31 | 13F | Wealthfront Advisers Llc | 38,988 | 130.85 | 124 | 78.26 | ||||
| 2025-08-11 | 13F | Regal Investment Advisors LLC | 18,136 | -19.76 | 58 | -38.04 | ||||
| 2025-08-01 | 13F | Bessemer Group Inc | 40,000 | 0.00 | 0 | |||||
| 2025-08-13 | 13F | EverSource Wealth Advisors, LLC | 117 | -47.30 | 0 | |||||
| 2025-05-15 | 13F | Wiley Bros.-aintree Capital, Llc | 0 | -100.00 | 0 | |||||
| 2025-05-08 | 13F | XTX Topco Ltd | 0 | -100.00 | 0 | |||||
| 2025-08-14 | 13F | Bnp Paribas Arbitrage, Sa | 495,334 | 14.84 | 1,575 | -10.92 | ||||
| 2025-07-31 | 13F | Cambridge Investment Research Advisors, Inc. | 347,347 | 12.65 | 1 | 0.00 | ||||
| 2025-08-06 | 13F | Cherry Creek Investment Advisors, Inc. | 49,031 | 1.40 | 156 | -21.72 | ||||
| 2025-08-14 | 13F | Royal Bank Of Canada | 53,577 | -15.15 | 170 | -34.36 | ||||
| 2025-08-08 | 13F | Strategies Wealth Advisors, LLC | 37,915 | 4.20 | 121 | -19.46 | ||||
| 2025-08-14 | 13F | Raymond James Financial Inc | 844,465 | 0.46 | 2,685 | -22.08 | ||||
| 2025-08-15 | 13F | Equitable Holdings, Inc. | 0 | -100.00 | 0 | |||||
| 2025-07-16 | 13F | Kathmere Capital Management, LLC | 69,462 | 0.00 | 221 | -22.54 | ||||
| 2025-08-14 | 13F | Balyasny Asset Management Llc | 5,661,121 | 73.88 | 18,002 | 34.87 | ||||
| 2025-08-14 | 13F | Ausdal Financial Partners, Inc. | 25,841 | -3.28 | 82 | -24.77 | ||||
| 2025-07-10 | 13F | Exchange Traded Concepts, Llc | 66,944 | 170.91 | 213 | 109.90 | ||||
| 2025-07-30 | 13F | Gables Capital Management Inc. | 0 | -100.00 | 0 | |||||
| 2025-08-14 | 13F | Two Sigma Investments, Lp | 2,049,735 | -40.74 | 6,518 | -54.04 | ||||
| 2025-08-21 | NP | BIZD - VanEck Vectors BDC Income ETF | 8,286,067 | 3.25 | 26,350 | -19.92 | ||||
| 2025-07-31 | 13F | Oppenheimer & Co Inc | 15,878 | -7.03 | 50 | -28.57 | ||||
| 2025-08-07 | 13F | Cypress Capital Management LLC (WY) | 2,145 | 2.48 | 7 | -25.00 | ||||
| 2025-08-12 | 13F | Proequities, Inc. | Put | 0 | 0 | |||||
| 2025-08-12 | 13F | Proequities, Inc. | Call | 0 | 0 | |||||
| 2025-08-12 | 13F | Proequities, Inc. | 0 | 0 | ||||||
| 2025-06-27 | NP | LBO - WHITEWOLF Publicly Listed Private Equity ETF | 88,397 | 14.28 | 316 | -5.12 | ||||
| 2025-07-30 | 13F | D.a. Davidson & Co. | 351,494 | 1.33 | 1,118 | -21.45 | ||||
| 2025-08-11 | 13F | Lsv Asset Management | 563,735 | 0.00 | 2 | -50.00 | ||||
| 2025-07-08 | 13F | Parallel Advisors, LLC | 4,685 | -27.62 | 15 | -46.15 | ||||
| 2025-07-15 | 13F | Significant Wealth Partners LLC | 11,283 | 36 | ||||||
| 2025-08-12 | 13F | Cravens & Co Advisors, LLC | 20,000 | 0.00 | 64 | -23.17 | ||||
| 2025-08-14 | 13F | Aquatic Capital Management LLC | 0 | -100.00 | 0 | |||||
| 2025-08-14 | 13F | BancorpSouth Bank | 37,459 | 3.97 | 119 | -19.05 | ||||
| 2025-07-08 | 13F | Next Level Private LLC | 32,375 | 2.27 | 103 | -20.93 | ||||
| 2025-07-18 | 13F | PFG Investments, LLC | 13,864 | -97.78 | 44 | -98.28 | ||||
| 2025-08-12 | 13F | Virtu Financial LLC | 40,288 | 83.41 | 0 | |||||
| 2025-07-28 | 13F | Harbour Investments, Inc. | 39,173 | 3.59 | 125 | -20.00 | ||||
| 2025-08-14 | 13F | Hrt Financial Lp | 52,484 | -85.40 | 0 | -100.00 | ||||
| 2025-07-24 | 13F | Capital Advisors, Ltd. LLC | 12,352 | 0 | ||||||
| 2025-08-05 | 13F | Palogic Value Management, L.P. | 367,397 | 0.64 | 1,168 | -21.93 | ||||
| 2025-08-13 | 13F | Rsm Us Wealth Management Llc | 0 | -100.00 | 0 | |||||
| 2025-05-01 | 13F | BankPlus Trust Department | 0 | -100.00 | 0 | |||||
| 2025-07-30 | NP | ORR - Militia Long/Short Equity ETF | Short | -588,203 | -1,935 | |||||
| 2025-08-05 | 13F | Ellevest, Inc. | 0 | -100.00 | 0 | |||||
| 2025-07-16 | 13F | ORG Partners LLC | 5 | 0.00 | 0 | |||||
| 2025-07-25 | 13F | LRI Investments, LLC | 638 | 0.00 | 2 | 0.00 | ||||
| 2025-07-29 | NP | ISMD - Inspire Small/Mid Cap Impact ETF | 88,592 | 0.68 | 291 | -24.81 | ||||
| 2025-08-13 | 13F/A | StoneX Group Inc. | 10,186 | 55 | ||||||
| 2025-04-28 | 13F | Strategic Financial Concepts, LLC | 0 | -100.00 | 0 | |||||
| 2025-08-01 | 13F | Envestnet Asset Management Inc | 18,975 | -98.39 | 60 | -98.76 | ||||
| 2025-08-15 | 13F | Tower Research Capital LLC (TRC) | 3,635 | -94.27 | 12 | -95.75 | ||||
| 2025-08-07 | 13F | ProShare Advisors LLC | 73,829 | -1.66 | 235 | -23.78 | ||||
| 2025-08-14 | 13F | DRW Securities, LLC | 136,429 | 434 | ||||||
| 2025-05-05 | 13F | Lindbrook Capital, Llc | 430 | 551.52 | 2 | |||||
| 2025-08-14 | 13F | Ieq Capital, Llc | 0 | -100.00 | 0 | |||||
| 2025-08-06 | 13F | AE Wealth Management LLC | 11,792 | -31.09 | 37 | -47.14 | ||||
| 2025-08-14 | 13F | Tudor Investment Corp Et Al | 2,322,167 | 1,444.05 | 7,384 | 1,098.70 | ||||
| 2025-08-12 | 13F | Summit Global Investments | 75,000 | 0.00 | 0 | |||||
| 2025-08-19 | 13F | Asset Dedication, LLC | 5,880 | 0.00 | 19 | -25.00 | ||||
| 2025-05-15 | 13F | Caption Management, LLC | Put | 0 | -100.00 | 0 | -100.00 | |||
| 2025-05-09 | 13F | Atria Wealth Solutions, Inc. | 0 | -100.00 | 0 | |||||
| 2025-07-17 | 13F | XML Financial, LLC | 644,604 | -28.26 | 2,050 | -44.37 | ||||
| 2025-08-15 | 13F | Caxton Associates Llp | 690,059 | 86.46 | 2,194 | 44.63 | ||||
| 2025-08-11 | 13F | Annis Gardner Whiting Capital Advisors, LLC | 5 | 0 | ||||||
| 2025-08-14 | 13F | Manufacturers Life Insurance Company, The | 0 | -100.00 | 0 | |||||
| 2025-08-05 | 13F | GPS Wealth Strategies Group, LLC | 25 | 0.00 | 0 | |||||
| 2025-04-04 | 13F | Webster Bank, N. A. | 0 | -100.00 | 0 | |||||
| 2025-05-14 | 13F | Van Hulzen Asset Management, LLC | 0 | -100.00 | 0 | |||||
| 2025-08-08 | 13F | Avantax Advisory Services, Inc. | 68,490 | 13.48 | 218 | -12.15 | ||||
| 2025-07-29 | 13F | First National Bank of Mount Dora, Trust Investment Services | 15,300 | 0.00 | 49 | -22.58 | ||||
| 2025-08-12 | 13F | Steward Partners Investment Advisory, Llc | 7,002 | 0.03 | 22 | -21.43 | ||||
| 2025-08-14 | 13F | UBS Group AG | 3,607,351 | 40.40 | 11,471 | 8.90 | ||||
| 2025-08-12 | 13F | DnB Asset Management AS | 301,970 | 0.00 | 960 | -22.46 | ||||
| 2025-07-18 | 13F | Trust Co Of Vermont | 1,250 | 4 | ||||||
| 2025-05-14 | 13F | ExodusPoint Capital Management, LP | 0 | -100.00 | 0 | |||||
| 2025-08-14 | 13F | Schonfeld Strategic Advisors LLC | 0 | -100.00 | 0 | |||||
| 2025-08-12 | 13F | Jpmorgan Chase & Co | 22,475 | -58.05 | 71 | -67.58 | ||||
| 2025-08-08 | 13F/A | Sequoia Financial Advisors, LLC | 0 | -100.00 | 0 | |||||
| 2025-07-28 | 13F | Frazier Financial Advisors, LLC | 0 | -100.00 | 0 | |||||
| 2025-08-12 | 13F | LPL Financial LLC | 854,917 | -14.67 | 2,719 | -33.82 | ||||
| 2025-05-15 | 13F | Centiva Capital, LP | Put | 0 | -100.00 | 0 | -100.00 | |||
| 2025-08-11 | 13F | Private Advisor Group, LLC | 1,516,463 | 157.16 | 4,822 | 99.50 | ||||
| 2025-08-14 | 13F | Verition Fund Management LLC | 181,553 | 577 | ||||||
| 2025-08-12 | 13F | Global Retirement Partners, LLC | 15,200 | 321.17 | 48 | 220.00 | ||||
| 2025-08-14 | 13F | Millennium Management Llc | Put | 100,000 | -7.75 | 318 | -28.38 | |||
| 2025-05-07 | 13F | Sheaff Brock Investment Advisors, LLC | 26,535 | -6.92 | 109 | -11.48 | ||||
| 2025-08-08 | 13F | Foundations Investment Advisors, LLC | 11,832 | 38 | ||||||
| 2025-07-21 | 13F | Barrett & Company, Inc. | 49,198 | 1.13 | 156 | -21.61 | ||||
| 2025-08-11 | 13F | VSM Wealth Advisory, LLC | 6,653 | 7.97 | 21 | -16.00 | ||||
| 2025-07-18 | 13F | Truist Financial Corp | 189,538 | 0.00 | 603 | -22.52 | ||||
| 2025-07-29 | 13F | Tweedy, Browne Co LLC | 67,032 | 119.33 | 213 | 70.40 | ||||
| 2025-08-13 | 13F | M&t Bank Corp | 0 | -100.00 | 0 | |||||
| 2025-08-13 | 13F | Natixis | 848 | 4.05 | 3 | -33.33 | ||||
| 2025-07-24 | 13F | CWM Advisors, LLC | 123,278 | 47.00 | 392 | 14.29 | ||||
| 2025-08-11 | 13F | Traub Capital Management LLC | 18 | 0 | ||||||
| 2025-07-24 | 13F | Comprehensive Money Management Services LLC | 15,550 | -11.40 | 49 | -30.99 | ||||
| 2025-08-14 | 13F | Point72 Asia (Singapore) Pte. Ltd. | 5 | 0.00 | 0 | |||||
| 2025-08-14 | 13F | Shaolin Capital Management LLC | 50,000 | 159 | ||||||
| 2025-08-14 | 13F | Millennium Management Llc | 1,465,675 | 1,127.51 | 4,661 | 852.97 | ||||
| 2025-08-14 | 13F | Shaolin Capital Management LLC | Put | 400,000 | 1,272 | |||||
| 2025-08-14 | 13F | Point72 Asset Management, L.P. | Put | 0 | -100.00 | 0 | ||||
| 2025-08-14 | 13F | Goldman Sachs Group Inc | 208,892 | -46.85 | 664 | -58.78 | ||||
| 2025-05-15 | 13F | Sage Capital Management, LLC | 0 | -100.00 | 0 | |||||
| 2025-08-06 | 13F | Prospera Financial Services Inc | 60,036 | -20.94 | 191 | -38.91 | ||||
| 2025-08-13 | 13F | Guggenheim Capital Llc | 107,829 | 8.30 | 343 | -16.18 | ||||
| 2025-05-15 | 13F | D. E. Shaw & Co., Inc. | 0 | -100.00 | 0 | |||||
| 2025-08-07 | 13F | Traynor Capital Management, Inc. | 12,184 | 0.26 | 39 | -20.41 | ||||
| 2025-05-12 | 13F | Fmr Llc | 0 | -100.00 | 0 | |||||
| 2025-08-13 | 13F | Philadelphia Trust Co | 48,200 | -26.64 | 0 | |||||
| 2025-08-06 | 13F | Commonwealth Equity Services, Llc | 1,031,255 | -31.64 | 3 | -50.00 | ||||
| 2025-05-14 | 13F | Envision Financial Planning, LLC | 0 | -100.00 | 0 |
Other Listings
| GB:0R25 | US$ 2.91 |