Mga Batayang Estadistika
| Pemilik Institusional | 214 total, 214 long only, 0 short only, 0 long/short - change of 4.37% MRQ |
| Alokasi Portofolio Rata-rata | 0.2887 % - change of 10.02% MRQ |
| Saham Institusional (Jangka Panjang) | 34,265,953 (ex 13D/G) - change of 2.88MM shares 9.17% MRQ |
| Nilai Institusional (Jangka Panjang) | $ 1,837,343 USD ($1000) |
Kepemilikan Institusional dan Pemegang Saham
Invesco Exchange-Traded Fund Trust II - Invesco RAFI Developed Markets ex-U.S. ETF (US:PXF) memiliki 214 pemilik institusional dan pemegang saham yang telah mengajukan formulir 13D/G atau 13F kepada Komisi Bursa Efek (Securities Exchange Commission/SEC). Lembaga-lembaga ini memegang total 34,265,953 saham. Pemegang saham terbesar meliputi Charles Schwab Investment Management Inc, Invesco Ltd., Proficio Capital Partners LLC, Morgan Stanley, AIM GROWTH SERIES (INVESCO GROWTH SERIES) - Invesco Oppenheimer Portfolio Series: Active Allocation Fund Class R5, Victory Capital Management Inc, AIM GROWTH SERIES (INVESCO GROWTH SERIES) - Invesco Oppenheimer Portfolio Series: Moderate Investor Fund Class C, Bank Of America Corp /de/, Bank of New York Mellon Corp, and USCRX - Cornerstone Moderately Aggressive Fund .
Struktur kepemilikan institusional Invesco Exchange-Traded Fund Trust II - Invesco RAFI Developed Markets ex-U.S. ETF (ARCA:PXF) menunjukkan posisi terkini di perusahaan oleh institusi dan dana, serta perubahan terbaru dalam ukuran posisi. Pemegang saham utama dapat mencakup investor individu, reksa dana, dana lindung nilai, atau institusi. Jadwal 13D menunjukkan bahwa investor memegang (atau pernah memegang) lebih dari 5% saham perusahaan dan bermaksud (atau pernah bermaksud) untuk secara aktif mengejar perubahan strategi bisnis. Jadwal 13G menunjukkan investasi pasif lebih dari 5%.
The share price as of September 5, 2025 is 60.36 / share. Previously, on September 6, 2024, the share price was 49.99 / share. This represents an increase of 20.75% over that period.

Skor Sentimen Dana
Skor Sentimen Dana (sebelumnya dikenal sebagai Skor Akumulasi Kepemilikan) menemukan saham-saham yang paling banyak dibeli oleh dana. Ini adalah hasil dari model kuantitatif multi-faktor yang canggih yang mengidentifikasi perusahaan dengan tingkat akumulasi institusional tertinggi. Model penilaian menggunakan kombinasi dari total peningkatan pemilik yang diungkapkan, perubahan dalam alokasi portofolio pada pemilik tersebut, dan metrik lainnya. Angka berkisar dari 0 hingga 100, dengan angka yang lebih tinggi menunjukkan tingkat akumulasi yang lebih tinggi dibandingkan dengan perusahaan sejenisnya, dan 50 adalah rata-ratanya.
Frekuensi Pembaruan: Setiap Hari
Lihat Ownership Explorer, yang menyediakan daftar perusahaan dengan peringkat tertinggi.
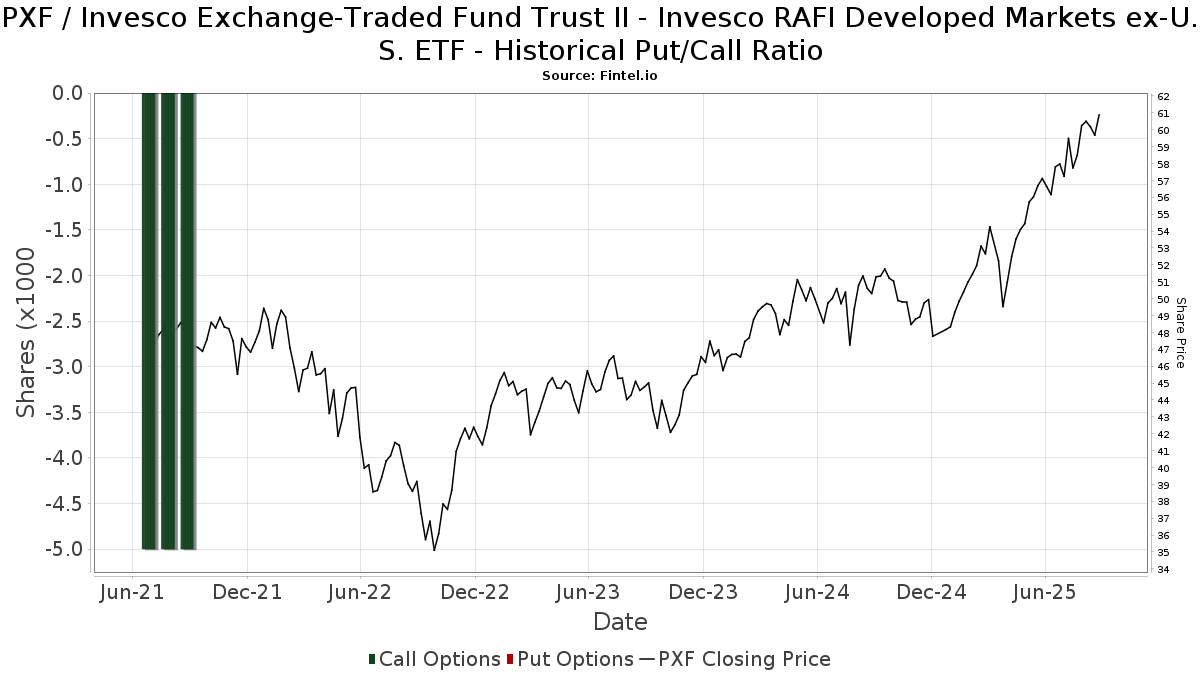
Rasio Put/Call Institusional
Selain melaporkan isu ekuitas dan utang standar, institusi dengan aset di bawah manajemen lebih dari 100 juta dolar AS juga harus mengungkapkan kepemilikan opsi put dan call mereka. Karena opsi put umumnya menunjukkan sentimen negatif, dan opsi call menunjukkan sentimen positif, kita dapat mengetahui sentimen institusional secara keseluruhan dengan memplot rasio put terhadap call. Grafik di sebelah kanan memplot rasio put/call historis untuk instrumen ini.
Menggunakan Rasio Put/Call sebagai indikator sentimen investor mengatasi salah satu kekurangan utama dari penggunaan total kepemilikan institusional, yaitu sejumlah besar aset yang dikelola diinvestasikan secara pasif untuk melacak indeks. Dana yang dikelola secara pasif biasanya tidak membeli opsi, sehingga indikator rasio put/call lebih akurat dalam melacak sentimen dana yang dikelola secara aktif.
Pengajuan 13F dan NPORT
Detail pada pengajuan 13F tersedia gratis. Detail pada pengajuan NP memerlukan keanggotaan premium. Baris berwarna hijau menunjukkan posisi baru. Baris berwarna merah menunjukkan posisi yang sudah ditutup. Klik tautan ini ikon untuk melihat riwayat transaksi selengkapnya.
Tingkatkan
untuk membuka data premium dan mengekspor ke Excel ![]() .
.
| Tanggal File | Sumber | Investor | Ketik | Presyo ng Avg (Silangan) |
Saham | Δ Saham (%) |
Dilaporkan Nilai ($1000) |
Nilai Δ (%) |
Alokasi Port (%) |
|
|---|---|---|---|---|---|---|---|---|---|---|
| 2025-07-23 | 13F | Bellevue Asset Management, Llc | 721 | 0.84 | 41 | 10.81 | ||||
| 2025-07-30 | 13F | Cullen/frost Bankers, Inc. | 154 | 9 | ||||||
| 2025-07-24 | 13F | Blair William & Co/il | 1,030 | 0.39 | 59 | 11.32 | ||||
| 2025-08-15 | 13F | Morgan Stanley | 1,322,481 | 23.87 | 75,937 | 36.81 | ||||
| 2025-05-02 | 13F | United Community Bank | 0 | -100.00 | 0 | |||||
| 2025-04-30 | 13F | Ridgeline Wealth Planning, LLC | 0 | -100.00 | 0 | |||||
| 2025-08-04 | 13F | Bristlecone Advisors, LLC | 0 | -100.00 | 0 | |||||
| 2025-07-25 | 13F | McNamara Financial Services, Inc. | 3,949 | -2.06 | 227 | 8.13 | ||||
| 2025-07-25 | 13F | NorthRock Partners, LLC | 946 | -76.24 | 54 | -73.79 | ||||
| 2025-08-14 | 13F | Federation des caisses Desjardins du Quebec | 3,423 | 0.00 | 197 | 10.73 | ||||
| 2025-07-23 | 13F | Godsey & Gibb Associates | 311 | 18 | ||||||
| 2025-07-28 | 13F | Deroy & Devereaux Private Investment Counsel Inc | 3,570 | 0 | ||||||
| 2025-08-11 | 13F | Rothschild Investment Llc | 21,455 | 7.84 | 1,232 | 19.05 | ||||
| 2025-08-12 | 13F | RiverFront Investment Group, LLC | 4,583 | 263 | ||||||
| 2025-05-06 | 13F | Lifeworks Advisors, LLC | 0 | -100.00 | 0 | |||||
| 2025-08-08 | 13F | Emerald Investment Partners, Llc | 457 | -3.18 | 26 | 8.33 | ||||
| 2025-05-22 | 13F | Mattson Financial Services, LLC | 0 | -100.00 | 0 | |||||
| 2025-07-28 | 13F | Aries Wealth Management | 23,596 | 0.00 | 1,355 | 10.44 | ||||
| 2025-08-14 | 13F | Warren Averett Asset Management, LLC | 68,445 | -0.20 | 3,930 | 10.24 | ||||
| 2025-07-08 | 13F | Zrc Wealth Management, Llc | 205 | 1.49 | 12 | 10.00 | ||||
| 2025-07-24 | 13F | Jfs Wealth Advisors, Llc | 12,483 | -2.04 | 717 | 8.16 | ||||
| 2025-07-16 | 13F | Octavia Wealth Advisors, LLC | 11,235 | 0.00 | 645 | 10.45 | ||||
| 2025-07-28 | 13F | Cutler Investment Counsel Llc | 3,695 | 212 | ||||||
| 2025-08-08 | 13F | Creative Planning | 70,917 | 3.78 | 4,072 | 14.64 | ||||
| 2025-07-21 | 13F | Quent Capital, LLC | 0 | -100.00 | 0 | |||||
| 2025-07-28 | 13F | Harbour Investments, Inc. | 883 | 103.93 | 51 | 127.27 | ||||
| 2025-05-05 | 13F | Private Advisor Group, LLC | 0 | -100.00 | 0 | |||||
| 2025-05-15 | 13F | Glenmede Trust Co Na | 65,345 | -0.84 | 3,397 | 7.67 | ||||
| 2025-08-12 | 13F | Archer Investment Corp | 66,099 | 1.65 | 3,795 | 12.28 | ||||
| 2025-08-01 | 13F | Envestnet Asset Management Inc | 92,898 | -5.25 | 5,293 | 3.83 | ||||
| 2025-08-11 | 13F | Aptus Capital Advisors, LLC | 2,729 | -0.44 | 157 | 9.86 | ||||
| 2025-08-05 | 13F | Plante Moran Financial Advisors, LLC | 0 | -100.00 | 0 | |||||
| 2025-08-12 | 13F | Coston, McIsaac & Partners | 150 | 0.00 | 0 | |||||
| 2025-08-15 | 13F | CI Private Wealth, LLC | 480,380 | -10.79 | 27,583 | -1.48 | ||||
| 2025-08-12 | 13F | Shakespeare Wealth Management, Inc. | 26,941 | -20.34 | 1,547 | -12.06 | ||||
| 2025-08-28 | NP | AIM GROWTH SERIES (INVESCO GROWTH SERIES) - Invesco Oppenheimer Portfolio Series: Active Allocation Fund Class R5 | 1,215,737 | 8.54 | 69,808 | 19.88 | ||||
| 2025-08-14 | 13F | Ieq Capital, Llc | 9,483 | 0.00 | 545 | 10.34 | ||||
| 2025-08-12 | 13F | Integrated Advisors Network LLC | 24,237 | -14.03 | 1,392 | -5.05 | ||||
| 2025-07-14 | 13F | Abound Wealth Management | 1,073 | 62 | ||||||
| 2025-07-16 | 13F | Moisand Fitzgerald Tamayo, LLC | 477 | 0.00 | 27 | 12.50 | ||||
| 2025-08-11 | 13F | WPG Advisers, LLC | 195 | 0.00 | 11 | 10.00 | ||||
| 2025-07-14 | 13F | AdvisorNet Financial, Inc | 46 | 0.00 | 3 | 0.00 | ||||
| 2025-08-12 | 13F | Cornerstone Wealth Management, LLC | 51,885 | 9.06 | 2,979 | 20.46 | ||||
| 2025-08-14 | 13F | Hara Capital LLC | 477 | 0.00 | 27 | 12.50 | ||||
| 2025-04-23 | 13F | Oppenheimer & Co Inc | 0 | -100.00 | 0 | -100.00 | ||||
| 2025-07-21 | 13F | Empirical Financial Services, LLC d.b.a. Empirical Wealth Management | 4,130 | -5.01 | 237 | 4.87 | ||||
| 2025-08-14 | 13F | Comerica Bank | 7,185 | -4.82 | 413 | 5.10 | ||||
| 2025-07-11 | 13F | Farther Finance Advisors, LLC | 33 | 0.00 | 2 | 0.00 | ||||
| 2025-07-31 | 13F | Wealthfront Advisers Llc | 8,555 | -11.54 | 491 | -2.19 | ||||
| 2025-08-08 | 13F | Hartland & Co., LLC | 0 | -100.00 | 0 | |||||
| 2025-08-13 | 13F | Northern Trust Corp | 4,161 | 239 | ||||||
| 2025-07-08 | 13F | Webster Bank, N. A. | 61 | 0.00 | 4 | 0.00 | ||||
| 2025-08-12 | 13F | Rather & Kittrell, Inc. | 16,351 | -1.32 | 939 | 8.94 | ||||
| 2025-07-17 | 13F/A | Capital Investment Advisors, LLC | 4,182 | 240 | ||||||
| 2025-07-25 | 13F | Cwm, Llc | 3,551 | -23.07 | 0 | |||||
| 2025-07-29 | 13F | Harbor Asset Planning, Inc. | 1,138 | 65 | ||||||
| 2025-07-17 | 13F | Charles Schwab Trust Co | 378,017 | 10.81 | 21,706 | 22.38 | ||||
| 2025-08-13 | 13F | Cerity Partners LLC | 27,281 | -9.76 | 1,566 | -0.32 | ||||
| 2025-08-14 | 13F | Quantinno Capital Management LP | 7,764 | 57.26 | 446 | 73.83 | ||||
| 2025-07-17 | 13F | KWB Wealth | 49,696 | -7.62 | 2,584 | 0.27 | ||||
| 2025-08-13 | 13F | Capital Analysts, Inc. | 1,099 | 0.64 | 0 | |||||
| 2025-08-11 | 13F | Bell Investment Advisors, Inc | 492 | 113.91 | 28 | 154.55 | ||||
| 2025-08-14 | 13F | Garden State Investment Advisory Services LLC | 57,531 | 60.77 | 3,304 | 77.58 | ||||
| 2025-08-13 | 13F | Townsquare Capital Llc | 0 | -100.00 | 0 | |||||
| 2025-04-22 | 13F | Cordant, Inc. | 0 | -100.00 | 0 | |||||
| 2025-07-24 | 13F | Ronald Blue Trust, Inc. | 695 | 0.00 | 40 | 8.33 | ||||
| 2025-08-12 | 13F | Jpmorgan Chase & Co | 116,602 | 64.29 | 6,695 | 81.44 | ||||
| 2025-07-24 | 13F | IFP Advisors, Inc | 2,680 | 3.88 | 154 | 14.18 | ||||
| 2025-08-15 | 13F | WFA of San Diego, LLC | 11,761 | -1.41 | 675 | 8.70 | ||||
| 2025-08-14 | 13F | Financial Advisory Service, Inc. | 493 | 0.00 | 28 | 12.00 | ||||
| 2025-07-10 | 13F | Redhawk Wealth Advisors, Inc. | 83,720 | 4,807 | ||||||
| 2025-08-15 | 13F | Binnacle Investments Inc | 114 | 7 | ||||||
| 2025-08-28 | NP | AIM GROWTH SERIES (INVESCO GROWTH SERIES) - Invesco Oppenheimer Portfolio Series: Moderate Investor Fund Class C | 884,052 | 1.55 | 50,762 | 12.15 | ||||
| 2025-08-08 | 13F | Avantax Advisory Services, Inc. | 22,396 | 1.00 | 1,286 | 11.55 | ||||
| 2025-08-14 | 13F | Betterment LLC | 3,521 | -29.15 | 0 | |||||
| 2025-08-14 | 13F | Jane Street Group, Llc | 49,166 | -37.90 | 2,823 | -31.41 | ||||
| 2025-08-08 | 13F | Gts Securities Llc | 14,057 | 134.09 | 807 | 158.65 | ||||
| 2025-08-14 | 13F | Royal Bank Of Canada | 110,557 | -7.05 | 6,348 | 2.65 | ||||
| 2025-08-07 | 13F | Rathbone Brothers plc | 14,600 | 0.00 | 838 | 10.41 | ||||
| 2025-07-10 | 13F | Global Financial Private Client, LLC | 0 | -100.00 | 0 | |||||
| 2025-08-13 | 13F | Jones Financial Companies Lllp | 30,707 | 126.32 | 1,760 | 147.05 | ||||
| 2025-07-29 | 13F | Foster & Motley Inc | 15,221 | -9.67 | 1 | |||||
| 2025-08-08 | 13F | Pnc Financial Services Group, Inc. | 465 | -47.46 | 27 | -43.48 | ||||
| 2025-08-11 | 13F | Citigroup Inc | 7,915 | -2.80 | 454 | 7.33 | ||||
| 2025-08-14 | 13F | Wells Fargo & Company/mn | 386,923 | -2.71 | 22,217 | 7.45 | ||||
| 2025-08-28 | NP | CMAIX - Invesco Conservative Allocation Fund CLASS R5 | 88,866 | 12.99 | 5,103 | 24.80 | ||||
| 2025-08-11 | 13F | Pin Oak Investment Advisors Inc | 204 | 0 | ||||||
| 2025-08-12 | 13F | CIBC Private Wealth Group, LLC | 130,455 | -6.25 | 7,491 | 16.47 | ||||
| 2025-08-04 | 13F | Mesirow Financial Investment Management, Inc. | 13,729 | -7.67 | 788 | 1.94 | ||||
| 2025-07-16 | 13F | Paragon Capital Management Ltd | 5,086 | 0.00 | 292 | 10.61 | ||||
| 2025-07-30 | 13F | Fairway Wealth LLC | 511 | -15.40 | 29 | -6.45 | ||||
| 2025-08-11 | 13F | Principal Securities, Inc. | 256 | -31.91 | 15 | -22.22 | ||||
| 2025-07-30 | 13F | Castle Wealth Management Llc | 4,831 | 0.00 | 277 | 10.36 | ||||
| 2025-07-24 | 13F | Stonebridge Financial Group, LLC | 0 | -100.00 | 0 | |||||
| 2025-08-28 | NP | AIM GROWTH SERIES (INVESCO GROWTH SERIES) - Invesco Oppenheimer Portfolio Series: Growth Investor Fund Class R6 | 607,809 | 4.39 | 34,900 | 15.30 | ||||
| 2025-08-12 | 13F | Global Retirement Partners, LLC | 112 | -27.74 | 6 | -14.29 | ||||
| 2025-07-21 | 13F | Fortis Capital Advisors, LLC | 20,000 | 0.00 | 1,148 | 10.49 | ||||
| 2025-08-14 | 13F | IHT Wealth Management, LLC | 20,070 | 8.70 | 1,152 | 20.13 | ||||
| 2025-08-14 | 13F | UBS Group AG | 147,075 | 17.72 | 8,445 | 30.02 | ||||
| 2025-08-15 | 13F | Equitable Holdings, Inc. | 291,794 | 61.17 | 16,755 | 78.01 | ||||
| 2025-07-08 | 13F | Arlington Trust Co LLC | 565 | 0.00 | 32 | 10.34 | ||||
| 2025-08-13 | 13F | Vertex Planning Partners, LLC | 6,280 | 6.51 | 361 | 17.65 | ||||
| 2025-08-14 | 13F | Goldman Sachs Group Inc | 0 | -100.00 | 0 | |||||
| 2025-08-27 | 13F/A | Brinker Capital Investments, LLC | 4,890 | -2.65 | 281 | 7.28 | ||||
| 2025-07-14 | 13F | Sentinel Pension Advisors Inc | 3,805 | 218 | ||||||
| 2025-07-15 | 13F | Colonial River Wealth Management, LLC | 9,976 | 51.40 | 579 | 69.01 | ||||
| 2025-08-12 | 13F | Proequities, Inc. | 0 | 0 | ||||||
| 2025-07-15 | 13F | Verum Partners LLC | 66,905 | 1.29 | 3,842 | 11.85 | ||||
| 2025-08-13 | 13F | Continuum Advisory, LLC | 0 | -100.00 | 0 | |||||
| 2025-08-14 | 13F | Vident Advisory, LLC | 3,897 | 0.00 | 224 | 10.40 | ||||
| 2025-05-13 | 13F | EverSource Wealth Advisors, LLC | 0 | -100.00 | 0 | |||||
| 2025-07-30 | 13F | Drive Wealth Management, Llc | 28,278 | 2.94 | 1,624 | 13.66 | ||||
| 2025-07-14 | 13F | Signature Securities Group Corporation | 21,291 | 1.84 | 1,223 | 12.52 | ||||
| 2025-08-06 | 13F | Modera Wealth Management, LLC | 4,753 | 0.00 | 273 | 10.12 | ||||
| 2025-08-28 | NP | AIM GROWTH SERIES (INVESCO GROWTH SERIES) - Invesco Oppenheimer Portfolio Series: Conservative Investor Fund Class R6 | 68,216 | 33.10 | 3,917 | 47.00 | ||||
| 2025-08-13 | 13F | Lido Advisors, LLC | 10,594 | -12.19 | 608 | -3.03 | ||||
| 2025-07-28 | 13F | Arlington Financial Advisors, LLC | 232,516 | 6.97 | 13,351 | 18.15 | ||||
| 2025-08-06 | 13F | Savant Capital, LLC | 16,400 | 5.01 | 942 | 16.03 | ||||
| 2025-07-24 | 13F | Robertson Stephens Wealth Management, LLC | 0 | -100.00 | 0 | |||||
| 2025-08-06 | 13F | Atlantic Union Bankshares Corp | 113 | 6 | ||||||
| 2025-07-25 | NP | USBSX - Cornerstone Moderate Fund | 322,043 | -4.13 | 18,146 | 4.85 | ||||
| 2025-07-29 | 13F | Private Trust Co Na | 700 | 0.00 | 40 | 11.11 | ||||
| 2025-05-14 | 13F | Venture Visionary Partners LLC | 0 | -100.00 | 0 | |||||
| 2025-07-16 | 13F | Kathmere Capital Management, LLC | 20,290 | -8.55 | 1,165 | 1.04 | ||||
| 2025-07-29 | 13F | Cidel Asset Management Inc | 31,072 | -0.14 | 1,784 | 10.33 | ||||
| 2025-08-13 | 13F | Flow Traders U.s. Llc | 0 | -100.00 | 0 | |||||
| 2025-07-15 | 13F | Mather Group, Llc. | 10,897 | -7.52 | 626 | 2.12 | ||||
| 2025-08-08 | 13F | Security Financial Services, INC. | 10,496 | 63.34 | 603 | 80.24 | ||||
| 2025-07-08 | 13F | Lowe Wealth Advisors, LLC | 19,174 | 8.43 | 1,101 | 19.70 | ||||
| 2025-08-08 | 13F | Crossmark Global Holdings, Inc. | 3,502 | 201 | ||||||
| 2025-08-27 | NP | ALAAX - INVESCO Income Allocation Fund Class A | 307,673 | -9.72 | 17,667 | -0.29 | ||||
| 2025-08-14 | 13F | Qube Research & Technologies Ltd | 3,015 | 728.30 | 173 | 861.11 | ||||
| 2025-05-15 | 13F/A | Orion Portfolio Solutions, LLC | 5,023 | -23.34 | 261 | -16.61 | ||||
| 2025-07-22 | 13F | Belpointe Asset Management LLC | 20,000 | 0.00 | 1,148 | 10.49 | ||||
| 2025-07-18 | 13F | Bartlett & Co. Wealth Management Llc | 165 | 0.00 | 9 | 12.50 | ||||
| 2025-07-07 | 13F | Centurion Wealth Management LLC | 56,530 | 55.61 | 3,246 | 86.60 | ||||
| 2025-07-14 | 13F | Farmers & Merchants Investments Inc | 0 | -100.00 | 0 | |||||
| 2025-07-24 | 13F | McKinley Carter Wealth Services, Inc. | 4,498 | 258 | ||||||
| 2025-08-14 | 13F | Raymond James Financial Inc | 10,535 | -9.53 | 605 | -0.17 | ||||
| 2025-07-31 | 13F | AlTi Global, Inc. | 0 | -100.00 | 0 | |||||
| 2025-08-04 | 13F | Assetmark, Inc | 1,229 | 71 | ||||||
| 2025-08-13 | 13F | Cresset Asset Management, LLC | 5,761 | 0.00 | 331 | 10.37 | ||||
| 2025-07-10 | 13F | Wealth Enhancement Advisory Services, Llc | 74,861 | 0.16 | 4,331 | 11.48 | ||||
| 2025-08-08 | 13F | Capital Investment Advisory Services, LLC | 368 | 0.00 | 21 | 10.53 | ||||
| 2025-08-01 | 13F | Chilton Capital Management Llc | 640 | 0.00 | 37 | 9.09 | ||||
| 2025-07-24 | 13F | Financial Connections Group, Inc. | 2,794 | 1.79 | 0 | |||||
| 2025-08-19 | 13F | Newbridge Financial Services Group, Inc. | 770 | 44 | ||||||
| 2025-05-12 | 13F | Sandy Spring Bank | 113 | -34.30 | 6 | -37.50 | ||||
| 2025-08-06 | 13F | Quadrant Private Wealth Management, LLC | 9,150 | 0.00 | 525 | 10.53 | ||||
| 2025-08-18 | 13F/A | National Bank Of Canada /fi/ | 82 | 0.00 | 5 | 0.00 | ||||
| 2025-08-07 | 13F | Proficio Capital Partners LLC | 1,768,322 | 1,858 | ||||||
| 2025-05-12 | 13F | Independent Advisor Alliance | 0 | -100.00 | 0 | |||||
| 2025-07-15 | 13F | RTD Financial Advisors, Inc. | 149,060 | -2.16 | 8,559 | 8.05 | ||||
| 2025-08-06 | 13F | Commonwealth Equity Services, Llc | 65,006 | -2.78 | 4 | 0.00 | ||||
| 2025-08-14 | 13F | Fmr Llc | 29,322 | 3.45 | 1,684 | 14.26 | ||||
| 2025-07-30 | 13F | Retirement Planning Group | 82,341 | -0.76 | 4,728 | 9.62 | ||||
| 2025-08-14 | 13F | Mml Investors Services, Llc | 21,117 | 2.90 | 1 | 0.00 | ||||
| 2025-08-14 | 13F | CoreCap Advisors, LLC | 4,283 | -1.02 | 246 | 9.38 | ||||
| 2025-08-12 | 13F | AlphaCore Capital LLC | 96,009 | 9,932.29 | 5,513 | 11,148.98 | ||||
| 2025-07-15 | 13F | MCF Advisors LLC | 675 | 0.00 | 39 | 8.57 | ||||
| 2025-07-17 | 13F | Johnson & White Wealth Management, LLC | 366,105 | 0.86 | 21 | 16.67 | ||||
| 2025-07-23 | 13F | Hardy Reed LLC | 10,346 | 0.00 | 594 | 10.61 | ||||
| 2025-07-08 | 13F | Parallel Advisors, LLC | 5,674 | 0.00 | 326 | 10.54 | ||||
| 2025-08-07 | 13F | Allworth Financial LP | 238 | 1.28 | 14 | 8.33 | ||||
| 2025-08-11 | 13F | Wealthspire Advisors, LLC | 38,439 | 0.00 | 2,207 | 10.46 | ||||
| 2025-08-08 | 13F | SBI Securities Co., Ltd. | 310 | 2.65 | 18 | 13.33 | ||||
| 2025-05-09 | 13F | Atria Wealth Solutions, Inc. | 0 | -100.00 | 0 | |||||
| 2025-07-16 | 13F | Maridea Wealth Management LLC | 4,712 | 271 | ||||||
| 2025-08-12 | 13F | Coldstream Capital Management Inc | 0 | -100.00 | 0 | |||||
| 2025-08-12 | 13F | Atlas Capital Advisors Llc | 23,628 | -0.56 | 1,357 | 9.80 | ||||
| 2025-07-16 | 13F | Signaturefd, Llc | 205 | 0.00 | 12 | 10.00 | ||||
| 2025-07-28 | 13F | Revolve Wealth Partners, LLC | 8,573 | 7.78 | 492 | 19.13 | ||||
| 2025-08-06 | 13F | AE Wealth Management LLC | 3,456 | 6.18 | 198 | 17.16 | ||||
| 2025-08-14 | 13F | GWM Advisors LLC | 502 | -79.02 | 29 | -77.42 | ||||
| 2025-08-05 | 13F | Bank of New York Mellon Corp | 845,228 | -3.08 | 48,533 | 7.04 | ||||
| 2025-08-06 | 13F | Atlas Legacy Advisors, LLC | 11,184 | 93.63 | 642 | 111.88 | ||||
| 2025-08-13 | 13F | Scotia Capital Inc. | 10,555 | 5.70 | 606 | 16.76 | ||||
| 2025-08-05 | 13F | Carolinas Wealth Consulting Llc | 0 | -100.00 | 0 | -100.00 | ||||
| 2025-08-14 | 13F | Snowden Capital Advisors LLC | 10,815 | -0.52 | 621 | 9.91 | ||||
| 2025-08-14 | 13F | Citadel Advisors Llc | 125,291 | 7,194 | ||||||
| 2025-08-12 | 13F | Steward Partners Investment Advisory, Llc | 83 | -80.96 | 5 | -81.82 | ||||
| 2025-07-15 | 13F | Foster Victor Wealth Advisors, LLC | 66,378 | -3.83 | 3,848 | 11.51 | ||||
| 2025-08-28 | NP | AADAX - INVESCO Growth Allocation Fund Class A | 624,071 | 5.04 | 35,834 | 16.02 | ||||
| 2025-08-12 | 13F | Financial Advocates Investment Management | 3,490 | -16.29 | 200 | -7.41 | ||||
| 2025-07-15 | 13F | Fifth Third Bancorp | 314 | -25.24 | 18 | -14.29 | ||||
| 2025-08-14 | 13F | Toronto Dominion Bank | 22 | -78.00 | 1 | -80.00 | ||||
| 2025-08-14 | 13F | EP Wealth Advisors, Inc. | 14,070 | -0.34 | 808 | 9.95 | ||||
| 2025-08-12 | 13F | MAI Capital Management | 8,041 | 0.00 | 462 | 10.29 | ||||
| 2025-08-13 | 13F | Northwestern Mutual Wealth Management Co | 146,563 | -4.16 | 8,416 | 5.85 | ||||
| 2025-08-14 | 13F | Colony Group, LLC | 9,633 | 553 | ||||||
| 2025-08-15 | 13F | Kestra Advisory Services, LLC | 9,160 | -0.52 | 526 | 9.83 | ||||
| 2025-08-04 | 13F | Spire Wealth Management | 11,711 | 381.74 | 245 | 94.44 | ||||
| 2025-08-14 | 13F | Bank Of America Corp /de/ | 883,792 | -3.73 | 50,747 | 6.33 | ||||
| 2025-08-14 | 13F | Mercer Global Advisors Inc /adv | 27,953 | 4.41 | 1,605 | 15.38 | ||||
| 2025-08-14 | 13F | Stifel Financial Corp | 44,741 | -3.83 | 2,569 | 6.24 | ||||
| 2025-07-25 | 13F | Sequoia Financial Advisors, LLC | 7,314 | 0.22 | 420 | 10.55 | ||||
| 2025-07-16 | 13F | Essex Financial Services, Inc. | 6,365 | 0.02 | 365 | 10.61 | ||||
| 2025-08-12 | 13F | Belmont Capital, LLC | 361 | 0.00 | 21 | 11.11 | ||||
| 2025-08-01 | 13F | Cedar Point Capital Partners, LLC | 36,006 | 4.71 | 2,067 | 15.67 | ||||
| 2025-08-14 | 13F | Mariner, LLC | 36,749 | 8.75 | 2,110 | 20.16 | ||||
| 2025-08-12 | 13F | LPL Financial LLC | 648,408 | 26.78 | 37,232 | 40.02 | ||||
| 2025-07-30 | 13F | Atlantic Edge Private Wealth Management, LLC | 105 | 0.00 | 6 | 20.00 | ||||
| 2025-08-14 | 13F | Ameriprise Financial Inc | 47,979 | -22.37 | 2,755 | -14.34 | ||||
| 2025-08-19 | 13F | Advisory Services Network, LLC | 7,804 | 447 | ||||||
| 2025-08-12 | 13F | Bokf, Na | 0 | -100.00 | 0 | |||||
| 2025-09-04 | 13F/A | Advisor Group Holdings, Inc. | 91,099 | 17.27 | 5,231 | 29.54 | ||||
| 2025-07-30 | 13F | Avidian Wealth Solutions, LLC | 5,694 | 327 | ||||||
| 2025-08-15 | 13F | Captrust Financial Advisors | 130,257 | 1.34 | 7,479 | 11.93 | ||||
| 2025-08-08 | 13F | Larson Financial Group LLC | 7,368 | 39.73 | 423 | 54.38 | ||||
| 2025-07-29 | 13F | Activest Wealth Management | 0 | 0 | ||||||
| 2025-07-25 | NP | UCAGX - Cornerstone Aggressive Fund | 43,991 | 0.00 | 2,479 | 9.36 | ||||
| 2025-08-14 | 13F | Greenline Partners, LLC | 0 | -100.00 | 0 | |||||
| 2025-07-24 | 13F | PDS Planning, Inc | 11,324 | 0.00 | 650 | 10.54 | ||||
| 2025-08-05 | 13F | Key FInancial Inc | 15,022 | 0.54 | 863 | 11.08 | ||||
| 2025-08-05 | 13F | Bank Of Montreal /can/ | 3,549 | 13.21 | 204 | 25.31 | ||||
| 2025-07-22 | 13F | Three Bridge Wealth Advisors, LLC | 62,360 | 158.32 | 3,581 | 185.26 | ||||
| 2025-08-14 | 13F | Susquehanna International Group, Llp | 4,516 | -93.81 | 259 | -93.17 | ||||
| 2025-04-29 | 13F | Callan Capital, LLC | 105,664 | -2.93 | 5,493 | 5.37 | ||||
| 2025-03-28 | 13F/A | Berkeley, Inc | 0 | -100.00 | 0 | -100.00 | ||||
| 2025-07-24 | 13F | Riverchase Wealth Management, Llc | 25,378 | 0.00 | 1,457 | 10.46 | ||||
| 2025-07-28 | 13F | Axxcess Wealth Management, Llc | 9,485 | 46.10 | 545 | 61.42 | ||||
| 2025-08-14 | 13F | CIBC World Markets Inc. | 5,330 | -3.62 | 306 | 6.62 | ||||
| 2025-08-15 | 13F | Tower Research Capital LLC (TRC) | 4 | -20.00 | 0 | |||||
| 2025-08-13 | 13F | Invesco Ltd. | 4,588,907 | 2.93 | 263,495 | 13.68 | ||||
| 2025-08-12 | 13F | O'shaughnessy Asset Management, Llc | 9,130 | -13.80 | 524 | -4.73 | ||||
| 2025-05-14 | 13F | Brown Brothers Harriman & Co | 0 | -100.00 | 0 | |||||
| 2025-08-06 | 13F | Maltin Wealth Management, Inc. | 85,820 | 4,928 | ||||||
| 2025-08-08 | 13F | Austin Wealth Management, LLC | 3,869 | 0.00 | 222 | 7.80 | ||||
| 2025-08-11 | 13F | HighTower Advisors, LLC | 84,261 | -5.90 | 4,838 | 3.93 | ||||
| 2025-08-08 | 13F | Cetera Investment Advisers | 171,590 | 2.65 | 9,853 | 13.37 | ||||
| 2025-07-25 | NP | USCRX - Cornerstone Moderately Aggressive Fund | 653,206 | 0.00 | 36,805 | 9.36 | ||||
| 2025-05-06 | 13F | Kathleen S. Wright Associates Inc. | 0 | -100.00 | 0 | |||||
| 2025-08-12 | 13F | Charles Schwab Investment Management Inc | 11,861,260 | 1.38 | 681,074 | 11.97 | ||||
| 2025-08-13 | 13F | Victory Capital Management Inc | 979,947 | -8.27 | 56,269 | 1.31 | ||||
| 2025-08-08 | 13F | WASHINGTON TRUST Co | 0 | -100.00 | 0 | |||||
| 2025-07-25 | NP | UCMCX - Cornerstone Moderately Conservative Fund | 35,176 | 0.00 | 1,982 | 9.33 | ||||
| 2025-08-07 | 13F | Rollins Financial Advisors, LLC | 3,837 | 220 | ||||||
| 2025-08-11 | 13F | Vanguard Group Inc | 16,062 | 1.81 | 922 | 12.44 | ||||
| 2025-08-14 | 13F | Glenmede Investment Management, LP | 65,345 | 3,752 | ||||||
| 2025-07-07 | 13F | Versant Capital Management, Inc | 1,294 | 161.94 | 74 | 196.00 | ||||
| 2025-08-05 | 13F | Huntington National Bank | 88 | 11.39 | ||||||
| 2025-07-30 | 13F | Crewe Advisors LLC | 1,841 | 10.31 | 106 | 22.09 | ||||
| 2025-07-16 | 13F | Prairiewood Capital, LLC | 12,206 | -9.79 | 701 | -0.43 | ||||
| 2025-07-22 | 13F | Red Tortoise LLC | 39,595 | 0.80 | 2,274 | 11.31 | ||||
| 2025-08-05 | 13F | Tiaa Trust, National Association | 4,215 | 0.00 | 242 | 10.05 | ||||
| 2025-07-09 | 13F | Breakwater Capital Group | 76,931 | 0.87 | 4,417 | 11.40 | ||||
| 2025-07-24 | 13F | Us Bancorp \de\ | 63,489 | -4.64 | 3,646 | 5.32 | ||||
| 2025-07-31 | 13F | Harbour Investment Management Llc | 7,887 | 0.00 | 453 | 10.24 | ||||
| 2025-08-18 | 13F | Geneos Wealth Management Inc. | 6,314 | -15.00 | 363 | -6.22 |