Mga Batayang Estadistika
| Pemilik Institusional | 210 total, 203 long only, 0 short only, 7 long/short - change of 11.11% MRQ |
| Alokasi Portofolio Rata-rata | 0.1079 % - change of 21.77% MRQ |
| Saham Institusional (Jangka Panjang) | 10,543,129 (ex 13D/G) - change of 2.38MM shares 29.10% MRQ |
| Nilai Institusional (Jangka Panjang) | $ 496,492 USD ($1000) |
Kepemilikan Institusional dan Pemegang Saham
Global X Funds - Global X Silver Miners ETF (US:SIL) memiliki 210 pemilik institusional dan pemegang saham yang telah mengajukan formulir 13D/G atau 13F kepada Komisi Bursa Efek (Securities Exchange Commission/SEC). Lembaga-lembaga ini memegang total 10,543,129 saham. Pemegang saham terbesar meliputi Morgan Stanley, Two Sigma Investments, Lp, LPL Financial LLC, Susquehanna International Group, Llp, D. E. Shaw & Co., Inc., Meitav Dash Investments Ltd, Jane Street Group, Llc, UBS Group AG, Wells Fargo & Company/mn, and PCG Wealth Advisors, LLC .
Struktur kepemilikan institusional Global X Funds - Global X Silver Miners ETF (ARCA:SIL) menunjukkan posisi terkini di perusahaan oleh institusi dan dana, serta perubahan terbaru dalam ukuran posisi. Pemegang saham utama dapat mencakup investor individu, reksa dana, dana lindung nilai, atau institusi. Jadwal 13D menunjukkan bahwa investor memegang (atau pernah memegang) lebih dari 5% saham perusahaan dan bermaksud (atau pernah bermaksud) untuk secara aktif mengejar perubahan strategi bisnis. Jadwal 13G menunjukkan investasi pasif lebih dari 5%.
The share price as of September 5, 2025 is 61.49 / share. Previously, on September 9, 2024, the share price was 30.36 / share. This represents an increase of 102.54% over that period.

Skor Sentimen Dana
Skor Sentimen Dana (sebelumnya dikenal sebagai Skor Akumulasi Kepemilikan) menemukan saham-saham yang paling banyak dibeli oleh dana. Ini adalah hasil dari model kuantitatif multi-faktor yang canggih yang mengidentifikasi perusahaan dengan tingkat akumulasi institusional tertinggi. Model penilaian menggunakan kombinasi dari total peningkatan pemilik yang diungkapkan, perubahan dalam alokasi portofolio pada pemilik tersebut, dan metrik lainnya. Angka berkisar dari 0 hingga 100, dengan angka yang lebih tinggi menunjukkan tingkat akumulasi yang lebih tinggi dibandingkan dengan perusahaan sejenisnya, dan 50 adalah rata-ratanya.
Frekuensi Pembaruan: Setiap Hari
Lihat Ownership Explorer, yang menyediakan daftar perusahaan dengan peringkat tertinggi.
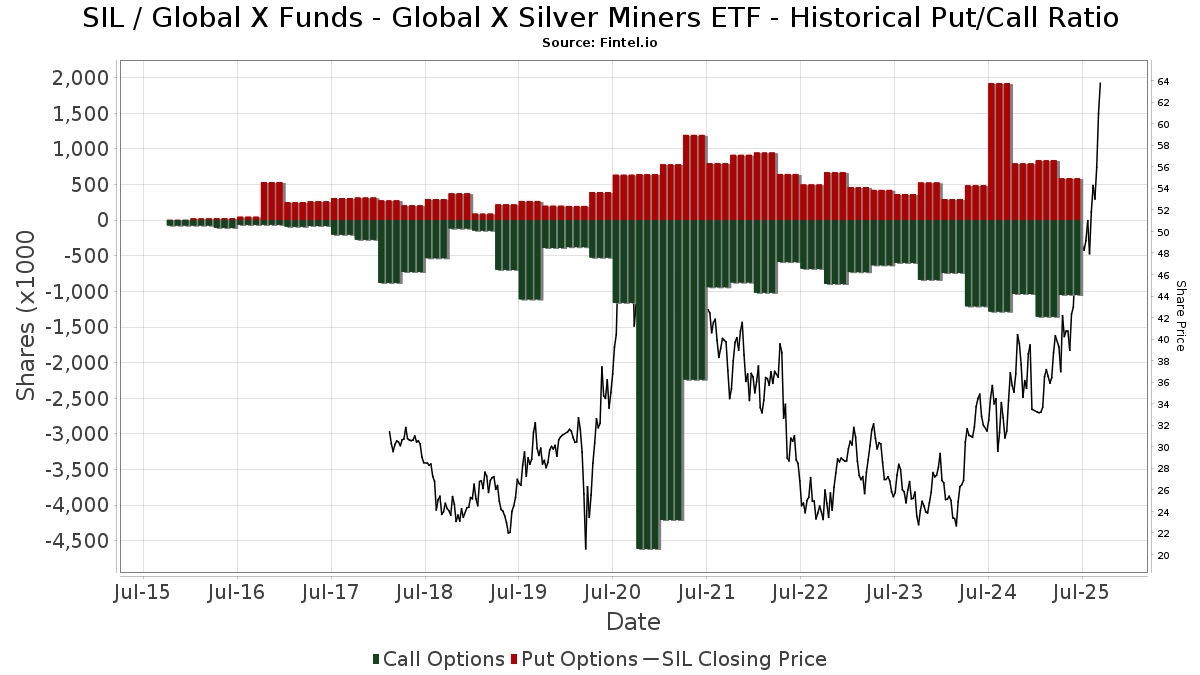
Rasio Put/Call Institusional
Selain melaporkan isu ekuitas dan utang standar, institusi dengan aset di bawah manajemen lebih dari 100 juta dolar AS juga harus mengungkapkan kepemilikan opsi put dan call mereka. Karena opsi put umumnya menunjukkan sentimen negatif, dan opsi call menunjukkan sentimen positif, kita dapat mengetahui sentimen institusional secara keseluruhan dengan memplot rasio put terhadap call. Grafik di sebelah kanan memplot rasio put/call historis untuk instrumen ini.
Menggunakan Rasio Put/Call sebagai indikator sentimen investor mengatasi salah satu kekurangan utama dari penggunaan total kepemilikan institusional, yaitu sejumlah besar aset yang dikelola diinvestasikan secara pasif untuk melacak indeks. Dana yang dikelola secara pasif biasanya tidak membeli opsi, sehingga indikator rasio put/call lebih akurat dalam melacak sentimen dana yang dikelola secara aktif.
Pengajuan 13F dan NPORT
Detail pada pengajuan 13F tersedia gratis. Detail pada pengajuan NP memerlukan keanggotaan premium. Baris berwarna hijau menunjukkan posisi baru. Baris berwarna merah menunjukkan posisi yang sudah ditutup. Klik tautan ini ikon untuk melihat riwayat transaksi selengkapnya.
Tingkatkan
untuk membuka data premium dan mengekspor ke Excel ![]() .
.
| Tanggal File | Sumber | Investor | Ketik | Presyo ng Avg (Silangan) |
Saham | Δ Saham (%) |
Dilaporkan Nilai ($1000) |
Nilai Δ (%) |
Alokasi Port (%) |
|
|---|---|---|---|---|---|---|---|---|---|---|
| 2025-08-04 | 13F | Spire Wealth Management | 534 | -35.97 | 26 | -21.87 | ||||
| 2025-08-12 | 13F | Jpmorgan Chase & Co | 802 | 0.00 | 39 | 22.58 | ||||
| 2025-08-14 | 13F | Millennium Management Llc | 8,661 | -4.00 | 417 | 17.18 | ||||
| 2025-08-13 | 13F | BCJ Capital Management, LLC | 13,606 | 11.76 | 655 | 36.25 | ||||
| 2025-07-22 | 13F | Chung Wu Investment Group, LLC | 10,400 | 501 | ||||||
| 2025-07-31 | 13F | Cambridge Investment Research Advisors, Inc. | 33,330 | 18.12 | 2 | 0.00 | ||||
| 2025-08-11 | 13F | Private Advisor Group, LLC | 28,994 | 44.68 | 1,396 | 76.58 | ||||
| 2025-08-12 | 13F | Picton Mahoney Asset Management | 3,400 | 36.00 | 0 | |||||
| 2025-08-12 | 13F | Atlas Capital Advisors Llc | 1,856 | 0.00 | 89 | 21.92 | ||||
| 2025-04-30 | 13F | Sofos Investments, Inc. | 98 | 4 | ||||||
| 2025-07-17 | 13F | LexAurum Advisors, LLC | 5,140 | 0.00 | 247 | 22.28 | ||||
| 2025-08-14 | 13F | Capitolis Liquid Global Markets LLC | 0 | -100.00 | 0 | |||||
| 2025-08-11 | 13F | Tidemark, LLC | 1,365 | 0.00 | 66 | 22.64 | ||||
| 2025-08-14 | 13F | Two Sigma Investments, Lp | 903,600 | 2,697.52 | 43,499 | 3,314.36 | ||||
| 2025-08-19 | 13F | Anchor Investment Management, LLC | 0 | -100.00 | 0 | |||||
| 2025-08-14 | 13F | Qube Research & Technologies Ltd | 99,770 | 91.61 | 4,803 | 133.79 | ||||
| 2025-08-13 | 13F | Capital Fund Management S.a. | 32,498 | 1,564 | ||||||
| 2025-05-15 | 13F | Hrt Financial Lp | 0 | -100.00 | 0 | |||||
| 2025-08-12 | 13F | Founders Financial Alliance, LLC | 326 | 16 | ||||||
| 2025-08-06 | 13F | Atlantic Union Bankshares Corp | 60 | 3 | ||||||
| 2025-08-18 | 13F/A | National Bank Of Canada /fi/ | 38,383 | 659.01 | 1,849 | 828.64 | ||||
| 2025-07-31 | 13F | Wealthfront Advisers Llc | 9,058 | -36.54 | 436 | -22.56 | ||||
| 2025-08-06 | 13F | Legacy Wealth Managment, LLC/ID | 337 | 4.66 | 16 | 33.33 | ||||
| 2025-07-25 | 13F | LRI Investments, LLC | 850 | 0.00 | 41 | 21.21 | ||||
| 2025-07-25 | 13F | M.e. Allison & Co., Inc. | 6,000 | 0.00 | 289 | 22.03 | ||||
| 2025-07-15 | 13F | Financial Management Professionals, Inc. | 188 | -63.71 | 9 | -55.00 | ||||
| 2025-08-14 | 13F | Mml Investors Services, Llc | 11,064 | -32.47 | 1 | |||||
| 2025-07-29 | 13F | Stephens Inc /ar/ | 6,347 | -21.73 | 306 | -4.39 | ||||
| 2025-07-18 | 13F | PFG Investments, LLC | 11,379 | 0.00 | 548 | 22.10 | ||||
| 2025-07-23 | 13F | Meitav Dash Investments Ltd | 650,000 | 0.00 | 31,349 | 22.32 | ||||
| 2025-08-14 | 13F | Citadel Advisors Llc | 152,246 | -31.81 | 7,329 | -16.78 | ||||
| 2025-08-14 | 13F | Citadel Advisors Llc | Put | 162,900 | -30.68 | 7,842 | -15.40 | |||
| 2025-08-14 | 13F | Caption Management, LLC | Call | 0 | -100.00 | 0 | ||||
| 2025-08-14 | 13F | Citadel Advisors Llc | Call | 94,500 | 110.47 | 4,549 | 156.86 | |||
| 2025-07-21 | 13F | Ameriflex Group, Inc. | 269 | -10.93 | 13 | 18.18 | ||||
| 2025-08-07 | 13F | Resources Investment Advisors, LLC. | 15,815 | -6.29 | 761 | 14.44 | ||||
| 2025-08-11 | 13F | Covestor Ltd | 399 | 32.56 | 0 | |||||
| 2025-08-12 | 13F | Park Square Financial Group, LLC | 42 | 147.06 | 2 | |||||
| 2025-08-14 | 13F | Main Street Financial Solutions, LLC | 18,350 | -2.39 | 883 | 19.16 | ||||
| 2025-07-16 | 13F | ORG Partners LLC | 55 | -38.20 | 3 | -33.33 | ||||
| 2025-08-12 | 13F | Proequities, Inc. | 0 | 0 | ||||||
| 2025-08-13 | 13F | Safe Harbor Fiduciary, LLC | 175 | 0.00 | 8 | 33.33 | ||||
| 2025-08-14 | 13F | LMR Partners LLP | 0 | -100.00 | 0 | |||||
| 2025-07-17 | 13F | Sound Income Strategies, LLC | 44 | 0.00 | 2 | 100.00 | ||||
| 2025-08-07 | 13F | Rathbone Brothers plc | 6,655 | 0.00 | 320 | 22.14 | ||||
| 2025-07-28 | 13F | RFG Advisory, LLC | 10,242 | 3.06 | 493 | 25.77 | ||||
| 2025-08-14 | 13F | LaSalle St. Investment Advisors, LLC | 4,835 | 0 | ||||||
| 2025-08-14 | 13F | Arete Wealth Advisors, LLC | 7,337 | 0.00 | 0 | |||||
| 2025-07-25 | 13F | Atria Wealth Solutions, Inc. | 0 | -100.00 | 0 | |||||
| 2025-08-08 | 13F | Cetera Investment Advisers | 213,696 | 12.80 | 10,287 | 37.66 | ||||
| 2025-08-14 | 13F | Cantor Fitzgerald, L. P. | 0 | -100.00 | 0 | |||||
| 2025-08-27 | 13F/A | Squarepoint Ops LLC | Call | 0 | -100.00 | 0 | -100.00 | |||
| 2025-08-14 | 13F | Ancora Advisors, LLC | 1,029 | 10.76 | 50 | 36.11 | ||||
| 2025-08-15 | 13F | Morgan Stanley | 1,221,760 | 21.31 | 58,816 | 48.03 | ||||
| 2025-08-13 | 13F | VestGen Advisors, LLC | 4,179 | 201 | ||||||
| 2025-08-14 | 13F | Sunbelt Securities, Inc. | 6,211 | -3.16 | 197 | -22.13 | ||||
| 2025-07-18 | 13F | Founders Capital Management | 300 | 0.00 | 14 | 27.27 | ||||
| 2025-07-16 | 13F | Signaturefd, Llc | 6,836 | 0.00 | 329 | 22.30 | ||||
| 2025-05-15 | 13F | Barclays Plc | 0 | -100.00 | 0 | |||||
| 2025-04-23 | 13F | Oppenheimer & Co Inc | 0 | -100.00 | 0 | -100.00 | ||||
| 2025-07-14 | 13F | UMA Financial Services, Inc. | 8,700 | 0.00 | 419 | 21.87 | ||||
| 2025-08-14 | 13F | Old Mission Capital Llc | 33,745 | 1,624 | ||||||
| 2025-08-04 | 13F | Kovack Advisors, Inc. | 24,741 | 1,191 | ||||||
| 2025-07-24 | 13F | IFP Advisors, Inc | 234 | 0.00 | 11 | 22.22 | ||||
| 2025-08-05 | 13F | Tsfg, Llc | 409 | 0.00 | 0 | |||||
| 2025-08-14 | 13F | Financial Advisory Service, Inc. | 13 | 1 | ||||||
| 2025-08-13 | 13F | Baird Financial Group, Inc. | 170,802 | 39.21 | 8,222 | 69.88 | ||||
| 2025-07-08 | 13F | Parallel Advisors, LLC | 1,000 | 0.00 | 48 | 23.08 | ||||
| 2025-08-04 | 13F | Assetmark, Inc | 187 | 367.50 | 9 | 800.00 | ||||
| 2025-08-06 | 13F | AE Wealth Management LLC | 995 | 26.91 | 48 | 56.67 | ||||
| 2025-08-08 | 13F | Financial Gravity Companies, Inc. | 0 | -100.00 | 0 | |||||
| 2025-08-14 | 13F | GeoSphere Capital Management | 25,000 | 1,204 | ||||||
| 2025-08-14 | 13F | Wealth Preservation Advisors, LLC | 300 | 0.00 | 14 | 27.27 | ||||
| 2025-08-14 | 13F | D. E. Shaw & Co., Inc. | 650,237 | 1,084.23 | 31,302 | 1,345.15 | ||||
| 2025-08-13 | 13F | Renaissance Technologies Llc | 36,700 | 1,767 | ||||||
| 2025-04-14 | 13F | Clean Yield Group | 0 | -100.00 | 0 | |||||
| 2025-08-13 | 13F | Diametric Capital, LP | 10,454 | -4.60 | 503 | 16.44 | ||||
| 2025-09-04 | 13F/A | Advisor Group Holdings, Inc. | 82,485 | 123.82 | 3,850 | 164.72 | ||||
| 2025-07-15 | 13F | Wynnefield Capital Inc | 50,000 | 0.00 | 2,407 | 22.06 | ||||
| 2025-08-05 | 13F | Dunhill Financial, LLC | 500 | 0.00 | 24 | 26.32 | ||||
| 2025-08-13 | 13F | Northwestern Mutual Wealth Management Co | 65,960 | 4,486.93 | 3,175 | 5,569.64 | ||||
| 2025-08-08 | 13F | SBI Securities Co., Ltd. | 891 | 31.42 | 43 | 61.54 | ||||
| 2025-04-22 | 13F/A | NorthRock Partners, LLC | 0 | -100.00 | 0 | |||||
| 2025-07-21 | 13F | Matauro, Llc | 8,176 | 394 | ||||||
| 2025-08-14 | 13F | Clark Capital Management Group, Inc. | 88,268 | -35.17 | 4,249 | -20.89 | ||||
| 2025-08-08 | 13F | Capital Investment Advisory Services, LLC | 2,500 | 0.00 | 120 | 22.45 | ||||
| 2025-05-15 | 13F | Marshall Wace, Llp | 0 | -100.00 | 0 | |||||
| 2025-07-25 | 13F | We Are One Seven, LLC | 5,020 | 242 | ||||||
| 2025-05-12 | 13F | Fiduciary Family Office, Llc | 0 | -100.00 | 0 | |||||
| 2025-07-31 | 13F | City State Bank | 570 | 0.00 | 27 | 22.73 | ||||
| 2025-07-11 | 13F | Farther Finance Advisors, LLC | 3,700 | 335.29 | 178 | 439.39 | ||||
| 2025-07-28 | 13F | Harbour Investments, Inc. | 8,108 | 9.88 | 390 | 34.02 | ||||
| 2025-05-16 | 13F | Jones Financial Companies Lllp | 0 | -100.00 | 0 | |||||
| 2025-07-14 | 13F | Park Avenue Securities Llc | 8,535 | -17.06 | 0 | |||||
| 2025-08-13 | 13F | Mount Yale Investment Advisors, LLC | 49,318 | 3.54 | 2,374 | 26.34 | ||||
| 2025-08-01 | 13F | Belvedere Trading LLC | Call | 400 | -97.33 | 19 | -96.79 | |||
| 2025-08-06 | 13F | Pekin Hardy Strauss, Inc. | 43,663 | -0.76 | 2,102 | 21.10 | ||||
| 2025-07-28 | 13F | Pettinga Financial Advisors, LLC | 8,612 | -22.50 | 415 | -5.48 | ||||
| 2025-08-01 | 13F | Belvedere Trading LLC | Put | 5,100 | 2.00 | 246 | 24.37 | |||
| 2025-08-14 | 13F | Shay Capital LLC | Call | 42,500 | 2,046 | |||||
| 2025-08-14 | 13F | Comerica Bank | 5,279 | 54.85 | 254 | 89.55 | ||||
| 2025-07-08 | 13F | Arlington Trust Co LLC | 3,238 | 0.00 | 156 | 22.05 | ||||
| 2025-08-14 | 13F | CIBC World Markets Inc. | 39,566 | -3.95 | 1,905 | 17.17 | ||||
| 2025-08-11 | 13F | HighTower Advisors, LLC | 30,146 | 22.06 | 1,451 | 48.97 | ||||
| 2025-08-12 | 13F | MAI Capital Management | 3,404 | 0.00 | 164 | 21.64 | ||||
| 2025-07-08 | 13F | Ballew Advisors, Inc | 70,741 | -6.80 | 3,473 | 13.76 | ||||
| 2025-08-05 | 13F | Bank Of Montreal /can/ | 5,781 | 11.69 | 278 | 36.27 | ||||
| 2025-08-11 | 13F | Sprott Inc. | 74,671 | -3.71 | 3,595 | 17.49 | ||||
| 2025-08-13 | 13F | New Harbor Financial Group, LLC | 21,480 | -11.28 | 1,034 | 8.27 | ||||
| 2025-08-13 | 13F | Scotia Capital Inc. | 66,662 | 321.24 | 3,209 | 414.26 | ||||
| 2025-08-07 | 13F | Evoke Wealth, Llc | 30,496 | 24.67 | 1,470 | 52.33 | ||||
| 2025-08-14 | 13F | Raymond James Financial Inc | 82,030 | 21.79 | 3,949 | 48.59 | ||||
| 2025-08-14 | 13F | Ameriprise Financial Inc | 255,277 | 100.73 | 12,476 | 148.70 | ||||
| 2025-07-21 | 13F | Portfolio Strategies, Inc. | 10,812 | 9.91 | 520 | 34.02 | ||||
| 2025-05-15 | 13F | Grayhawk Investment Strategies Inc. | 90 | 0.00 | 4 | 50.00 | ||||
| 2025-05-12 | 13F | RIA Advisory Group LLC | 0 | -100.00 | 0 | |||||
| 2025-08-11 | 13F | Citigroup Inc | 181,281 | 15.97 | 8,727 | 41.52 | ||||
| 2025-05-15 | 13F | Cubist Systematic Strategies, LLC | 0 | -100.00 | 0 | -100.00 | ||||
| 2025-08-18 | 13F | Geneos Wealth Management Inc. | 23,305 | -0.64 | 1,122 | 21.19 | ||||
| 2025-08-08 | NP | QALTX - Quantified Alternative Investment Fund Investor Class Shares | 235 | -15.77 | 11 | 0.00 | ||||
| 2025-07-28 | 13F | Copia Wealth Management | 2,140 | 39.96 | 103 | 71.67 | ||||
| 2025-08-29 | 13F | Total Investment Management Inc | 3,489 | 168 | ||||||
| 2025-07-01 | 13F | Harbor Investment Advisory, Llc | 17,027 | -0.33 | 820 | 21.69 | ||||
| 2025-08-14 | 13F | IHT Wealth Management, LLC | 25,563 | 3.38 | 1,231 | 26.15 | ||||
| 2025-04-14 | 13F | IMC-Chicago, LLC | 0 | -100.00 | 0 | |||||
| 2025-07-23 | 13F | Columbus Macro, LLC | 12,454 | 0.59 | 600 | 22.75 | ||||
| 2025-07-24 | 13F | Cyndeo Wealth Partners, LLC | 6,546 | 0.00 | 315 | 22.09 | ||||
| 2025-08-07 | 13F | Encompass More Asset Management | 26,943 | 1,297 | ||||||
| 2025-07-25 | 13F | Concord Wealth Partners | 358 | 0.00 | 17 | 21.43 | ||||
| 2025-05-14 | 13F | Oarsman Capital, Inc. | 0 | -100.00 | 0 | |||||
| 2025-07-15 | 13F | Well Done, LLC | 0 | -100.00 | 0 | |||||
| 2025-08-14 | 13F | Wells Fargo & Company/mn | 317,173 | 2.41 | 15,269 | 24.96 | ||||
| 2025-08-13 | 13F | SCP Investment, LP | 8,800 | 424 | ||||||
| 2025-05-12 | 13F | Virtu Financial LLC | 0 | -100.00 | 0 | |||||
| 2025-05-09 | 13F | Belvedere Trading LLC | 0 | -100.00 | 0 | -100.00 | ||||
| 2025-08-25 | 13F/A | Neuberger Berman Group LLC | 7,370 | 0.00 | 355 | 22.07 | ||||
| 2025-08-14 | 13F | Group One Trading, L.p. | 150,567 | 29.27 | 7,248 | 57.77 | ||||
| 2025-07-30 | 13F | FNY Investment Advisers, LLC | 4,011 | 52.92 | 0 | |||||
| 2025-08-04 | 13F | Bay Colony Advisory Group, Inc d/b/a Bay Colony Advisors | 7,149 | 344 | ||||||
| 2025-08-14 | 13F | Van Den Berg Management I, Inc | 50 | 2 | ||||||
| 2025-05-15 | 13F | LMR Partners LLP | Put | 0 | -100.00 | 0 | -100.00 | |||
| 2025-08-12 | 13F | O'shaughnessy Asset Management, Llc | 71 | 0.00 | 3 | 50.00 | ||||
| 2025-08-05 | 13F | GPS Wealth Strategies Group, LLC | 105 | 0.00 | 5 | 25.00 | ||||
| 2025-08-12 | 13F | Financial Advocates Investment Management | 0 | -100.00 | 0 | |||||
| 2025-08-14 | 13F | Fiduciary Trust Co | 10,270 | -0.87 | 494 | 21.08 | ||||
| 2025-08-13 | 13F | Walleye Capital LLC | 0 | -100.00 | 0 | |||||
| 2025-08-01 | 13F | Y-Intercept (Hong Kong) Ltd | 19,289 | 929 | ||||||
| 2025-07-25 | 13F | SPC Financial, Inc. | 20,379 | 5.77 | 981 | 29.08 | ||||
| 2025-07-24 | 13F | Ronald Blue Trust, Inc. | 3,414 | -0.06 | 164 | 22.39 | ||||
| 2025-08-14 | 13F | UBS Group AG | 367,242 | -27.06 | 17,679 | -11.00 | ||||
| 2025-08-14 | 13F | Bank Of America Corp /de/ | 80,332 | 2.60 | 3,867 | 25.23 | ||||
| 2025-08-14 | 13F | UBS Group AG | Call | 97,890 | -71.66 | 4,712 | -65.41 | |||
| 2025-05-13 | 13F | Franklin Resources Inc | 0 | -100.00 | 0 | -100.00 | ||||
| 2025-08-08 | 13F | Kingsview Wealth Management, LLC | 0 | -100.00 | 0 | |||||
| 2025-08-13 | 13F | Walleye Trading LLC | Call | 2,200 | -21.43 | 106 | -4.55 | |||
| 2025-08-13 | 13F | Capula Management Ltd | 20,000 | -63.30 | 963 | -55.23 | ||||
| 2025-08-13 | 13F | Walleye Trading LLC | 7,110 | 211.84 | 342 | 284.27 | ||||
| 2025-08-06 | 13F | Legacy Investment Solutions, LLC | 337 | 4.66 | 16 | 45.45 | ||||
| 2025-07-08 | 13F | Juncture Wealth Strategies, Llc | 25,266 | 5.22 | 1,216 | 28.41 | ||||
| 2025-07-23 | 13F | Vontobel Holding Ltd. | 42,100 | 0.00 | 2,027 | 22.05 | ||||
| 2025-07-25 | 13F | Sequoia Financial Advisors, LLC | 6,134 | 6.68 | 295 | 30.53 | ||||
| 2025-08-13 | 13F | Walleye Trading LLC | Put | 7,400 | 356 | |||||
| 2025-07-24 | 13F | Baldwin Brothers Inc/ma | 7,350 | 22.50 | 354 | 49.58 | ||||
| 2025-08-07 | 13F | Kestra Private Wealth Services, Llc | 10,991 | 25.80 | 529 | 53.78 | ||||
| 2025-07-15 | 13F | Jeppson Wealth Management, Llc | 6,728 | -0.74 | 324 | 20.97 | ||||
| 2025-08-12 | 13F | AlphaCore Capital LLC | 476 | 23 | ||||||
| 2025-08-05 | 13F | Sigma Planning Corp | 12,262 | -8.83 | 590 | 11.32 | ||||
| 2025-08-01 | 13F | Vision Financial Markets Llc | 50 | 0.00 | 2 | 100.00 | ||||
| 2025-08-14 | 13F | Barometer Capital Management Inc. | 9,200 | -26.98 | 443 | -11.07 | ||||
| 2025-08-14 | 13F | Jane Street Group, Llc | Put | 173,200 | 51.66 | 8,338 | 85.06 | |||
| 2025-08-14 | 13F | Jane Street Group, Llc | Call | 70,700 | 855.41 | 3,403 | 1,069.42 | |||
| 2025-08-11 | 13F | Principal Securities, Inc. | 9,714 | 3.76 | 468 | 57.24 | ||||
| 2025-08-01 | 13F | Liberty Wealth Management Llc | 0 | -100.00 | 0 | -100.00 | ||||
| 2025-07-30 | 13F | Whittier Trust Co | 222 | 0.00 | 11 | 25.00 | ||||
| 2025-08-11 | 13F | TD Waterhouse Canada Inc. | 270 | 13 | ||||||
| 2025-08-15 | 13F | Tower Research Capital LLC (TRC) | 35 | 2 | ||||||
| 2025-07-28 | 13F | Kiker Wealth Management, LLC | 1,750 | 52.17 | 84 | 86.67 | ||||
| 2025-08-05 | 13F | Financial Sense Advisors, Inc. | 27,513 | -48.17 | 1,324 | -36.77 | ||||
| 2025-08-14 | 13F | Glen Eagle Advisors, LLC | 3 | 0.00 | 0 | |||||
| 2025-08-14 | 13F | Cubist Systematic Strategies, LLC | Call | 43,300 | 501.39 | 2,084 | 633.80 | |||
| 2025-08-05 | 13F | Advisors Preferred, LLC | 235 | -15.77 | 11 | 10.00 | ||||
| 2025-08-13 | 13F | StoneX Group Inc. | 0 | -100.00 | 0 | -100.00 | ||||
| 2025-08-14 | 13F | Transamerica Financial Advisors, Inc. | 2 | 0.00 | 0 | |||||
| 2025-08-14 | 13F | UBS Group AG | Put | 0 | -100.00 | 0 | -100.00 | |||
| 2025-07-22 | 13F | DAVENPORT & Co LLC | 4,365 | -30.33 | 210 | -14.98 | ||||
| 2025-08-06 | 13F | Golden State Wealth Management, LLC | 60 | 3 | ||||||
| 2025-08-06 | 13F | Commonwealth Equity Services, Llc | 34,552 | -4.55 | 2 | 0.00 | ||||
| 2025-08-07 | 13F | PCG Wealth Advisors, LLC | 317,038 | -23.55 | 15,262 | -6.71 | ||||
| 2025-07-30 | 13F | Atlantic Edge Private Wealth Management, LLC | 70 | 0.00 | 3 | 50.00 | ||||
| 2025-08-14 | 13F | Sagard Holdings Management Inc. | 90 | 4 | ||||||
| 2025-08-14 | 13F | Cubist Systematic Strategies, LLC | Put | 47,000 | 2,263 | |||||
| 2025-08-27 | 13F/A | Squarepoint Ops LLC | 32,910 | -2.08 | 1,584 | 19.55 | ||||
| 2025-07-30 | 13F | Bogart Wealth, LLC | 636 | 3,080.00 | 31 | |||||
| 2025-08-06 | 13F | First Horizon Advisors, Inc. | 196 | 9 | ||||||
| 2025-08-12 | 13F | Howe & Rusling Inc | 100 | -50.00 | 5 | -42.86 | ||||
| 2025-08-15 | 13F | Sender Co & Partners, Inc. | 25,989 | 49.56 | 1,251 | 82.63 | ||||
| 2025-07-30 | 13F | D.a. Davidson & Co. | 93,815 | 159.16 | 4,516 | 216.25 | ||||
| 2025-08-14 | 13F | Prelude Capital Management, Llc | 0 | -100.00 | 0 | |||||
| 2025-08-05 | 13F | Carolinas Wealth Consulting Llc | 0 | -100.00 | 0 | -100.00 | ||||
| 2025-08-13 | 13F | Cerity Partners LLC | 21,401 | 1.75 | 1,030 | 24.25 | ||||
| 2025-08-08 | 13F | Pnc Financial Services Group, Inc. | 4,781 | 1,452.27 | 230 | 1,816.67 | ||||
| 2025-08-14 | 13F | Wellington Management Group Llp | 0 | -100.00 | 0 | |||||
| 2025-08-14 | 13F | Stifel Financial Corp | 165,604 | 118.33 | 7,972 | 166.44 | ||||
| 2025-08-01 | 13F | GoalVest Advisory LLC | 1,053 | 0.00 | 51 | 21.95 | ||||
| 2025-08-14 | 13F | Jane Street Group, Llc | 378,792 | 18,235 | ||||||
| 2025-08-05 | 13F | Simplex Trading, Llc | 78,910 | 6.23 | 4 | 50.00 | ||||
| 2025-04-25 | 13F | K.J. Harrison & Partners Inc | 0 | -100.00 | 0 | -100.00 | ||||
| 2025-07-14 | 13F | AdvisorNet Financial, Inc | 225 | 11 | ||||||
| 2025-08-01 | 13F | Envestnet Asset Management Inc | 119,708 | -3.86 | 5,763 | 17.30 | ||||
| 2025-08-05 | 13F | Verity Asset Management, Inc. | 5,240 | -22.71 | 252 | -5.62 | ||||
| 2025-08-01 | 13F | Anson Capital, Inc. | 6,991 | 3.79 | 337 | 26.79 | ||||
| 2025-07-29 | 13F | Beverly Hills Private Wealth, LLC | 24,020 | 43.08 | 1,156 | 74.62 | ||||
| 2025-08-18 | 13F | Wolverine Trading, Llc | 47,157 | 249.86 | 2,213 | 315.79 | ||||
| 2025-08-11 | 13F | Vanguard Group Inc | 5,500 | 0.00 | 265 | 22.22 | ||||
| 2025-08-12 | 13F | Global Retirement Partners, LLC | 3,669 | -59.34 | 177 | -38.46 | ||||
| 2025-08-11 | 13F | Aptus Capital Advisors, LLC | 497 | 0.00 | 24 | 21.05 | ||||
| 2025-08-14 | 13F | Fmr Llc | 677 | -18.73 | 33 | 0.00 | ||||
| 2025-08-15 | 13F | Kestra Advisory Services, LLC | 74,114 | -8.71 | 3,568 | 11.40 | ||||
| 2025-08-14 | 13F | Mariner, LLC | 13,983 | 7.59 | 673 | 31.45 | ||||
| 2025-08-08 | 13F | SG Americas Securities, LLC | 40,214 | 2 | ||||||
| 2025-08-13 | 13F | Quadrature Capital Ltd | 0 | -100.00 | 0 | |||||
| 2025-05-14 | 13F | Legend Financial Advisors, Inc. | 0 | -100.00 | 0 | |||||
| 2025-08-12 | 13F | CIBC Private Wealth Group, LLC | 91 | 4 | ||||||
| 2025-08-12 | 13F | Steward Partners Investment Advisory, Llc | 6,302 | 384.77 | 303 | 494.12 | ||||
| 2025-08-07 | 13F | Guardian Partners Inc. | 78,400 | 3,784 | ||||||
| 2025-08-14 | 13F | Goldman Sachs Group Inc | Call | 0 | -100.00 | 0 | ||||
| 2025-07-15 | 13F | Compagnie Lombard Odier SCmA | 250 | -50.00 | 12 | -36.84 | ||||
| 2025-05-16 | 13F | Coppell Advisory Solutions LLC | 0 | -100.00 | 0 | |||||
| 2025-08-08 | 13F | Creative Planning | 19,867 | 1.20 | 956 | 23.51 | ||||
| 2025-08-14 | 13F | Royal Bank Of Canada | 246,478 | 17.32 | 11,866 | 43.17 | ||||
| 2025-08-14 | 13F | Goldman Sachs Group Inc | 0 | -100.00 | 0 | |||||
| 2025-08-18 | 13F | Wolverine Trading, Llc | Call | 17,900 | -69.30 | 840 | -63.55 | |||
| 2025-08-05 | 13F | Magnolia Capital Advisors Llc | 4,701 | 226 | ||||||
| 2025-08-18 | 13F | Wolverine Trading, Llc | Put | 12,100 | -8.33 | 568 | 8.83 | |||
| 2025-08-14 | 13F | SummitTX Capital, L.P. | 75,000 | 3,610 | ||||||
| 2025-08-27 | NP | TIFF INVESTMENT PROGRAM - TIFF Multi-Asset Fund | 6,284 | 303 | ||||||
| 2025-04-24 | 13F | Kessler Investment Group, LLC | 0 | -100.00 | 0 | |||||
| 2025-07-16 | 13F | Highline Wealth Partners Llc | 0 | -100.00 | 0 | |||||
| 2025-07-21 | 13F | Mirae Asset Global Investments Co., Ltd. | 8,800 | -28.46 | 424 | -12.78 | ||||
| 2025-07-16 | 13F | One + One Wealth Management, Llc | 67,350 | -2.12 | 3,242 | 19.45 | ||||
| 2025-07-29 | 13F | Private Trust Co Na | 40 | -45.21 | 2 | -50.00 | ||||
| 2025-07-17 | 13F | Moss Adams Wealth Advisors LLC | 64,239 | 3,092 | ||||||
| 2025-08-12 | 13F | J.w. Cole Advisors, Inc. | 20,320 | 978 | ||||||
| 2025-08-13 | 13F | Level Four Advisory Services, Llc | 16,433 | -0.95 | 791 | 20.95 | ||||
| 2025-08-14 | 13F | Bnp Paribas Arbitrage, Sa | 42,633 | 86.38 | 2,052 | 127.49 | ||||
| 2025-08-11 | 13F | Citigroup Inc | Put | 0 | -100.00 | 0 | -100.00 | |||
| 2025-08-14 | 13F | Visionary Wealth Advisors | 4,307 | 207 | ||||||
| 2025-08-08 | 13F | Emerald Investment Partners, Llc | 45 | 2 | ||||||
| 2025-08-13 | 13F | Summit Financial, LLC | 80,552 | -0.66 | 3,884 | 21.41 | ||||
| 2025-08-15 | 13F | Ion Asset Management Ltd. | 30,800 | 15.36 | 1,483 | 40.74 | ||||
| 2025-08-06 | 13F | Prospera Financial Services Inc | 29,429 | 1,417 | ||||||
| 2025-05-12 | 13F | Independent Advisor Alliance | 0 | -100.00 | 0 | |||||
| 2025-08-14 | 13F | Banco BTG Pactual S.A. | 18,059 | -76.63 | 869 | -71.49 | ||||
| 2025-08-14 | 13F | GWM Advisors LLC | 10,357 | -29.93 | 499 | -14.58 | ||||
| 2025-05-12 | 13F | Sandy Spring Bank | 72 | 2.86 | 3 | 0.00 | ||||
| 2025-07-29 | 13F | Robinson Value Management, Ltd. | 5,547 | 0.00 | 267 | 22.48 | ||||
| 2025-08-14 | 13F | Susquehanna International Group, Llp | Put | 179,000 | -5.74 | 8,617 | 15.03 | |||
| 2025-07-16 | 13F | Strategic Investment Solutions, Inc. /IL | 0 | -100.00 | 0 | -100.00 | ||||
| 2025-08-14 | 13F | Susquehanna International Group, Llp | 7,408 | -92.35 | 357 | -90.68 | ||||
| 2025-08-18 | 13F | Hollencrest Capital Management | 18,591 | 0.00 | 895 | 21.96 | ||||
| 2025-08-14 | 13F | Saudi Central Bank | 203,700 | 9,822 | ||||||
| 2025-08-14 | 13F | Susquehanna International Group, Llp | Call | 678,500 | -10.49 | 32,663 | 9.23 | |||
| 2025-08-12 | 13F | LPL Financial LLC | 723,885 | -2.96 | 34,848 | 18.42 | ||||
| 2025-05-05 | 13F | Lindbrook Capital, Llc | 100 | 0.00 | 4 | 0.00 | ||||
| 2025-07-21 | 13F | Quattro Financial Advisors Llc | 49,195 | 0.00 | 2,368 | 22.06 | ||||
| 2025-08-14 | 13F | Federation des caisses Desjardins du Quebec | 73,345 | -1.16 | 3,531 | 20.60 | ||||
| 2025-08-12 | 13F | Change Path, LLC | 4,308 | -49.66 | 207 | -38.58 | ||||
| 2025-07-25 | 13F | Cwm, Llc | 2,230 | 0 | ||||||
| 2025-08-11 | 13F | Blue Bell Private Wealth Management, Llc | 326 | 8.31 | 16 | 36.36 |