Mga Batayang Estadistika
| Pemilik Institusional | 168 total, 164 long only, 0 short only, 4 long/short - change of -1.75% MRQ |
| Alokasi Portofolio Rata-rata | 0.2080 % - change of 1.05% MRQ |
| Saham Institusional (Jangka Panjang) | 59,109,051 (ex 13D/G) - change of 3.26MM shares 5.83% MRQ |
| Nilai Institusional (Jangka Panjang) | $ 544,392 USD ($1000) |
Kepemilikan Institusional dan Pemegang Saham
Suzano S.A. - Depositary Receipt (Common Stock) (US:SUZ) memiliki 168 pemilik institusional dan pemegang saham yang telah mengajukan formulir 13D/G atau 13F kepada Komisi Bursa Efek (Securities Exchange Commission/SEC). Lembaga-lembaga ini memegang total 59,109,051 saham. Pemegang saham terbesar meliputi Atlas FRM LLC, UBS Group AG, State Street Corp, GNR - SPDR(R) S&P(R) Global Natural Resources ETF, DZ BANK AG Deutsche Zentral Genossenschafts Bank, Frankfurt am Main, Goldman Sachs Group Inc, Morgan Stanley, Bank Of America Corp /de/, Millennium Management Llc, and American Century Companies Inc .
Struktur kepemilikan institusional Suzano S.A. - Depositary Receipt (Common Stock) (NYSE:SUZ) menunjukkan posisi terkini di perusahaan oleh institusi dan dana, serta perubahan terbaru dalam ukuran posisi. Pemegang saham utama dapat mencakup investor individu, reksa dana, dana lindung nilai, atau institusi. Jadwal 13D menunjukkan bahwa investor memegang (atau pernah memegang) lebih dari 5% saham perusahaan dan bermaksud (atau pernah bermaksud) untuk secara aktif mengejar perubahan strategi bisnis. Jadwal 13G menunjukkan investasi pasif lebih dari 5%.
The share price as of September 5, 2025 is 9.63 / share. Previously, on September 9, 2024, the share price was 9.70 / share. This represents a decline of 0.72% over that period.

Skor Sentimen Dana
Skor Sentimen Dana (sebelumnya dikenal sebagai Skor Akumulasi Kepemilikan) menemukan saham-saham yang paling banyak dibeli oleh dana. Ini adalah hasil dari model kuantitatif multi-faktor yang canggih yang mengidentifikasi perusahaan dengan tingkat akumulasi institusional tertinggi. Model penilaian menggunakan kombinasi dari total peningkatan pemilik yang diungkapkan, perubahan dalam alokasi portofolio pada pemilik tersebut, dan metrik lainnya. Angka berkisar dari 0 hingga 100, dengan angka yang lebih tinggi menunjukkan tingkat akumulasi yang lebih tinggi dibandingkan dengan perusahaan sejenisnya, dan 50 adalah rata-ratanya.
Frekuensi Pembaruan: Setiap Hari
Lihat Ownership Explorer, yang menyediakan daftar perusahaan dengan peringkat tertinggi.
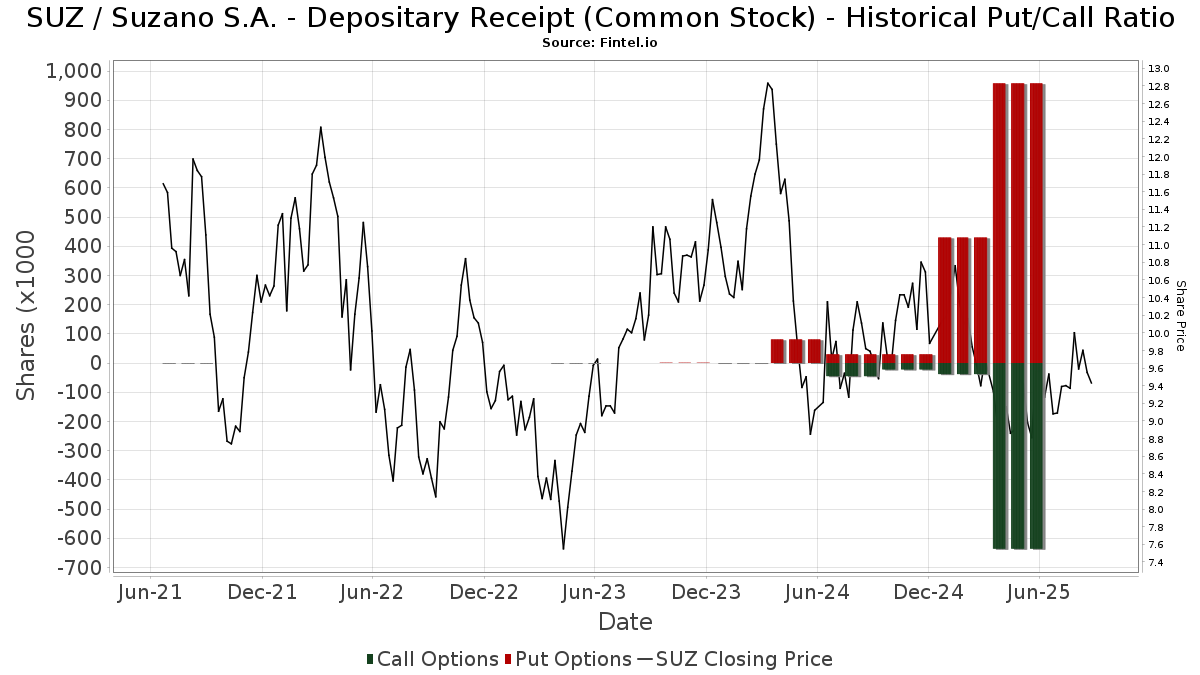
Rasio Put/Call Institusional
Selain melaporkan isu ekuitas dan utang standar, institusi dengan aset di bawah manajemen lebih dari 100 juta dolar AS juga harus mengungkapkan kepemilikan opsi put dan call mereka. Karena opsi put umumnya menunjukkan sentimen negatif, dan opsi call menunjukkan sentimen positif, kita dapat mengetahui sentimen institusional secara keseluruhan dengan memplot rasio put terhadap call. Grafik di sebelah kanan memplot rasio put/call historis untuk instrumen ini.
Menggunakan Rasio Put/Call sebagai indikator sentimen investor mengatasi salah satu kekurangan utama dari penggunaan total kepemilikan institusional, yaitu sejumlah besar aset yang dikelola diinvestasikan secara pasif untuk melacak indeks. Dana yang dikelola secara pasif biasanya tidak membeli opsi, sehingga indikator rasio put/call lebih akurat dalam melacak sentimen dana yang dikelola secara aktif.
Pengajuan 13F dan NPORT
Detail pada pengajuan 13F tersedia gratis. Detail pada pengajuan NP memerlukan keanggotaan premium. Baris berwarna hijau menunjukkan posisi baru. Baris berwarna merah menunjukkan posisi yang sudah ditutup. Klik tautan ini ikon untuk melihat riwayat transaksi selengkapnya.
Tingkatkan
untuk membuka data premium dan mengekspor ke Excel ![]() .
.
| Tanggal File | Sumber | Investor | Ketik | Presyo ng Avg (Silangan) |
Saham | Δ Saham (%) |
Dilaporkan Nilai ($1000) |
Nilai Δ (%) |
Alokasi Port (%) |
|
|---|---|---|---|---|---|---|---|---|---|---|
| 2025-08-14 | 13F | UBS Group AG | 4,957,731 | 89.26 | 46,652 | 91.70 | ||||
| 2025-08-14 | 13F | UBS Group AG | Call | 514,600 | 4,842 | |||||
| 2025-08-14 | 13F | Boston Private Wealth Llc | 0 | -100.00 | 0 | |||||
| 2025-08-14 | 13F | Raymond James Financial Inc | 962 | 9 | ||||||
| 2025-08-14 | 13F | Engineers Gate Manager LP | 25,162 | -69.41 | 237 | -69.11 | ||||
| 2025-08-14 | 13F | Cubist Systematic Strategies, LLC | 0 | -100.00 | 0 | |||||
| 2025-08-14 | 13F | UBS Group AG | Put | 892,000 | 120.30 | 8,394 | 123.16 | |||
| 2025-07-10 | 13F | Arkfeld Wealth Strategies, L.L.C. | 45,535 | -49.56 | 424 | -47.58 | ||||
| 2025-08-14 | 13F | Group One Trading, L.p. | 6,300 | 59 | ||||||
| 2025-05-14 | 13F | Ameriprise Financial Inc | 0 | -100.00 | 0 | |||||
| 2025-08-13 | 13F | Flow Traders U.s. Llc | 12,034 | 0 | ||||||
| 2025-08-14 | 13F | Vident Advisory, LLC | 10,359 | 97 | ||||||
| 2025-08-14 | 13F | State Street Corp | 4,257,445 | -0.82 | 40,063 | 0.47 | ||||
| 2025-08-14 | 13F | Royal Bank Of Canada | 628,608 | 910.71 | 5,916 | 923.53 | ||||
| 2025-08-14 | 13F | Citadel Advisors Llc | Call | 0 | -100.00 | 0 | ||||
| 2025-08-14 | 13F | BTG Pactual Asset Management US LLC | 0 | -100.00 | 0 | |||||
| 2025-06-26 | NP | DEHP - Dimensional Emerging Markets High Profitability ETF | 70,800 | 461.90 | 627 | 361.03 | ||||
| 2025-08-12 | 13F | MAI Capital Management | 1,985 | 19 | ||||||
| 2025-08-06 | 13F | Metis Global Partners, LLC | 232,174 | 24.83 | 2,185 | 26.46 | ||||
| 2025-07-24 | 13F | Lester Murray Antman dba SimplyRich | 21,755 | -37.74 | 0 | |||||
| 2025-06-23 | NP | UUPIX - Ultraemerging Markets Profund Investor Class | 2,799 | 6.75 | 25 | -14.29 | ||||
| 2025-08-13 | 13F | Rsm Us Wealth Management Llc | 11,735 | -5.78 | 110 | -4.35 | ||||
| 2025-08-27 | 13F/A | Squarepoint Ops LLC | 0 | -100.00 | 0 | -100.00 | ||||
| 2025-08-07 | NP | OTGAX - OTG Latin America Fund Class A Shares | 57,500 | 10.58 | 541 | 12.01 | ||||
| 2025-08-12 | 13F | Pathstone Holdings, LLC | 11,165 | -12.25 | 105 | -11.02 | ||||
| 2025-05-01 | 13F | Ballentine Partners, LLC | 0 | -100.00 | 0 | |||||
| 2025-07-28 | NP | AVSE - Avantis Responsible Emerging Markets Equity ETF | 26,098 | 13.25 | 227 | 2.26 | ||||
| 2025-05-13 | 13F | Ranmore Fund Management Ltd | 0 | -100.00 | 0 | |||||
| 2025-07-18 | 13F | Robeco Institutional Asset Management B.V. | 40,486 | -27.23 | 381 | -26.36 | ||||
| 2025-07-14 | 13F | Abound Wealth Management | 15 | 0.00 | 0 | |||||
| 2025-07-28 | NP | AVEM - Avantis Emerging Markets Equity ETF This fund is a listed as child fund of American Century Companies Inc and if that institution has disclosed ownership in this security, then these positions will not be double counted when calculating total shares and total value | 1,198,028 | 28.56 | 10,399 | 16.11 | ||||
| 2025-07-30 | NP | BRAZ - Global X Brazil Active ETF | 14,289 | 65.82 | 124 | 51.22 | ||||
| 2025-08-14 | 13F | Optiver Holding B.V. | 222,635 | 1,059.20 | 2,095 | 1,076.40 | ||||
| 2025-08-15 | 13F | Binnacle Investments Inc | 0 | -100.00 | 0 | |||||
| 2025-08-14 | 13F | Dynamo Internacional Gestao De Recursos Ltda. | 389,234 | 0.00 | 3,663 | 1.30 | ||||
| 2025-08-14 | 13F | Quantinno Capital Management LP | 57,320 | 54.57 | 539 | 56.69 | ||||
| 2025-07-10 | 13F | Moody National Bank Trust Division | 27,873 | 0.00 | 262 | 1.55 | ||||
| 2025-08-07 | 13F | Campbell & CO Investment Adviser LLC | 56,620 | -68.55 | 533 | -68.18 | ||||
| 2025-06-11 | NP | SLANX - DWS Latin America Equity Fund Class A | 37,800 | 94.85 | 335 | 53.21 | ||||
| 2025-07-15 | 13F | Compagnie Lombard Odier SCmA | 12,515 | 0.00 | 118 | 0.86 | ||||
| 2025-08-14 | 13F | Wells Fargo & Company/mn | 100 | 0.00 | 1 | |||||
| 2025-08-15 | 13F | Tower Research Capital LLC (TRC) | 2,083 | 20 | ||||||
| 2025-07-31 | 13F | Brinker Capital Investments, LLC | 0 | -100.00 | 0 | |||||
| 2025-08-13 | 13F | Groupama Asset Managment | 30,210 | 1.77 | 281 | 2.19 | ||||
| 2025-08-12 | 13F | Global Retirement Partners, LLC | 567 | 5 | ||||||
| 2025-08-04 | 13F | Waterfront Wealth Inc. | 317,605 | 2.20 | 2,989 | 3.50 | ||||
| 2025-07-24 | 13F | Us Bancorp \de\ | 6,993 | -18.37 | 66 | -17.72 | ||||
| 2025-08-14 | 13F | Fmr Llc | 3,181 | 25.24 | 30 | 26.09 | ||||
| 2025-08-14 | 13F | Wetherby Asset Management Inc | 31,387 | 41.98 | 295 | 32.29 | ||||
| 2025-08-11 | 13F | EntryPoint Capital, LLC | 19,132 | -35.76 | 180 | -34.78 | ||||
| 2025-07-16 | 13F | Signaturefd, Llc | 5,651 | -1.09 | 53 | 0.00 | ||||
| 2025-08-14 | 13F | Balyasny Asset Management Llc | 465,964 | 4.92 | 4,385 | 6.28 | ||||
| 2025-07-29 | NP | RBB FUND, INC. - Aquarius International Fund | 6,573 | 0.00 | 57 | -9.52 | ||||
| 2025-08-14 | 13F | Susquehanna International Group, Llp | Put | 19,800 | 96.04 | 186 | 100.00 | |||
| 2025-07-24 | 13F | Grace & White Inc /ny | 81,974 | 0.00 | 771 | 1.31 | ||||
| 2025-08-15 | 13F | WealthCollab, LLC | 0 | -100.00 | 0 | |||||
| 2025-07-31 | 13F | Carrera Capital Advisors | 0 | -100.00 | 0 | |||||
| 2025-08-08 | 13F | Creative Planning | 31,299 | -31.75 | 295 | -30.99 | ||||
| 2025-08-14 | 13F | Van Eck Associates Corp | 63,656 | 1.09 | 1 | |||||
| 2025-08-14 | 13F | Janus Henderson Group Plc | 848,857 | 7,992 | ||||||
| 2025-08-13 | 13F | Fisher Asset Management, LLC | 140,222 | -16.28 | 1,319 | -15.23 | ||||
| 2025-08-14 | 13F | Susquehanna International Group, Llp | Call | 102,700 | 179.84 | 966 | 184.12 | |||
| 2025-09-04 | 13F/A | Advisor Group Holdings, Inc. | 111 | 12.12 | 1 | |||||
| 2025-08-14 | 13F | Two Sigma Investments, Lp | 1,193,855 | 3.56 | 11,234 | 4.90 | ||||
| 2025-08-14 | 13F | Bank Of America Corp /de/ | 2,267,395 | -26.63 | 21,336 | -25.68 | ||||
| 2025-08-14 | 13F | Hrt Financial Lp | 29,332 | 183.78 | 0 | |||||
| 2025-08-28 | NP | GNR - SPDR(R) S&P(R) Global Natural Resources ETF | 3,816,202 | -1.49 | 35,910 | -0.22 | ||||
| 2025-04-30 | 13F | Sofos Investments, Inc. | 35 | 3,400.00 | 0 | |||||
| 2025-08-14 | 13F | Smartleaf Asset Management LLC | 0 | -100.00 | 0 | |||||
| 2025-08-13 | 13F | Northern Trust Corp | 895,153 | -4.84 | 8,423 | -3.62 | ||||
| 2025-07-24 | 13F | Ronald Blue Trust, Inc. | 909 | -79.30 | 9 | -80.00 | ||||
| 2025-06-26 | NP | DFCEX - Emerging Markets Core Equity Portfolio - Institutional Class This fund is a listed as child fund of Dimensional Fund Advisors Lp and if that institution has disclosed ownership in this security, then these positions will not be double counted when calculating total shares and total value | 59,174 | 0.00 | 524 | -18.00 | ||||
| 2025-08-11 | 13F | Principal Securities, Inc. | 97 | 1 | ||||||
| 2025-08-12 | 13F | Aigen Investment Management, Lp | 0 | -100.00 | 0 | |||||
| 2025-08-27 | NP | RYWTX - Emerging Markets 2x Strategy Fund Class A | 3,698 | 153.46 | 35 | 161.54 | ||||
| 2025-08-13 | 13F | EverSource Wealth Advisors, LLC | 2,402 | 700.67 | 23 | 1,000.00 | ||||
| 2025-08-13 | 13F | Provida Pension Fund Administrator | 0 | -100.00 | 0 | -100.00 | ||||
| 2025-07-16 | 13F | Highline Wealth Partners Llc | 0 | -100.00 | 0 | |||||
| 2025-08-28 | NP | Principal Diversified Select Real Asset Fund | 9,093 | -1.02 | 86 | 0.00 | ||||
| 2025-05-05 | 13F | Lindbrook Capital, Llc | 1,747 | -41.84 | 16 | -46.67 | ||||
| 2025-08-08 | 13F | Financial Gravity Companies, Inc. | 17 | -51.43 | 0 | |||||
| 2025-06-18 | NP | RTXAX - Tax-Managed Real Assets Fund Class A | 144,902 | 38.68 | 1,284 | 13.74 | ||||
| 2025-08-28 | NP | QEMM - SPDR MSCI Emerging Markets StrategicFactors ETF | 1,055 | -3.92 | 10 | -10.00 | ||||
| 2025-07-30 | 13F | DekaBank Deutsche Girozentrale | 778,866 | -0.07 | 7 | 0.00 | ||||
| 2025-08-14 | 13F | Jane Street Group, Llc | Put | 31,500 | 296 | |||||
| 2025-08-14 | 13F | Jane Street Group, Llc | Call | 18,900 | 178 | |||||
| 2025-08-14 | 13F | Jane Street Group, Llc | 77,468 | -6.39 | 729 | -5.21 | ||||
| 2025-08-08 | 13F | Pnc Financial Services Group, Inc. | 11,958 | 10.55 | 113 | 12.00 | ||||
| 2025-05-12 | 13F | Virtu Financial LLC | 0 | -100.00 | 0 | |||||
| 2025-07-21 | 13F | Mirae Asset Global Investments Co., Ltd. | 37,887 | -94.56 | 357 | -94.09 | ||||
| 2025-08-13 | 13F | Marshall Wace, Llp | 921,337 | -54.48 | 8,670 | -53.90 | ||||
| 2025-08-05 | 13F | ANTIPODES PARTNERS Ltd | 205,166 | -45.33 | 1,931 | -44.64 | ||||
| 2025-08-12 | 13F | Dimensional Fund Advisors Lp | 313,027 | 13.66 | 2,946 | 15.13 | ||||
| 2025-08-11 | 13F | Citigroup Inc | 90,102 | 1.23 | 848 | 2.54 | ||||
| 2025-08-07 | 13F | Allworth Financial LP | 647 | 138.75 | 6 | 200.00 | ||||
| 2025-05-15 | 13F | Old Mission Capital Llc | 0 | -100.00 | 0 | -100.00 | ||||
| 2025-08-13 | 13F | PineBridge Investments, L.P. | 121,030 | 0.00 | 1,139 | 1.25 | ||||
| 2025-08-14 | 13F | Bridgefront Capital, LLC | 13,439 | -38.34 | 126 | -37.62 | ||||
| 2025-05-19 | 13F | Ubs Asset Management Americas Inc | 0 | -100.00 | 0 | |||||
| 2025-08-12 | 13F | Rhumbline Advisers | 12,163 | 12.87 | 114 | 14.00 | ||||
| 2025-08-14 | 13F | Qube Research & Technologies Ltd | 314,124 | -32.79 | 2,956 | -31.93 | ||||
| 2025-08-14 | 13F | Graham Capital Management, L.P. | 66,811 | 51.87 | 629 | 53.92 | ||||
| 2025-07-24 | 13F | Ramirez Asset Management, Inc. | 0 | -100.00 | 0 | |||||
| 2025-07-25 | 13F | Yousif Capital Management, Llc | 20,457 | 0.00 | 192 | 1.05 | ||||
| 2025-08-14 | 13F | Goldman Sachs Group Inc | 3,577,018 | 541.77 | 33,660 | 550.16 | ||||
| 2025-08-14 | 13F | MIRAE ASSET GLOBAL ETFS HOLDINGS Ltd. | 14,289 | 42.65 | 134 | 44.09 | ||||
| 2025-08-26 | NP | Profunds - Profund Vp Emerging Markets | 11,863 | 13.67 | 112 | 15.63 | ||||
| 2025-07-28 | NP | AVXC - Avantis Emerging Markets ex-China Equity ETF | 23,810 | 55.87 | 207 | 41.10 | ||||
| 2025-08-14 | 13F | Two Sigma Advisers, Lp | 1,232,100 | 3.72 | 11,594 | 5.07 | ||||
| 2025-08-11 | 13F | Vanguard Group Inc | 241,245 | 89.10 | 2,270 | 91.56 | ||||
| 2025-08-13 | 13F | Pictet Asset Management Holding SA | 156,532 | -56.65 | 1,473 | -56.11 | ||||
| 2025-06-26 | NP | DFSE - Dimensional Emerging Markets Sustainability Core 1 ETF | 12,572 | 38.15 | 111 | 13.27 | ||||
| 2025-08-13 | 13F | Guggenheim Capital Llc | 57,091 | -13.91 | 537 | -12.82 | ||||
| 2025-08-07 | 13F | Sierra Ocean, Llc | 115 | 1 | ||||||
| 2025-08-12 | 13F | Coldstream Capital Management Inc | 0 | -100.00 | 0 | |||||
| 2025-08-14 | 13F/A | Skopos Labs, Inc. | 21,986 | 1,026.91 | 207 | 1,044.44 | ||||
| 2025-08-12 | 13F | SPX Equities Gestao de Recursos Ltda | 172,511 | -4.61 | 1,623 | -3.39 | ||||
| 2025-05-15 | 13F | Cullen Capital Management, LLC | 19,595 | 19.01 | 182 | 9.64 | ||||
| 2025-08-13 | 13F | Renaissance Technologies Llc | 317,700 | 5.80 | 2,990 | 7.17 | ||||
| 2025-07-28 | 13F | Harbour Investments, Inc. | 49 | 0.00 | 0 | |||||
| 2025-08-08 | 13F | Crossmark Global Holdings, Inc. | 34,897 | -0.11 | 328 | 1.23 | ||||
| 2025-08-14 | 13F | Aqr Capital Management Llc | 38,050 | 17.30 | 358 | 18.94 | ||||
| 2025-08-12 | 13F | Trexquant Investment LP | 138,896 | 1,307 | ||||||
| 2025-07-24 | 13F | Jfs Wealth Advisors, Llc | 90 | -61.37 | 1 | -100.00 | ||||
| 2025-07-25 | 13F | Cwm, Llc | 1,027 | -38.36 | 0 | |||||
| 2025-07-08 | 13F | Parallel Advisors, LLC | 5,440 | 21.92 | 51 | 24.39 | ||||
| 2025-07-11 | 13F | Farther Finance Advisors, LLC | 523 | 515.29 | 5 | |||||
| 2025-06-26 | NP | DFEV - Dimensional Emerging Markets Value ETF | 1,600 | 0.00 | 14 | -17.65 | ||||
| 2025-06-26 | NP | SNTKX - Steward International Enhanced Index Fund Class A | 25,371 | 0.00 | 225 | -18.25 | ||||
| 2025-08-13 | 13F | Brandes Investment Partners, Lp | 170,535 | 23.89 | 1,605 | 25.51 | ||||
| 2025-06-26 | NP | DVRAX - MFS Global Alternative Strategy Fund A | 4,894 | -0.45 | 43 | -18.87 | ||||
| 2025-08-14 | 13F | Aquatic Capital Management LLC | 0 | -100.00 | 0 | |||||
| 2025-08-11 | 13F | Absolute Gestao de Investimentos Ltda. | 0 | -100.00 | 0 | |||||
| 2025-07-28 | NP | NSI - National Security Emerging Markets Index ETF | 1,037 | 38.82 | 9 | 28.57 | ||||
| 2025-07-31 | 13F | R Squared Ltd | 0 | -100.00 | 0 | |||||
| 2025-08-14 | 13F/A | Barclays Plc | 10,650 | 0.00 | 0 | |||||
| 2025-06-26 | NP | DEXC - Dimensional Emerging Markets ex China Core Equity ETF | 16,300 | 27.34 | 144 | 4.35 | ||||
| 2025-08-14 | 13F | Citadel Advisors Llc | 76,086 | -66.05 | 716 | -65.66 | ||||
| 2025-08-11 | 13F | Brown Brothers Harriman & Co | 265 | 2 | ||||||
| 2025-08-14 | 13F | Citadel Advisors Llc | Put | 15,000 | -2.60 | 141 | -1.40 | |||
| 2025-08-13 | 13F | Channing Global Advisors, Llc | 261 | 16.00 | 2 | 0.00 | ||||
| 2025-08-14 | 13F | Mariner, LLC | 26,217 | 119.35 | 247 | 121.62 | ||||
| 2025-08-14 | 13F | Bnp Paribas Arbitrage, Sa | 383,436 | -50.41 | 3,608 | -49.76 | ||||
| 2025-04-17 | 13F | Constellation Investimentos e Participacoes Ltda | 0 | -100.00 | 0 | |||||
| 2025-03-28 | NP | DFAX - Dimensional World ex U.S. Core Equity 2 ETF | 3,960 | 0.00 | 43 | 5.00 | ||||
| 2025-08-14 | 13F | Millennium Management Llc | 1,844,894 | 18.86 | 17,360 | 20.40 | ||||
| 2025-08-14 | 13F | Bizma Investimentos Ltda | 344,547 | 0.00 | 3,242 | 1.31 | ||||
| 2025-08-11 | 13F | Cornerstone Planning Group LLC | 16 | 0.00 | 0 | |||||
| 2025-08-08 | 13F | Principal Financial Group Inc | 99,300 | -45.19 | 934 | -44.50 | ||||
| 2025-08-07 | 13F | Profund Advisors Llc | 30,970 | 0.97 | 291 | 2.46 | ||||
| 2025-08-14 | 13F | VPR Management LLC | 58,835 | 0.00 | 554 | 1.28 | ||||
| 2025-07-15 | 13F | Financial Management Professionals, Inc. | 0 | -100.00 | 0 | |||||
| 2025-07-28 | NP | AVEEX - Avantis Emerging Markets Equity Fund Institutional Class This fund is a listed as child fund of American Century Companies Inc and if that institution has disclosed ownership in this security, then these positions will not be double counted when calculating total shares and total value | 78,919 | 3.91 | 685 | -6.04 | ||||
| 2025-06-26 | NP | DFEM - Dimensional Emerging Markets Core Equity 2 ETF | 24,300 | 43.79 | 215 | 18.13 | ||||
| 2025-08-12 | 13F | XTX Topco Ltd | 0 | -100.00 | 0 | |||||
| 2025-08-14 | 13F | Headlands Technologies LLC | 17,567 | 479.96 | 165 | 489.29 | ||||
| 2025-08-12 | 13F | Jpmorgan Chase & Co | 245,695 | 109.57 | 2,312 | 112.21 | ||||
| 2025-08-06 | 13F | True Wealth Design, LLC | 55 | 14.58 | 1 | |||||
| 2025-08-08 | 13F | SG Americas Securities, LLC | 17,123 | 0 | ||||||
| 2025-08-14 | 13F | Susquehanna International Group, Llp | 0 | -100.00 | 0 | |||||
| 2025-08-05 | 13F | Simplex Trading, Llc | 19,135 | 534.66 | 0 | |||||
| 2025-08-14 | 13F | Point72 Asset Management, L.P. | 0 | -100.00 | 0 | |||||
| 2025-08-14 | 13F | DZ BANK AG Deutsche Zentral Genossenschafts Bank, Frankfurt am Main | 3,640,283 | 0.00 | 34,255 | 1.29 | ||||
| 2025-08-14 | 13F | Atomi Financial Group, Inc. | 16,684 | 41.52 | 157 | 43.12 | ||||
| 2025-08-21 | NP | HAP - VanEck Vectors Natural Resources ETF | 59,513 | 1.16 | 560 | 2.56 | ||||
| 2025-07-14 | 13F | Kapitalo Investimentos Ltda | 695,916 | 57.95 | 6,549 | 59.98 | ||||
| 2025-08-04 | 13F | Hantz Financial Services, Inc. | 16,161 | 2,034.87 | 0 | |||||
| 2025-08-12 | 13F | Deutsche Bank Ag\ | 205,049 | -2.76 | 1,930 | -1.53 | ||||
| 2025-08-11 | 13F | TD Waterhouse Canada Inc. | 10,800 | 17,900.00 | 100 | 9,900.00 | ||||
| 2025-07-14 | 13F | GAMMA Investing LLC | 1,107 | -10.51 | 10 | -9.09 | ||||
| 2025-07-31 | 13F | Caitong International Asset Management Co., Ltd | 0 | -100.00 | 0 | |||||
| 2025-07-28 | 13F | Ritholtz Wealth Management | 15,759 | -27.25 | 148 | -26.37 | ||||
| 2025-08-13 | 13F | Quantbot Technologies LP | 93,205 | 33.28 | 877 | 35.13 | ||||
| 2025-07-25 | NP | PRDAX - Diversified Real Asset Fund Class A | 108,290 | 48.99 | 940 | 34.53 | ||||
| 2025-05-14 | 13F | Credit Agricole S A | 3,870 | 0.00 | 36 | -10.26 | ||||
| 2025-08-13 | 13F | Quadrant Capital Group Llc | 36,714 | 280.65 | 345 | 287.64 | ||||
| 2025-08-12 | 13F | Proequities, Inc. | 0 | 0 | ||||||
| 2025-08-14 | 13F | Erste Asset Management GmbH | 60,454 | 562 | ||||||
| 2025-08-28 | NP | SPEM - SPDR(R) Portfolio Emerging Markets ETF | 412,101 | 6.67 | 3,878 | 8.02 | ||||
| 2025-08-14 | 13F | Mml Investors Services, Llc | 34,500 | 0 | ||||||
| 2025-08-08 | 13F | SBI Securities Co., Ltd. | 140 | 250.00 | 1 | |||||
| 2025-08-12 | 13F | CIBC Private Wealth Group, LLC | 2,167 | 8.35 | 20 | 25.00 | ||||
| 2025-08-14 | 13F | Banco BTG Pactual S.A. | 23,706 | 46.33 | 223 | 48.67 | ||||
| 2025-08-15 | 13F | Morgan Stanley | 2,359,401 | 4.69 | 22,202 | 6.04 | ||||
| 2025-08-04 | 13F | Assetmark, Inc | 64 | 611.11 | 1 | |||||
| 2025-08-12 | 13F | Legal & General Group Plc | 55,121 | 0.00 | 519 | 1.37 | ||||
| 2025-08-08 | 13F | Itau Unibanco Holding S.A. | 870,012 | 0.00 | 6,401 | 91,328.57 | ||||
| 2025-08-11 | 13F | Bell Investment Advisors, Inc | 69 | 23.21 | 1 | |||||
| 2025-04-21 | 13F | Nelson, Van Denburg & Campbell Wealth Management Group, LLC | 0 | -100.00 | 0 | |||||
| 2025-07-25 | NP | NRES - Xtrackers RREEF Global Natural Resources ETF | 55,091 | 55.84 | 478 | 41.00 | ||||
| 2025-08-13 | 13F | Atlas FRM LLC | 17,320,000 | 0.00 | 162,981 | 1.29 | ||||
| 2025-08-14 | 13F | Schonfeld Strategic Advisors LLC | 40,640 | -71.45 | 382 | -71.10 | ||||
| 2025-08-14 | 13F | Voloridge Investment Management, Llc | 142,296 | 1,339 | ||||||
| 2025-06-23 | NP | UBPIX - Ultralatin America Profund Investor Class | 13,801 | -6.18 | 122 | -22.78 | ||||
| 2025-08-12 | 13F | BlackRock, Inc. | 678,806 | 9.15 | 6,388 | 10.56 | ||||
| 2025-04-24 | NP | OAEM - OneAscent Emerging Markets ETF | 76,427 | -20.69 | 734 | -26.38 | ||||
| 2025-05-16 | 13F | Jones Financial Companies Lllp | 0 | -100.00 | 0 | |||||
| 2025-08-13 | 13F | Russell Investments Group, Ltd. | 144,902 | 38.68 | 1,364 | 40.52 | ||||
| 2025-06-23 | NP | Global Opportunities Portfolio - Global Opportunities Portfolio | 209,100 | 1,853 | ||||||
| 2025-08-14 | 13F | Verition Fund Management LLC | 44,051 | -16.47 | 415 | -15.34 | ||||
| 2025-08-12 | 13F | Atlas Capital Advisors Llc | 2,341 | 0.00 | 22 | 4.76 | ||||
| 2025-08-07 | 13F | Parkside Financial Bank & Trust | 122 | -40.78 | 1 | 0.00 | ||||
| 2025-08-12 | 13F | American Century Companies Inc | 1,591,333 | 36.19 | 14,974 | 37.96 | ||||
| 2025-07-25 | 13F | JustInvest LLC | 22,503 | 15.26 | 212 | 16.57 | ||||
| 2025-08-13 | 13F | Amundi | 0 | -100.00 | 0 | |||||
| 2025-08-12 | 13F | O'shaughnessy Asset Management, Llc | 42,889 | -24.86 | 404 | -23.96 | ||||
| 2025-07-28 | NP | AVES - Avantis Emerging Markets Value ETF This fund is a listed as child fund of American Century Companies Inc and if that institution has disclosed ownership in this security, then these positions will not be double counted when calculating total shares and total value | 221,813 | 256.87 | 1,925 | 222.45 | ||||
| 2025-06-26 | NP | DFAE - Dimensional Emerging Core Equity Market ETF | 87,700 | 56.05 | 777 | 28.22 | ||||
| 2025-05-14 | 13F | CIBC World Markets Inc. | 0 | -100.00 | 0 |