Mga Batayang Estadistika
| Pemilik Institusional | 170 total, 170 long only, 0 short only, 0 long/short - change of 25.00% MRQ |
| Alokasi Portofolio Rata-rata | 1.8087 % - change of -1.99% MRQ |
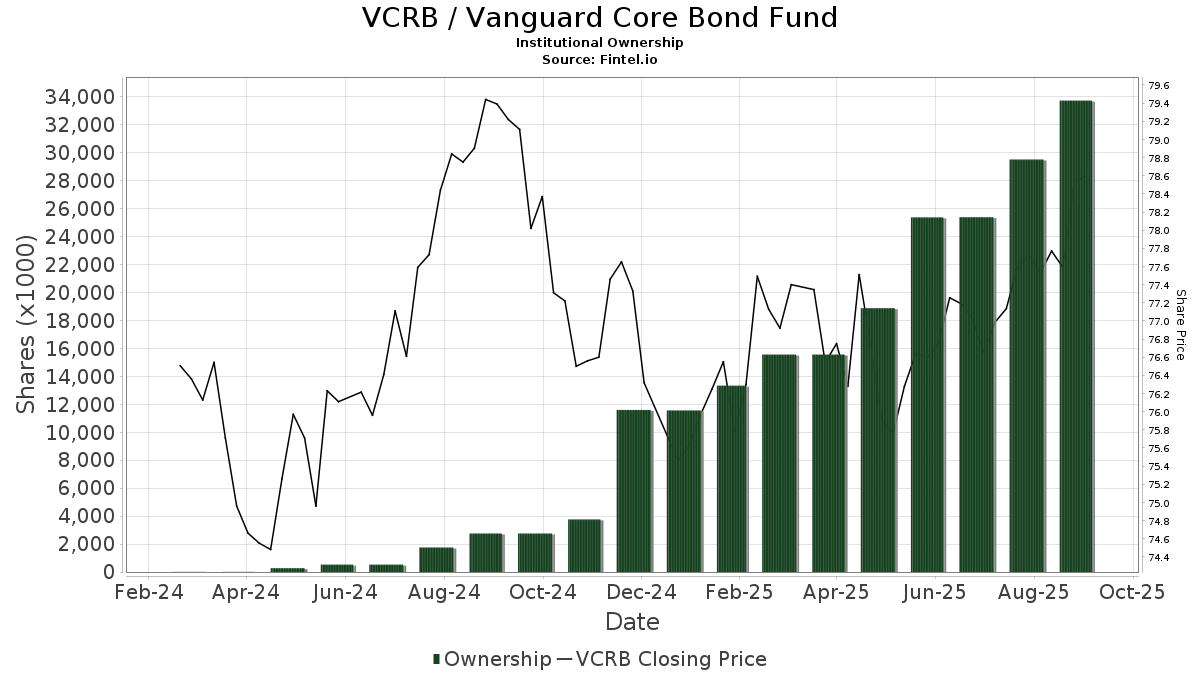
| Saham Institusional (Jangka Panjang) | 33,770,576 (ex 13D/G) - change of 8.39MM shares 33.07% MRQ |
| Nilai Institusional (Jangka Panjang) | $ 2,491,758 USD ($1000) |
Kepemilikan Institusional dan Pemegang Saham
Vanguard Core Bond Fund (US:VCRB) memiliki 170 pemilik institusional dan pemegang saham yang telah mengajukan formulir 13D/G atau 13F kepada Komisi Bursa Efek (Securities Exchange Commission/SEC). Lembaga-lembaga ini memegang total 33,770,576 saham. Pemegang saham terbesar meliputi HBK Sorce Advisory LLC, Signaturefd, Llc, Martel Wealth Advisors Inc, Assetmark, Inc, Brinker Capital Investments, LLC, Orion Portfolio Solutions, LLC, Diversified Portfolios, Inc., Smith & Howard Wealth Management, LLC, BKD Wealth Advisors, LLC, and Financial Engines Advisors L.L.C. .
Struktur kepemilikan institusional Vanguard Core Bond Fund (NasdaqGM:VCRB) menunjukkan posisi terkini di perusahaan oleh institusi dan dana, serta perubahan terbaru dalam ukuran posisi. Pemegang saham utama dapat mencakup investor individu, reksa dana, dana lindung nilai, atau institusi. Jadwal 13D menunjukkan bahwa investor memegang (atau pernah memegang) lebih dari 5% saham perusahaan dan bermaksud (atau pernah bermaksud) untuk secara aktif mengejar perubahan strategi bisnis. Jadwal 13G menunjukkan investasi pasif lebih dari 5%.
The share price as of September 5, 2025 is 78.24 / share. Previously, on September 6, 2024, the share price was 79.20 / share. This represents a decline of 1.21% over that period.
Skor Sentimen Dana
Skor Sentimen Dana (sebelumnya dikenal sebagai Skor Akumulasi Kepemilikan) menemukan saham-saham yang paling banyak dibeli oleh dana. Ini adalah hasil dari model kuantitatif multi-faktor yang canggih yang mengidentifikasi perusahaan dengan tingkat akumulasi institusional tertinggi. Model penilaian menggunakan kombinasi dari total peningkatan pemilik yang diungkapkan, perubahan dalam alokasi portofolio pada pemilik tersebut, dan metrik lainnya. Angka berkisar dari 0 hingga 100, dengan angka yang lebih tinggi menunjukkan tingkat akumulasi yang lebih tinggi dibandingkan dengan perusahaan sejenisnya, dan 50 adalah rata-ratanya.
Frekuensi Pembaruan: Setiap Hari
Lihat Ownership Explorer, yang menyediakan daftar perusahaan dengan peringkat tertinggi.
Rasio Put/Call Institusional
Selain melaporkan isu ekuitas dan utang standar, institusi dengan aset di bawah manajemen lebih dari 100 juta dolar AS juga harus mengungkapkan kepemilikan opsi put dan call mereka. Karena opsi put umumnya menunjukkan sentimen negatif, dan opsi call menunjukkan sentimen positif, kita dapat mengetahui sentimen institusional secara keseluruhan dengan memplot rasio put terhadap call. Grafik di sebelah kanan memplot rasio put/call historis untuk instrumen ini.
Menggunakan Rasio Put/Call sebagai indikator sentimen investor mengatasi salah satu kekurangan utama dari penggunaan total kepemilikan institusional, yaitu sejumlah besar aset yang dikelola diinvestasikan secara pasif untuk melacak indeks. Dana yang dikelola secara pasif biasanya tidak membeli opsi, sehingga indikator rasio put/call lebih akurat dalam melacak sentimen dana yang dikelola secara aktif.
Pengajuan 13F dan NPORT
Detail pada pengajuan 13F tersedia gratis. Detail pada pengajuan NP memerlukan keanggotaan premium. Baris berwarna hijau menunjukkan posisi baru. Baris berwarna merah menunjukkan posisi yang sudah ditutup. Klik tautan ini ikon untuk melihat riwayat transaksi selengkapnya.
Tingkatkan
untuk membuka data premium dan mengekspor ke Excel ![]() .
.
| Tanggal File | Sumber | Investor | Ketik | Presyo ng Avg (Silangan) |
Saham | Δ Saham (%) |
Dilaporkan Nilai ($1000) |
Nilai Δ (%) |
Alokasi Port (%) |
|
|---|---|---|---|---|---|---|---|---|---|---|
| 2025-07-30 | 13F | Mid-American Wealth Advisory Group, Inc. | 394 | 31 | ||||||
| 2025-07-31 | 13F | Conservest Capital Advisors, Inc. | 16,869 | 1,309 | ||||||
| 2025-07-09 | 13F | Dynamic Advisor Solutions LLC | 10,550 | 29.45 | 818 | 29.64 | ||||
| 2025-08-08 | 13F | Kaizen Financial Strategies | 122,783 | 2.79 | 9,525 | 3.00 | ||||
| 2025-08-14 | 13F | Raymond James Financial Inc | 13,457 | -1.69 | 1,044 | -1.51 | ||||
| 2025-08-07 | 13F | Resources Investment Advisors, LLC. | 31,155 | 10.96 | 2,417 | 11.13 | ||||
| 2025-07-01 | 13F | Harbor Investment Advisory, Llc | 12,203 | 13.12 | 947 | 13.29 | ||||
| 2025-08-08 | 13F | D'Orazio & Associates, Inc. | 29,450 | 2,285 | ||||||
| 2025-08-14 | 13F | Ariadne Wealth Management, LP | 3,973 | 0.00 | 309 | 1.65 | ||||
| 2025-08-14 | 13F | Ancora Advisors, LLC | 328 | 25 | ||||||
| 2025-07-09 | 13F | Keystone Wealth Services, LLC | 5,093 | 43.42 | 395 | 44.16 | ||||
| 2025-07-28 | 13F | Harbour Investments, Inc. | 235 | 18 | ||||||
| 2025-07-29 | 13F | Private Trust Co Na | 1,929 | -0.98 | 150 | -0.67 | ||||
| 2025-08-07 | 13F | Meeder Advisory Services, Inc. | 331,656 | 25,730 | ||||||
| 2025-08-14 | 13F | Bank Of America Corp /de/ | 704,242 | 237.91 | 54,635 | 238.57 | ||||
| 2025-08-20 | 13F | Tull Financial Group, Inc. | 459,913 | 118.09 | 35,680 | 118.52 | ||||
| 2025-08-04 | 13F | HBK Sorce Advisory LLC | 8,213,718 | 3.21 | 637,220 | 3.41 | ||||
| 2025-08-14 | 13F | Old Mission Capital Llc | 46,105 | 3,577 | ||||||
| 2025-07-18 | 13F | Martel Wealth Advisors Inc | 1,384,604 | 2.36 | 107,418 | 2.56 | ||||
| 2025-08-14 | 13F | Aqr Capital Management Llc | 3,973 | 20.39 | 308 | 20.78 | ||||
| 2025-07-15 | 13F | Smith & Howard Wealth Management, LLC | 872,703 | 67,704 | ||||||
| 2025-05-02 | 13F | Transcendent Capital Group LLC | 0 | -100.00 | 0 | |||||
| 2025-08-14 | 13F | McIlrath & Eck, LLC | 115,743 | -5.83 | 8,979 | -5.64 | ||||
| 2025-07-31 | 13F | Schoolcraft Capital LLC | 373,229 | -7.52 | 28,955 | -7.34 | ||||
| 2025-07-15 | 13F | Signal Tree Financial Partners Llc | 15,803 | 48.40 | 1,226 | 48.67 | ||||
| 2025-07-25 | 13F | Atria Wealth Solutions, Inc. | 6,701 | -43.64 | 520 | -43.59 | ||||
| 2025-08-13 | 13F | Daner Wealth Management, LLC | 11,866 | 161.31 | 919 | 165.61 | ||||
| 2025-08-14 | 13F | EP Wealth Advisors, Inc. | 0 | -100.00 | 0 | |||||
| 2025-08-13 | 13F | Boston Family Office Llc | 55,546 | 84.27 | 4 | 100.00 | ||||
| 2025-08-15 | 13F | CI Private Wealth, LLC | 2,611 | 1.08 | 203 | 1.00 | ||||
| 2025-05-07 | 13F | Magnolia Wealth Management, LLC | 581,996 | -3.02 | 45,064 | -0.95 | ||||
| 2025-07-16 | 13F | Plancorp, LLC | 0 | -100.00 | 0 | |||||
| 2025-07-25 | 13F | BCR Wealth Strategies, LLC | 254,508 | 64.42 | 20 | 72.73 | ||||
| 2025-07-14 | 13F | Farmers Trust Co | 7,918 | 0.00 | 614 | 0.16 | ||||
| 2025-08-14 | 13F | GWM Advisors LLC | 30,300 | 7.82 | 2,351 | 8.05 | ||||
| 2025-07-17 | 13F | Enclave Advisors LLC | 33,148 | 7.09 | 2,572 | 7.30 | ||||
| 2025-08-13 | 13F | Brown Advisory Inc | 10,236 | 794 | ||||||
| 2025-07-22 | 13F | Gutierrez Wealth Advisory, LLC | 112,717 | 0.23 | 8,745 | 0.42 | ||||
| 2025-08-19 | 13F | Cape Investment Advisory, Inc. | 2,725 | 1,283.25 | 211 | 1,306.67 | ||||
| 2025-08-06 | 13F | SOUTH STATE Corp | 82,271 | -39.89 | 6,383 | -39.78 | ||||
| 2025-08-06 | 13F | Ethos Financial Group, LLC | 31,938 | 50.35 | 2,478 | 50.67 | ||||
| 2025-07-30 | 13F | Mills Wealth Advisors LLC | 387,849 | 22.58 | 30,089 | 22.82 | ||||
| 2025-08-01 | 13F | Gwn Securities Inc. | 0 | -100.00 | 0 | |||||
| 2025-05-05 | 13F | Morningstar Investment Services LLC | 297,313 | 23 | ||||||
| 2025-07-24 | 13F | Grand Wealth Management, Llc | 54,315 | 0.57 | 4,214 | 0.77 | ||||
| 2025-08-12 | 13F | Coldstream Capital Management Inc | 0 | -100.00 | 0 | |||||
| 2025-08-14 | 13F | Financial Engines Advisors L.L.C. | 825,903 | 3.61 | 64,074 | 3.81 | ||||
| 2025-07-29 | 13F | Swmg, Llc | 3,825 | -68.66 | 294 | -68.76 | ||||
| 2025-08-06 | 13F | AE Wealth Management LLC | 1,585 | -23.69 | 123 | -23.75 | ||||
| 2025-08-15 | 13F | Morgan Stanley | 1 | 0 | ||||||
| 2025-07-15 | 13F | Patriot Investment Management Inc. | 27,393 | -0.47 | 2,125 | -0.28 | ||||
| 2025-08-01 | 13F | Ashton Thomas Private Wealth, LLC | 2,718 | 211 | ||||||
| 2025-07-15 | 13F | Verum Partners LLC | 245,018 | -4.13 | 19,009 | -3.95 | ||||
| 2025-07-30 | 13F | Cornerstone Advisory, LLC | 5,766 | 3.71 | 447 | 5.18 | ||||
| 2025-05-16 | 13F | American Trust | 0 | -100.00 | 0 | -100.00 | ||||
| 2025-07-17 | 13F | Barry Investment Advisors, LLC | 73,231 | 37.77 | 5,681 | 38.06 | ||||
| 2025-08-13 | 13F | Strategic Family Wealth Counselors, L.L.C. | 63,121 | 9.84 | 4,897 | 10.05 | ||||
| 2025-07-18 | 13F | Lynx Investment Advisory | 19,557 | 7.47 | 1,517 | 7.74 | ||||
| 2025-07-15 | 13F | SJS Investment Consulting Inc. | 250,309 | 52.05 | 19,419 | 52.35 | ||||
| 2025-09-04 | 13F/A | Advisor Group Holdings, Inc. | 41,227 | 322.11 | 3,198 | 323.02 | ||||
| 2025-08-12 | 13F | Jpmorgan Chase & Co | 189 | 15 | ||||||
| 2025-07-25 | 13F | Quantum Financial Planning Services, Inc. | 342,796 | 363.98 | 26,594 | 364.93 | ||||
| 2025-08-05 | 13F | Bank Of Montreal /can/ | 0 | -100.00 | 0 | |||||
| 2025-07-21 | 13F | Keystone Financial Group, Inc. | 305 | -78.49 | 23 | -78.70 | ||||
| 2025-08-06 | 13F | Rialto Wealth Management, LLC | 3,427 | 0.00 | 266 | 0.00 | ||||
| 2025-03-12 | 13F/A | Private Capital Management Llc | 34,936 | 1,031.35 | 2,656 | 1,025.42 | ||||
| 2025-08-13 | 13F | Greenwich Wealth Management LLC | 56,823 | -32.91 | 4 | -33.33 | ||||
| 2025-07-25 | 13F | Concurrent Investment Advisors, LLC | 5,299 | 411 | ||||||
| 2025-08-04 | 13F | Atria Investments Llc | 11,544 | -48.37 | 896 | -48.30 | ||||
| 2025-07-23 | 13F | Lansing Street Advisors | 90,738 | 10.29 | 7,039 | 10.50 | ||||
| 2025-08-13 | 13F | Keystone Financial Group | 6,809 | 528 | ||||||
| 2025-05-08 | 13F | Great Valley Advisor Group, Inc. | 0 | -100.00 | 0 | |||||
| 2025-08-14 | 13F | Citadel Advisors Llc | 51,801 | 3.96 | 4,019 | 4.15 | ||||
| 2025-08-14 | 13F | Royal Bank Of Canada | 21,272 | 64.06 | 1,651 | 64.44 | ||||
| 2025-08-04 | 13F | Elite Life Management LLC | 45,173 | 1.22 | 3,505 | 1.42 | ||||
| 2025-07-21 | 13F | Ameritas Advisory Services, LLC | 781 | 61 | ||||||
| 2025-07-09 | 13F | Breakwater Investment Management | 82,930 | 475.42 | 6,434 | 476.95 | ||||
| 2025-07-23 | 13F | Penney Financial, LLC | 73,828 | 5,728 | ||||||
| 2025-08-08 | 13F | AJ Advisors, LLC | 126,686 | 8.05 | 9,828 | 8.26 | ||||
| 2025-08-15 | 13F | Kestra Advisory Services, LLC | 5,827 | 452 | ||||||
| 2025-07-14 | 13F | UMA Financial Services, Inc. | 2,483 | 0.00 | 193 | 0.00 | ||||
| 2025-08-11 | 13F | Diversified Portfolios, Inc. | 891,655 | 15.29 | 69,175 | 15.51 | ||||
| 2025-08-08 | 13F | Cetera Investment Advisers | 56,679 | 4,397 | ||||||
| 2025-07-08 | 13F | ShankerValleau Wealth Advisors, Inc. | 156,621 | 3.56 | 12,151 | 3.77 | ||||
| 2025-08-04 | 13F | Spire Wealth Management | 0 | -100.00 | 0 | |||||
| 2025-07-16 | 13F | Novem Group | 4,333 | 336 | ||||||
| 2025-08-12 | 13F | Change Path, LLC | 84,165 | 40.63 | 6,530 | 40.89 | ||||
| 2025-07-24 | 13F | Bernard Wealth Management Corp. | 12 | 0.00 | 1 | |||||
| 2025-08-06 | 13F | Nicholas Hoffman & Company, LLC. | 39,800 | 6.81 | 3,088 | 7.00 | ||||
| 2025-07-25 | 13F | LRI Investments, LLC | 2,614 | -2.35 | 203 | -2.42 | ||||
| 2025-08-12 | 13F | J.w. Cole Advisors, Inc. | 3,318 | 257 | ||||||
| 2025-08-14 | 13F | Integrated Wealth Concepts LLC | 2,861 | 222 | ||||||
| 2025-08-11 | 13F | Brown Brothers Harriman & Co | 0 | -100.00 | 0 | |||||
| 2025-08-14 | 13F | Mariner, LLC | 352,465 | 284.19 | 27,344 | 284.96 | ||||
| 2025-08-20 | 13F/A | Coppell Advisory Solutions LLC | 24,061 | 31.12 | 1,861 | 30.80 | ||||
| 2025-07-17 | 13F | San Luis Wealth Advisors LLC | 211,195 | -51.44 | 16 | -51.52 | ||||
| 2025-07-16 | 13F | Signaturefd, Llc | 4,555,932 | 29.24 | 353,449 | 29.49 | ||||
| 2025-08-07 | 13F | Tfo-tdc, Llc | 2,911 | 226 | ||||||
| 2025-08-19 | 13F | Asset Dedication, LLC | 720 | 56 | ||||||
| 2025-08-27 | 13F/A | Brinker Capital Investments, LLC | 960,085 | 7.38 | 74,483 | 7.59 | ||||
| 2025-07-28 | 13F | Cornerstone Wealth Group, LLC | 278,667 | 0.50 | 21,619 | 0.70 | ||||
| 2025-08-06 | 13F | Commonwealth Equity Services, Llc | 79,862 | 8.71 | 6 | 20.00 | ||||
| 2025-07-28 | 13F | Axxcess Wealth Management, Llc | 24,260 | -31.81 | 1,882 | -31.66 | ||||
| 2025-08-14 | 13F | Marshall Investment Management, Llc | 0 | -100.00 | 0 | |||||
| 2025-08-13 | 13F | Momentous Wealth Management, Inc. | 327,879 | 8.62 | 25,437 | 8.83 | ||||
| 2025-07-24 | 13F | KC Investment Advisors, LLC | 88,855 | -50.11 | 6,893 | -50.01 | ||||
| 2025-07-25 | 13F | Envestnet Portfolio Solutions, Inc. | 48,562 | -10.55 | 3,767 | -10.37 | ||||
| 2025-08-08 | 13F | Foundations Investment Advisors, LLC | 187,202 | 7.12 | 14,523 | 7.33 | ||||
| 2025-07-30 | 13F | Retirement Planning Group | 34,684 | -10.64 | 2,691 | -10.48 | ||||
| 2025-07-21 | 13F | Trellis Wealth Advisors LLC | 11,598 | 900 | ||||||
| 2025-05-15 | 13F/A | Orion Portfolio Solutions, LLC | 894,071 | 69,228 | ||||||
| 2025-08-14 | 13F | Bnp Paribas Arbitrage, Sa | 0 | -100.00 | 0 | |||||
| 2025-08-14 | 13F | NorthLanding Financial Partners, LLC | 117,512 | 26.19 | 9,117 | 26.44 | ||||
| 2025-04-29 | 13F | Financial Network Wealth Management LLC | 70,424 | 5 | ||||||
| 2025-08-07 | 13F | Tilson Financial Group, Inc. | 431,491 | -0.45 | 33 | 0.00 | ||||
| 2025-08-11 | 13F | NewEdge Wealth, LLC | 288,067 | 22,340 | ||||||
| 2025-08-08 | 13F | CFO4Life Group, LLC | 157,305 | 9.55 | 12,204 | 9.76 | ||||
| 2025-08-13 | 13F | Continuum Advisory, LLC | 0 | -100.00 | 0 | |||||
| 2025-08-11 | 13F | Invenio Wealth Partners Llc | 145,775 | 11,309 | ||||||
| 2025-07-15 | 13F | Hofer & Associates. Inc | 85,133 | 6,605 | ||||||
| 2025-04-29 | 13F | Proffitt & Goodson Inc | 0 | -100.00 | 0 | |||||
| 2025-07-28 | 13F | Keeler & Nadler Financial Planning & Wealth Management | 121,433 | 53.51 | 9,421 | 54.30 | ||||
| 2025-07-22 | 13F | Olistico Wealth, LLC | 2,005 | 18.36 | 156 | 18.32 | ||||
| 2025-08-11 | 13F | Principal Securities, Inc. | 120,292 | 676.68 | 9,332 | 694.89 | ||||
| 2025-07-31 | 13F | Oppenheimer & Co Inc | 3,223 | 250 | ||||||
| 2025-08-12 | 13F | O'shaughnessy Asset Management, Llc | 63 | 5 | ||||||
| 2025-07-18 | 13F | Truist Financial Corp | 102,022 | -2.80 | 7,915 | -2.62 | ||||
| 2025-08-08 | 13F | Crossmark Global Holdings, Inc. | 35,707 | 3.27 | 2,770 | 3.47 | ||||
| 2025-08-12 | 13F | Accredited Wealth Management, LLC | 1,480 | 0.00 | 115 | 0.00 | ||||
| 2025-07-10 | 13F | Compton Wealth Advisory Group, LLC | 99,301 | 31.33 | 7,704 | 31.59 | ||||
| 2025-08-13 | 13F | Victory Financial Group, Llc | 58,657 | -0.09 | 4,551 | 0.11 | ||||
| 2025-08-12 | 13F | Goepper Burkhardt LLC | 0 | -100.00 | 0 | |||||
| 2025-08-13 | 13F | GeoWealth Management, LLC | 219 | 17 | ||||||
| 2025-08-14 | 13F | Jane Street Group, Llc | 317,475 | 24,630 | ||||||
| 2025-07-02 | 13F | Dentgroup LLC | 3,536 | 274 | ||||||
| 2025-07-21 | 13F | Mendota Financial Group, LLC | 17,534 | 1,478.22 | 1,360 | 1,481.40 | ||||
| 2025-08-07 | 13F | Addison Advisors LLC | 890 | 69 | ||||||
| 2025-08-01 | 13F | Pasadena Private Wealth, LLC | 5,316 | 0.53 | 412 | 0.73 | ||||
| 2025-08-12 | 13F | Proequities, Inc. | 0 | 0 | ||||||
| 2025-08-05 | 13F | Bank of New York Mellon Corp | 25,389 | -4.79 | 1,970 | -4.60 | ||||
| 2025-08-14 | 13F | TCG Advisory Services, LLC | 390,657 | 7.99 | 30,307 | 8.20 | ||||
| 2025-08-14 | 13F | Sentinus, LLC | 24,404 | -2.03 | 1,893 | -1.82 | ||||
| 2025-08-13 | 13F | Renaissance Technologies Llc | 5,700 | 442 | ||||||
| 2025-07-14 | 13F | AdvisorNet Financial, Inc | 1,305 | 194.58 | 101 | 197.06 | ||||
| 2025-08-11 | 13F | HighTower Advisors, LLC | 177,211 | 4.38 | 13,748 | 4.58 | ||||
| 2025-07-16 | 13F | Stephenson National Bank & Trust | 657 | 22.12 | 51 | 21.95 | ||||
| 2025-07-22 | 13F | Tandem Investment Partners LLC | 77,289 | 6.81 | 5,996 | 7.01 | ||||
| 2025-08-14 | 13F | Hrt Financial Lp | 7,438 | 1 | ||||||
| 2025-07-29 | 13F | BKD Wealth Advisors, LLC | 828,445 | 70.87 | 64,271 | 71.20 | ||||
| 2025-07-29 | 13F | Chicago Partners Investment Group LLC | 107,504 | 970.33 | 8,276 | 974.81 | ||||
| 2025-08-12 | 13F | Ameritas Investment Partners, Inc. | 125 | 10 | ||||||
| 2025-07-15 | 13F | Garrett Investment Advisors LLC | 177,842 | -16.87 | 13,797 | -16.70 | ||||
| 2025-07-23 | 13F | L.K. Benson & Company, P.C. | 7,595 | 36.40 | 589 | 36.66 | ||||
| 2025-08-08 | 13F | TD Capital Management LLC | 7,629 | 198.82 | 592 | 200.00 | ||||
| 2025-07-23 | 13F | Ami Investment Management Inc | 173,405 | 13,453 | ||||||
| 2025-08-12 | 13F | LPL Financial LLC | 482,581 | 58.32 | 37,439 | 58.63 | ||||
| 2025-08-14 | 13F | Wells Fargo & Company/mn | 0 | -100.00 | 0 | |||||
| 2025-07-07 | 13F | Retirement Wealth Solutions LLC | 2,523 | 196 | ||||||
| 2025-07-29 | 13F | Signature Estate & Investment Advisors Llc | 6,257 | 485 | ||||||
| 2025-08-08 | 13F | Advyzon Investment Management, LLC | 6,685 | 519 | ||||||
| 2025-08-14 | 13F | UBS Group AG | 0 | -100.00 | 0 | |||||
| 2025-07-07 | 13F | OMNI 360 Wealth, Inc. | 67,682 | 10.15 | 5,251 | 10.36 | ||||
| 2025-07-14 | 13F | Leonard Rickey Investment Advisors P.L.L.C. | 83,641 | 8.26 | 6,489 | 10.21 | ||||
| 2025-07-25 | 13F | Hazlett, Burt & Watson, Inc. | 337 | 0 | ||||||
| 2025-07-24 | 13F | Galvin, Gaustad & Stein, LLC | 48,054 | 165.20 | 3,728 | 165.72 | ||||
| 2025-07-30 | 13F | Bogart Wealth, LLC | 48,882 | 19.08 | 3,792 | 19.32 | ||||
| 2025-08-14 | 13F | Goldman Sachs Group Inc | 58,120 | 4,509 | ||||||
| 2025-08-01 | 13F | Zhang Financial LLC | 3,778 | 36.34 | 293 | 36.92 | ||||
| 2025-07-22 | 13F | Oak Hill Wealth Advisors, Llc | 16,328 | 1,252 | ||||||
| 2025-07-11 | 13F | Orrstown Financial Services Inc | 6,333 | 491 | ||||||
| 2025-08-12 | 13F | Up Strategic Wealth Investment Advisors Llc | 80,885 | 7.45 | 6,275 | 7.67 | ||||
| 2025-08-04 | 13F | Assetmark, Inc | 1,115,767 | 743.37 | 86,561 | 745.07 | ||||
| 2025-07-24 | 13F | Jfs Wealth Advisors, Llc | 1,044 | 81 | ||||||
| 2025-07-07 | 13F | Kings Path Partners LLC | 59,200 | 116.18 | 4,593 | 116.60 | ||||
| 2025-08-05 | 13F | Mission Wealth Management, Lp | 49,838 | 23.37 | 3,866 | 23.63 | ||||
| 2025-08-14 | 13F | Mml Investors Services, Llc | 70,215 | 10.38 | 5 | 25.00 | ||||
| 2025-08-12 | 13F | Global Retirement Partners, LLC | 2,124 | 165 | ||||||
| 2025-07-31 | 13F | Topsail Wealth Management, LLC | 14,964 | 405.71 | 1,161 | 406.55 | ||||
| 2025-08-08 | 13F | Pnc Financial Services Group, Inc. | 4,255 | -6.52 | 330 | -6.25 | ||||
| 2025-08-11 | 13F | Private Advisor Group, LLC | 118,839 | 7.18 | 9,219 | 7.40 | ||||
| 2025-07-24 | 13F | IFP Advisors, Inc | 336 | -1.47 | 26 | 0.00 | ||||
| 2025-07-16 | 13F | Essex Financial Services, Inc. | 6,125 | 1.74 | 475 | 1.93 | ||||
| 2025-08-11 | 13F | Regal Investment Advisors LLC | 3,282 | 255 | ||||||
| 2025-08-04 | 13F | Savvy Advisors, Inc. | 23,265 | 1,805 | ||||||
| 2025-08-13 | 13F | Flow Traders U.s. Llc | 36,814 | 281.49 | 3 | |||||
| 2025-08-04 | 13F | Keybank National Association/oh | 0 | -100.00 | 0 | |||||
| 2025-08-01 | 13F | Envestnet Asset Management Inc | 493,456 | 5.47 | 38,282 | 5.68 | ||||
| 2025-07-28 | 13F | Baker Boyer National Bank | 3,257 | 0.00 | 253 | 0.00 | ||||
| 2025-07-31 | 13F | Cambridge Investment Research Advisors, Inc. | 75,820 | 26.93 | 6 | 25.00 |