Mga Batayang Estadistika
| Saham Institusional (Jangka Panjang) | 213,008,732 - 67.48% (ex 13D/G) - change of 6.62MM shares 3.21% MRQ |
| Nilai Institusional (Jangka Panjang) | $ 10,466,719 USD ($1000) |
Kepemilikan Institusional dan Pemegang Saham
Viking Holdings Ltd (US:VIK) memiliki 365 pemilik institusional dan pemegang saham yang telah mengajukan formulir 13D/G atau 13F kepada Komisi Bursa Efek (Securities Exchange Commission/SEC). Lembaga-lembaga ini memegang total 213,008,732 saham. Pemegang saham terbesar meliputi Capital Research Global Investors, Canada Pension Plan Investment Board, Select Equity Group, L.P., T. Rowe Price Investment Management, Inc., Invesco Ltd., Fmr Llc, Holocene Advisors, LP, BlackRock, Inc., Massachusetts Financial Services Co /ma/, and Norges Bank .
Struktur kepemilikan institusional Viking Holdings Ltd (NYSE:VIK) menunjukkan posisi terkini di perusahaan oleh institusi dan dana, serta perubahan terbaru dalam ukuran posisi. Pemegang saham utama dapat mencakup investor individu, reksa dana, dana lindung nilai, atau institusi. Jadwal 13D menunjukkan bahwa investor memegang (atau pernah memegang) lebih dari 5% saham perusahaan dan bermaksud (atau pernah bermaksud) untuk secara aktif mengejar perubahan strategi bisnis. Jadwal 13G menunjukkan investasi pasif lebih dari 5%.
The share price as of September 5, 2025 is 62.83 / share. Previously, on September 6, 2024, the share price was 32.39 / share. This represents an increase of 93.98% over that period.

Skor Sentimen Dana
Skor Sentimen Dana (sebelumnya dikenal sebagai Skor Akumulasi Kepemilikan) menemukan saham-saham yang paling banyak dibeli oleh dana. Ini adalah hasil dari model kuantitatif multi-faktor yang canggih yang mengidentifikasi perusahaan dengan tingkat akumulasi institusional tertinggi. Model penilaian menggunakan kombinasi dari total peningkatan pemilik yang diungkapkan, perubahan dalam alokasi portofolio pada pemilik tersebut, dan metrik lainnya. Angka berkisar dari 0 hingga 100, dengan angka yang lebih tinggi menunjukkan tingkat akumulasi yang lebih tinggi dibandingkan dengan perusahaan sejenisnya, dan 50 adalah rata-ratanya.
Frekuensi Pembaruan: Setiap Hari
Lihat Ownership Explorer, yang menyediakan daftar perusahaan dengan peringkat tertinggi.
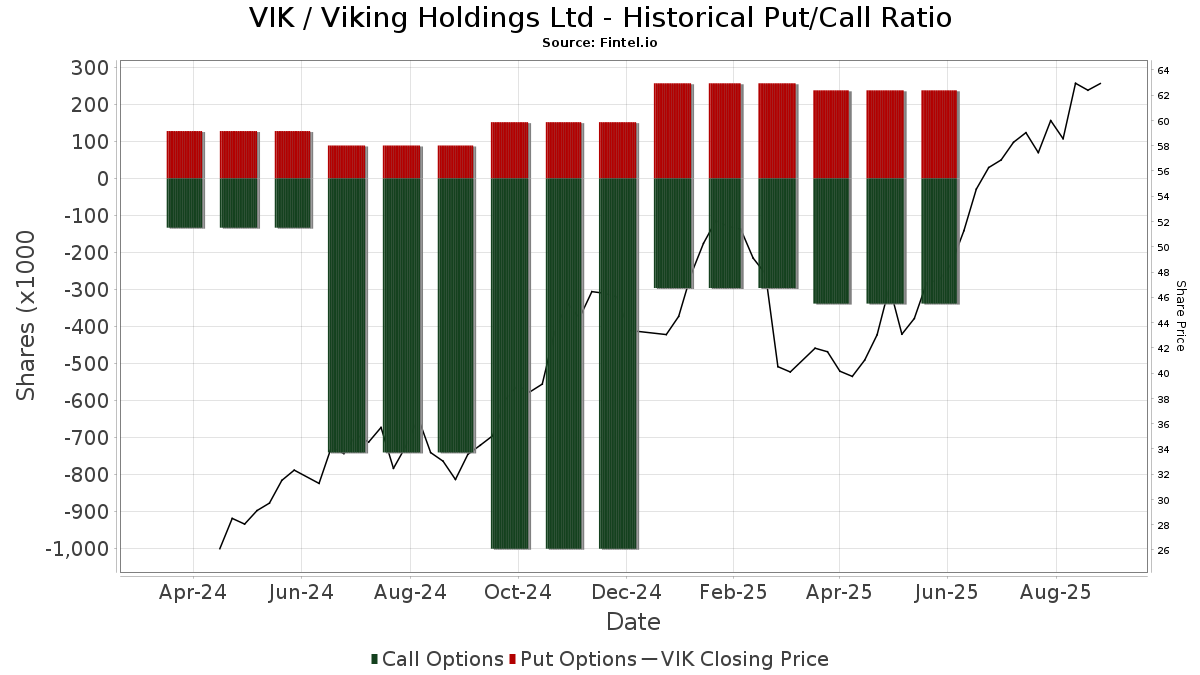
Rasio Put/Call Institusional
Selain melaporkan isu ekuitas dan utang standar, institusi dengan aset di bawah manajemen lebih dari 100 juta dolar AS juga harus mengungkapkan kepemilikan opsi put dan call mereka. Karena opsi put umumnya menunjukkan sentimen negatif, dan opsi call menunjukkan sentimen positif, kita dapat mengetahui sentimen institusional secara keseluruhan dengan memplot rasio put terhadap call. Grafik di sebelah kanan memplot rasio put/call historis untuk instrumen ini.
Menggunakan Rasio Put/Call sebagai indikator sentimen investor mengatasi salah satu kekurangan utama dari penggunaan total kepemilikan institusional, yaitu sejumlah besar aset yang dikelola diinvestasikan secara pasif untuk melacak indeks. Dana yang dikelola secara pasif biasanya tidak membeli opsi, sehingga indikator rasio put/call lebih akurat dalam melacak sentimen dana yang dikelola secara aktif.
Pengajuan 13D/G
Kami menyajikan pengajuan 13D/G secara terpisah dari pengajuan 13F karena perlakuan yang berbeda oleh SEC. Pengajuan 13D/G dapat diajukan oleh kelompok investor (dengan satu pemimpin), sedangkan pengajuan 13F tidak bisa. Hal ini mengakibatkan situasi di mana seorang investor dapat mengajukan 13D/G yang melaporkan satu nilai untuk total saham (mewakili semua saham yang dimiliki oleh kelompok investor), tetapi kemudian mengajukan 13F yang melaporkan nilai yang berbeda untuk total saham (mewakili kepemilikan mereka sendiri). Ini berarti bahwa kepemilikan saham dari pengajuan 13D/G dan pengajuan 13F seringkali tidak dapat dibandingkan secara langsung, sehingga kami menyajikannya secara terpisah.
Catatan: Mulai 16 Mei 2021, kami tidak lagi menampilkan pemilik yang belum mengajukan 13D/G dalam setahun terakhir. Sebelumnya, kami menampilkan riwayat lengkap pengajuan 13D/G. Secara umum, entitas yang diwajibkan untuk mengajukan pengajuan 13D/G harus mengajukan setidaknya setiap tahun sebelum mengirimkan pengajuan penutupan. Namun, terkadang dana keluar dari posisi tanpa mengirimkan pengajuan penutupan (misalnya, mereka menghentikan operasi), sehingga menampilkan riwayat lengkap terkadang menyebabkan kebingungan tentang kepemilikan saat ini. Untuk mencegah kebingungan, kami sekarang hanya menampilkan pemilik 'saat ini' - yaitu - pemilik yang telah mengajukan dalam setahun terakhir.
Upgrade to unlock premium data.
| Tanggal File | Formulir | Investor | Sebelumnya Saham |
Terbaru Saham |
Δ Saham (Persen) |
Kepemilikan (Persen) |
Δ Pagmamay-ari (Persen) |
|
|---|---|---|---|---|---|---|---|---|
| 2025-08-14 | TPG GP A, LLC | 21,438,949 | 0 | -100.00 | 0.00 | -100.00 | ||
| 2025-08-14 | CANADA PENSION PLAN INVESTMENT BOARD | 40,437,712 | 31,344,744 | -22.49 | 9.90 | -22.66 | ||
| 2025-07-07 | Capital Research Global Investors | 28,167,867 | 32,238,381 | 14.45 | 10.20 | 14.61 | ||
| 2025-02-14 | Select Equity Group, L.P. | 17,279,911 | 5.70 | |||||
| 2024-12-02 | Viking Capital Ltd | 227,571,340 | 236,304,740 | 3.84 | 53.60 | 1.71 |
Pengajuan 13F dan NPORT
Detail pada pengajuan 13F tersedia gratis. Detail pada pengajuan NP memerlukan keanggotaan premium. Baris berwarna hijau menunjukkan posisi baru. Baris berwarna merah menunjukkan posisi yang sudah ditutup. Klik tautan ini ikon untuk melihat riwayat transaksi selengkapnya.
Tingkatkan
untuk membuka data premium dan mengekspor ke Excel ![]() .
.
| Tanggal File | Sumber | Investor | Ketik | Presyo ng Avg (Silangan) |
Saham | Δ Saham (%) |
Dilaporkan Nilai ($1000) |
Nilai Δ (%) |
Alokasi Port (%) |
|
|---|---|---|---|---|---|---|---|---|---|---|
| 2025-07-07 | 13F | HMS Capital Management, LLC | 4,824 | 257 | ||||||
| 2025-05-13 | 13F | Seven Grand Managers, Llc | 0 | -100.00 | 0 | |||||
| 2025-08-14 | 13F | Ubs Asset Management Americas Inc | 123,138 | 6,562 | ||||||
| 2025-08-13 | 13F | Blueshift Asset Management, LLC | 0 | -100.00 | 0 | |||||
| 2025-07-14 | 13F | AdvisorNet Financial, Inc | 4 | -84.62 | 0 | -100.00 | ||||
| 2025-08-14 | 13F | Fund 1 Investments, LLC | 0 | -100.00 | 0 | |||||
| 2025-08-26 | NP | TMSL - T. Rowe Price Small-Mid Cap ETF | 32,930 | 18.27 | 1,755 | 58.59 | ||||
| 2025-08-01 | 13F | Teacher Retirement System Of Texas | 547,695 | -31.07 | 29,187 | -7.60 | ||||
| 2025-04-07 | 13F/A | Wealth High Governance Capital Ltda | 0 | -100.00 | 0 | |||||
| 2025-08-14 | 13F | Fortress Investment Group LLC | 0 | -100.00 | 0 | |||||
| 2025-08-15 | 13F | WealthCollab, LLC | 25 | 0.00 | 1 | |||||
| 2025-08-08 | 13F | New England Capital Financial Advisors LLC | 170 | 0.00 | 9 | 50.00 | ||||
| 2025-08-13 | 13F | OMERS ADMINISTRATION Corp | 15,500 | -37.50 | 826 | -16.24 | ||||
| 2025-08-14 | 13F | Utah Retirement Systems | 10,744 | 573 | ||||||
| 2025-08-04 | 13F | Spire Wealth Management | 14,805 | 789 | ||||||
| 2025-07-22 | 13F | Merit Financial Group, LLC | 19,379 | -0.77 | 1,033 | 32.99 | ||||
| 2025-05-15 | 13F | Federation des caisses Desjardins du Quebec | 0 | -100.00 | 0 | |||||
| 2025-08-05 | 13F | Versor Investments LP | 12,165 | 53.33 | 648 | 105.71 | ||||
| 2025-05-15 | 13F | Scientech Research LLC | 0 | -100.00 | 0 | |||||
| 2025-08-12 | 13F | Franklin Resources Inc | 1,015,800 | -58.82 | 54,132 | -44.80 | ||||
| 2025-07-16 | 13F | Brown, Lisle/cummings, Inc. | 500 | 0.00 | 27 | 36.84 | ||||
| 2025-07-22 | NP | DSMFX - Destinations Small-Mid Cap Equity Fund Class I | 18,302 | -47.91 | 817 | -51.66 | ||||
| 2025-05-29 | NP | MEFAX - MassMutual Select Mid Cap Growth Fund Class A | 492,769 | 0.65 | 19,588 | -9.19 | ||||
| 2025-08-14 | 13F | Treasurer of the State of North Carolina | 94,950 | 5 | ||||||
| 2025-08-14 | 13F | Sei Investments Co | 320,657 | -4.62 | 17,088 | 27.87 | ||||
| 2025-08-12 | 13F | Prudential Financial Inc | 5,690 | 303 | ||||||
| 2025-08-13 | 13F | Natixis Advisors, L.p. | 10,076 | 0.05 | 1 | |||||
| 2025-08-14 | 13F | Longaeva Partners L.P. | 336,233 | 10.70 | 17,918 | 48.42 | ||||
| 2025-07-30 | 13F | Pittenger & Anderson Inc | 500 | 27 | ||||||
| 2025-07-31 | 13F | Carnegie Capital Asset Management, LLC | 39,105 | 4.41 | 2,084 | 62.99 | ||||
| 2025-08-14 | 13F | UBS Group AG | Call | 0 | -100.00 | 0 | -100.00 | |||
| 2025-07-11 | 13F | Harbour Capital Advisors, LLC | 15,180 | -2.50 | 828 | 38.93 | ||||
| 2025-08-21 | NP | LIONX - Issachar Fund Class N Shares | 7,200 | 384 | ||||||
| 2025-08-14 | 13F | Point72 (DIFC) Ltd | 0 | -100.00 | 0 | |||||
| 2025-08-13 | 13F | Capula Management Ltd | 0 | -100.00 | 0 | |||||
| 2025-08-15 | 13F | Morgan Stanley | 1,692,363 | 8.58 | 90,186 | 45.57 | ||||
| 2025-08-05 | 13F | Simplex Trading, Llc | 0 | -100.00 | 0 | |||||
| 2025-08-13 | 13F | Twin Peaks Wealth Advisors, LLC | 2 | 0 | ||||||
| 2025-08-13 | 13F | Orvieto Partners, L.P. | 20,000 | 0.00 | 1,066 | 33.96 | ||||
| 2025-08-14 | 13F | Boothbay Fund Management, Llc | 215,423 | -10.55 | 11,480 | 19.91 | ||||
| 2025-08-14 | 13F | Quarry LP | 576 | 31 | ||||||
| 2025-08-13 | 13F | Northwestern Mutual Wealth Management Co | 0 | -100.00 | 0 | |||||
| 2025-08-14 | 13F | 140 Summer Partners LP | 946,337 | -7.91 | 50,430 | 23.46 | ||||
| 2025-07-21 | 13F | River Street Advisors LLC | 15,998 | 853 | ||||||
| 2025-08-29 | NP | JAFEX - Total Stock Market Index Trust NAV | 5,057 | 3.56 | 269 | 38.66 | ||||
| 2025-08-14 | 13F | Quantedge Capital Pte Ltd | 0 | -100.00 | 0 | |||||
| 2025-08-12 | 13F | Proequities, Inc. | 0 | 0 | ||||||
| 2025-06-30 | NP | AIM INTERNATIONAL MUTUAL FUNDS (INVESCO INTERNATIONAL MUTUAL FUNDS) - Invesco Oppenheimer Global Opportunities Fund Class R5 | 322,486 | 13,232 | ||||||
| 2025-08-05 | 13F | American Capital Advisory, LLC | 4 | -78.95 | 0 | |||||
| 2025-08-12 | 13F | Rhumbline Advisers | 216,845 | 3,277.65 | 11,556 | 4,431.37 | ||||
| 2025-08-04 | 13F | Simon Quick Advisors, Llc | 16,973 | -2.26 | 904 | 31.01 | ||||
| 2025-06-26 | NP | KCGIX - Knights of Columbus Large Cap Growth Fund I Shares | 41,316 | 1,695 | ||||||
| 2025-08-08 | 13F/A | Sterling Capital Management LLC | 308 | 16 | ||||||
| 2025-08-14 | 13F | UBS Group AG | 1,011,124 | -15.96 | 53,883 | 12.67 | ||||
| 2025-08-27 | NP | OHIO NATIONAL FUND INC - ON Janus Henderson Enterprise Portfolio | 6,913 | 11.50 | 368 | 49.59 | ||||
| 2025-07-23 | 13F | Maryland State Retirement & Pension System | 9,879 | 526 | ||||||
| 2025-08-14 | 13F | Headlands Technologies LLC | 7,325 | 390 | ||||||
| 2025-07-25 | 13F | Richardson Financial Services Inc. | 16 | 0.00 | 1 | |||||
| 2025-08-14 | 13F | Two Sigma Investments, Lp | 2,089,788 | -3.39 | 111,365 | 29.52 | ||||
| 2025-08-14 | 13F | FACT Capital, LP | 204,944 | 0.00 | 10,921 | 34.07 | ||||
| 2025-08-28 | NP | TIAA SEPARATE ACCOUNT VA 1 - Stock Index Account Teachers Personal Annuity Individual Deferred Variable Annuity | 4,441 | 237 | ||||||
| 2025-08-08 | 13F | Principal Financial Group Inc | 50,805 | 2,707 | ||||||
| 2025-04-30 | 13F | China Universal Asset Management Co., Ltd. | 0 | -100.00 | 0 | |||||
| 2025-08-13 | 13F | Invesco Ltd. | 10,577,113 | 400.30 | 563,654 | 570.71 | ||||
| 2025-07-09 | 13F | Radnor Capital Management, LLC | 28,430 | 6.96 | 2 | 0.00 | ||||
| 2025-08-12 | 13F | CIBC Private Wealth Group, LLC | 125 | -16.67 | 7 | 20.00 | ||||
| 2025-07-28 | 13F | Td Asset Management Inc | 953,410 | 36.00 | 50,807 | 82.33 | ||||
| 2025-07-02 | 13F | Central Pacific Bank - Trust Division | 11,887 | 2.36 | 633 | 37.31 | ||||
| 2025-07-22 | 13F | Knights of Columbus Asset Advisors LLC | 42,404 | 51.69 | 2,260 | 103.33 | ||||
| 2025-08-14 | 13F | Raymond James Financial Inc | 397,671 | -26.33 | 21,192 | -1.24 | ||||
| 2025-08-18 | 13F | Geneos Wealth Management Inc. | 300 | 0.00 | 16 | 36.36 | ||||
| 2025-05-05 | 13F | Lindbrook Capital, Llc | 0 | -100.00 | 0 | -100.00 | ||||
| 2025-08-12 | 13F | Picton Mahoney Asset Management | 7,096 | 0 | ||||||
| 2025-08-14 | 13F | Skye Global Management LP | 33,600 | 1,791 | ||||||
| 2025-08-05 | 13F | Key FInancial Inc | 200 | 0.00 | 11 | 42.86 | ||||
| 2025-07-24 | 13F | IFP Advisors, Inc | 50 | 0.00 | 3 | 100.00 | ||||
| 2025-08-13 | 13F | Colonial Trust Advisors | 73,615 | 19.60 | 3,923 | 60.34 | ||||
| 2025-05-29 | NP | PUTNAM VARIABLE TRUST - Putnam VT Research Fund Class IA Shares | 7,244 | 0.00 | 288 | -10.03 | ||||
| 2025-08-13 | 13F | State Board Of Administration Of Florida Retirement System | 11,315 | 603 | ||||||
| 2025-07-30 | NP | ONOF - Global X Adaptive U.S. Risk Management ETF This fund is a listed as child fund of Mirae Asset Global Investments Co., Ltd. and if that institution has disclosed ownership in this security, then these positions will not be double counted when calculating total shares and total value | 301 | 13 | ||||||
| 2025-08-12 | 13F | DnB Asset Management AS | 397,465 | -54.54 | 21,181 | -39.09 | ||||
| 2025-08-14 | 13F | Group One Trading, L.p. | 77 | -98.97 | 4 | -98.65 | ||||
| 2025-08-14 | 13F | Prelude Capital Management, Llc | 11,258 | -57.34 | 600 | -42.90 | ||||
| 2025-03-31 | NP | PNRAX - Putnam Research Fund Class A Shares | 41,659 | -18.30 | 2,109 | 5.40 | ||||
| 2025-08-14 | 13F | Discovery Capital Management, Llc / Ct | 100,000 | 5,329 | ||||||
| 2025-05-29 | NP | HCIGX - The Institutional Growth Equity Portfolio HC Strategic Shares | 0 | -100.00 | 0 | -100.00 | ||||
| 2025-05-30 | NP | WIGTX - Seven Canyons World Innovators Fund Institutional Class | 18,400 | 731 | ||||||
| 2025-08-14 | 13F | ThornTree Capital Partners LP | 785,860 | -18.06 | 41,878 | 9.85 | ||||
| 2025-08-14 | 13F | Mml Investors Services, Llc | 5,326 | 0 | ||||||
| 2025-08-11 | 13F | Greenland Capital Management LP | 0 | -100.00 | 0 | |||||
| 2025-08-13 | 13F | Federated Hermes, Inc. | 1,759,101 | 4.43 | 93,742 | 40.00 | ||||
| 2025-08-13 | 13F | ExodusPoint Capital Management, LP | 0 | -100.00 | 0 | |||||
| 2025-08-22 | NP | Columbia Funds Variable Series Trust II - Columbia Variable Portfolio - Mid Cap Growth Fund Class 3 | 107,953 | -1.08 | 5,753 | 32.63 | ||||
| 2025-07-24 | 13F | U S Global Investors Inc | 0 | -100.00 | 0 | |||||
| 2025-08-27 | 13F/A | Squarepoint Ops LLC | 0 | -100.00 | 0 | -100.00 | ||||
| 2025-08-15 | 13F | Blue Chip Partners, Inc. | 11,170 | 10.91 | 595 | 48.75 | ||||
| 2025-08-12 | 13F | Artisan Partners Limited Partnership | 2,198,739 | 2.07 | 117,171 | 36.83 | ||||
| 2025-08-13 | 13F | Raab & Moskowitz Asset Management LLC | 9,455 | 504 | ||||||
| 2025-08-19 | 13F | Campbell Capital Management Inc | 25,000 | 1,332 | ||||||
| 2025-07-31 | 13F | Cambridge Investment Research Advisors, Inc. | 7,805 | 48.55 | 0 | |||||
| 2025-08-08 | 13F | SG Americas Securities, LLC | 0 | -100.00 | 0 | |||||
| 2025-05-15 | 13F | Weiss Asset Management LP | 24,995 | 24.98 | 994 | 42.47 | ||||
| 2025-08-12 | 13F | American Century Companies Inc | 881,213 | 0.70 | 46,960 | 35.01 | ||||
| 2025-08-08 | 13F | Your Advocates Ltd., LLP | 100 | 0.00 | 5 | 66.67 | ||||
| 2025-05-29 | NP | JACFX - John Hancock Mid Cap Growth Fund Class NAV | 265,053 | -22.75 | 10,536 | -30.31 | ||||
| 2025-05-06 | 13F | MCF Advisors LLC | 0 | -100.00 | 0 | |||||
| 2025-08-13 | 13F | Capital Fund Management S.a. | 0 | -100.00 | 0 | |||||
| 2025-08-07 | 13F | Allworth Financial LP | 150 | -1.32 | 8 | 16.67 | ||||
| 2025-08-14 | 13F | Voya Investment Management Llc | 88,310 | 4,706 | ||||||
| 2025-07-14 | 13F | Westend Capital Management LLC | 279,771 | 3.25 | 14,909 | 38.42 | ||||
| 2025-08-11 | 13F | Monashee Investment Management LLC | 0 | -100.00 | 0 | |||||
| 2025-08-13 | 13F | Hsbc Holdings Plc | 57,526 | -17.76 | 3,077 | 12.92 | ||||
| 2025-08-26 | NP | WCFOX - WCM Focused International Opportunities Fund Investor Class Shares | 19,380 | -1.33 | 1,033 | 32.31 | ||||
| 2025-08-05 | 13F | Pier Capital, LLC | 90 | 0.00 | 5 | 33.33 | ||||
| 2025-08-12 | 13F | Catalyst Funds Management Pty Ltd | 0 | -100.00 | 0 | |||||
| 2025-08-12 | 13F | Coldstream Capital Management Inc | 0 | -100.00 | 0 | |||||
| 2025-07-24 | 13F | Costello Asset Management, INC | 964 | 14.63 | 51 | 54.55 | ||||
| 2025-08-06 | 13F | Nvwm, Llc | 13,169 | -39.23 | 702 | -18.58 | ||||
| 2025-08-18 | 13F/A | National Bank Of Canada /fi/ | 256,083 | 13,647 | ||||||
| 2025-08-14 | 13F | Riposte Capital Llc | 200,000 | 100.00 | 10,658 | 168.13 | ||||
| 2025-03-31 | NP | PCONX - PUTNAM CONVERTIBLE SECURITIES FUND Class C Shares | 54,280 | 0.00 | 2,748 | 29.01 | ||||
| 2025-08-14 | 13F | Ionic Capital Management LLC | 4,254 | -16.23 | 227 | 12.44 | ||||
| 2025-08-12 | 13F | Deutsche Bank Ag\ | 9,563 | 45.49 | 510 | 95.02 | ||||
| 2025-08-12 | 13F | Park Square Financial Group, LLC | 300 | 0.00 | 16 | 36.36 | ||||
| 2025-08-13 | 13F | Diametric Capital, LP | 18,275 | 124.62 | 974 | 201.24 | ||||
| 2025-07-31 | 13F | Briaud Financial Planning, Inc | 300 | 0 | ||||||
| 2025-08-14 | 13F | Man Group plc | 689,162 | 66.16 | 36,725 | 122.76 | ||||
| 2025-08-04 | 13F | Strs Ohio | 4,858 | 259 | ||||||
| 2025-08-14 | 13F | FIL Ltd | 109,719 | 5,847 | ||||||
| 2025-05-15 | 13F | Aqr Capital Management Llc | 0 | -100.00 | 0 | -100.00 | ||||
| 2025-05-30 | NP | MML SERIES INVESTMENT FUND - MML Mid Cap Growth Fund Initial Class | 33,902 | 8.90 | 1,348 | -1.75 | ||||
| 2025-08-14 | 13F | Daiwa Securities Group Inc. | 17,300 | 1 | ||||||
| 2025-05-12 | 13F | Pinpoint Asset Management Ltd | 14,993 | 596 | ||||||
| 2025-08-14 | 13F | Millennium Management Llc | 267,823 | -79.66 | 14,272 | -72.73 | ||||
| 2025-08-11 | 13F | VSM Wealth Advisory, LLC | 40 | 0.00 | 2 | 100.00 | ||||
| 2025-08-08 | 13F | Massachusetts Financial Services Co /ma/ | 4,501,814 | 69.35 | 239,902 | 127.04 | ||||
| 2025-08-14 | 13F | Lighthouse Investment Partners, LLC | 329,743 | 17,572 | ||||||
| 2025-08-06 | 13F | Golden State Wealth Management, LLC | 1,982 | 20.12 | 106 | 61.54 | ||||
| 2025-08-08 | 13F | Hartland & Co., LLC | 235 | -22.70 | 13 | 0.00 | ||||
| 2025-08-04 | 13F | GAM Holding AG | 224,801 | -31.04 | 11,980 | -7.56 | ||||
| 2025-07-25 | NP | CBSAX - Columbia Mid Cap Growth Fund Class A | 400,194 | -21.05 | 17,865 | -26.73 | ||||
| 2025-07-25 | 13F | Asset Planning,Inc | 6,135 | 0.00 | 327 | 34.16 | ||||
| 2025-08-14 | 13F | Tudor Investment Corp Et Al | 961,020 | 42.07 | 51,213 | 90.47 | ||||
| 2025-08-14 | 13F | Tudor Investment Corp Et Al | Call | 5,600 | 298 | |||||
| 2025-08-14 | 13F | Goldman Sachs Group Inc | 1,090,795 | -13.40 | 58,128 | 16.10 | ||||
| 2025-08-13 | 13F | Healthcare Of Ontario Pension Plan Trust Fund | 500,000 | -50.00 | 26,645 | -32.97 | ||||
| 2025-08-13 | 13F | Russell Investments Group, Ltd. | 321,627 | 13.50 | 17,128 | 52.05 | ||||
| 2025-08-14 | 13F | Tudor Investment Corp Et Al | Put | 5,900 | -25.32 | 314 | 0.00 | |||
| 2025-08-14 | 13F | Citadel Advisors Llc | 3,523,699 | 3.78 | 187,778 | 39.12 | ||||
| 2025-08-14 | 13F | Citadel Advisors Llc | Call | 30,400 | 216.67 | 1,620 | 325.20 | |||
| 2025-08-14 | 13F | Citadel Advisors Llc | Put | 77,100 | -15.92 | 4,109 | 12.70 | |||
| 2025-08-19 | 13F | Hohimer Wealth Management, Llc | 14,405 | 768 | ||||||
| 2025-08-27 | NP | Aim Variable Insurance Funds (invesco Variable Insurance Funds) - Invesco V.i. Global Core Equity Fund Series I | 14,876 | 793 | ||||||
| 2025-07-28 | 13F | BRYN MAWR TRUST Co | 8,028 | 11.22 | 428 | 49.30 | ||||
| 2025-08-14 | 13F | Point72 Asia (Singapore) Pte. Ltd. | 0 | -100.00 | 0 | |||||
| 2025-08-14 | 13F | Driehaus Capital Management Llc | 277,191 | 6.38 | 14,772 | 42.62 | ||||
| 2025-08-28 | NP | SLGFX - SIMT Large Cap Index Fund Class F | 4,100 | 218 | ||||||
| 2025-08-14 | 13F | Goldentree Asset Management Lp | 0 | -100.00 | 0 | |||||
| 2025-08-14 | 13F | Engineers Gate Manager LP | 95,041 | -57.37 | 5,065 | -42.86 | ||||
| 2025-08-13 | 13F | Arrowstreet Capital, Limited Partnership | 13,792 | -98.57 | 735 | -98.08 | ||||
| 2025-07-28 | 13F | Harbour Investments, Inc. | 1,277 | 0.00 | 68 | 36.00 | ||||
| 2025-08-06 | 13F | Harvest Portfolios Group Inc. | 28,920 | 9.19 | 1,541 | 46.48 | ||||
| 2025-08-14 | 13F | Money Concepts Capital Corp | 22,541 | -1.79 | 1,201 | 31.69 | ||||
| 2025-08-12 | 13F | Nuveen, LLC | 551,689 | 29,400 | ||||||
| 2025-08-14 | 13F | Wellington Management Group Llp | 114,685 | -94.88 | 6,112 | -93.14 | ||||
| 2025-08-08 | 13F | Pnc Financial Services Group, Inc. | 117 | 6 | ||||||
| 2025-05-09 | 13F | Levin Capital Strategies, L.p. | 0 | -100.00 | 0 | -100.00 | ||||
| 2025-08-13 | 13F | Walleye Trading LLC | Put | 30,800 | -14.92 | 1,641 | 14.12 | |||
| 2025-08-13 | 13F | Walleye Trading LLC | Call | 78,900 | 162.13 | 4,205 | 251.51 | |||
| 2025-05-14 | 13F | Natixis | 0 | -100.00 | 0 | -100.00 | ||||
| 2025-08-04 | 13F | Amalgamated Bank | 15,297 | 1 | ||||||
| 2025-07-31 | 13F | R Squared Ltd | 7,225 | 385 | ||||||
| 2025-08-14 | 13F | Kovitz Investment Group Partners, LLC | 210,494 | 4.97 | 11,217 | 40.72 | ||||
| 2025-08-14 | 13F | Thunderbird Partners Llp | 0 | -100.00 | 0 | |||||
| 2025-08-27 | NP | AIM VARIABLE INSURANCE FUNDS (INVESCO VARIABLE INSURANCE FUNDS) - Invesco Oppenheimer V.I. Discovery Mid Cap Growth Fund Series II | 203,662 | 0.00 | 10,853 | 34.07 | ||||
| 2025-08-14 | 13F | Point72 Asset Management, L.P. | 2,994,914 | 1,821.32 | 159,599 | 2,475.82 | ||||
| 2025-07-16 | 13F | Moisand Fitzgerald Tamayo, LLC | 182 | 0.00 | 10 | 28.57 | ||||
| 2025-07-31 | 13F | Caitong International Asset Management Co., Ltd | 118 | -91.88 | 6 | -89.47 | ||||
| 2025-08-14 | 13F | Hrt Financial Lp | 0 | -100.00 | 0 | |||||
| 2025-08-14 | 13F | Capstone Investment Advisors, Llc | 11,318 | -10.68 | 603 | 19.88 | ||||
| 2025-08-14 | 13F | Price T Rowe Associates Inc /md/ | 2,397,875 | 75.89 | 128 | 135.19 | ||||
| 2025-08-14 | 13F | Shellback Capital, LP | 0 | -100.00 | 0 | |||||
| 2025-08-04 | 13F | AdvisorShares Investments LLC | 2,178 | -45.55 | 116 | -27.95 | ||||
| 2025-08-01 | 13F | Y-Intercept (Hong Kong) Ltd | 0 | -100.00 | 0 | |||||
| 2025-08-14 | 13F | State Street Corp | 1,812,120 | 34,748.46 | 96,568 | 46,777.18 | ||||
| 2025-08-12 | 13F | Accredited Wealth Management, LLC | 100 | 0.00 | 5 | 66.67 | ||||
| 2025-08-12 | 13F | MAI Capital Management | 5 | 0.00 | 0 | |||||
| 2025-08-13 | 13F | Mackenzie Financial Corp | 7,990 | 426 | ||||||
| 2025-08-13 | 13F | Knollwood Investment Advisory, LLC | 20,037 | 0.00 | 1,068 | 34.05 | ||||
| 2025-08-14 | 13F | Sunbelt Securities, Inc. | 1,998 | 0.00 | 88 | 11.39 | ||||
| 2025-07-17 | 13F | Beacon Capital Management, LLC | 17 | -63.83 | 1 | -100.00 | ||||
| 2025-08-12 | 13F | XTX Topco Ltd | 0 | -100.00 | 0 | |||||
| 2025-08-13 | 13F | Quantbot Technologies LP | 116,609 | 71.43 | 6,214 | 129.89 | ||||
| 2025-07-21 | 13F | Old Second National Bank Of Aurora | 47,428 | 2,527 | ||||||
| 2025-08-21 | NP | MXHYX - Great-West High Yield Bond Fund Investor Class | 36,900 | 0.00 | 1,966 | 34.11 | ||||
| 2025-08-27 | NP | BBGSX - Bridge Builder Small/Mid Cap Growth Fund | 766,099 | 26.45 | 40,825 | 69.52 | ||||
| 2025-08-14 | 13F | Hook Mill Capital Partners, LP | 782,026 | 70.50 | 41,674 | 128.58 | ||||
| 2025-08-13 | 13F | Northern Trust Corp | 404,996 | 1,340.34 | 21,582 | 1,832.14 | ||||
| 2025-08-14 | 13F | Principia Wealth Advisory, LLC | 32 | 28.00 | 2 | 0.00 | ||||
| 2025-08-13 | 13F | Centiva Capital, LP | 0 | -100.00 | 0 | |||||
| 2025-08-14 | 13F | Royal Bank Of Canada | 581,683 | 973.08 | 30,997 | 1,338.38 | ||||
| 2025-08-01 | 13F | Bessemer Group Inc | 25,363 | -0.36 | 1 | 0.00 | ||||
| 2025-08-14 | 13F | Financial Network Wealth Advisors LLC | 100 | 0.00 | 5 | 66.67 | ||||
| 2025-07-14 | 13F | U.S. Capital Wealth Advisors, LLC | 19,260 | 0.00 | 1,026 | 34.12 | ||||
| 2025-08-13 | 13F | New York State Common Retirement Fund | 82,084 | 7,423.74 | 4 | |||||
| 2025-07-24 | 13F | Cascade Investment Group, Inc. | 8,225 | 0.00 | 438 | 34.36 | ||||
| 2025-07-16 | 13F | Signaturefd, Llc | 150 | 8 | ||||||
| 2025-08-11 | 13F | Crestwood Capital Management, L.P. | 391,522 | -8.21 | 20,864 | 23.06 | ||||
| 2025-07-23 | 13F | Vontobel Holding Ltd. | 9,443 | 0.00 | 503 | 34.13 | ||||
| 2025-08-13 | 13F | Amundi | 445,840 | -47.50 | 24,325 | -25.29 | ||||
| 2025-08-13 | 13F | Jones Financial Companies Lllp | 8,664 | 25.69 | 457 | 68.27 | ||||
| 2025-03-31 | NP | Putnam Funds Trust - Putnam Multi-cap Core Fund Class A | 485,273 | -4.41 | 24,569 | 23.30 | ||||
| 2025-05-07 | 13F/A | Symmetry Investments LP | 13,500 | 471 | ||||||
| 2025-08-11 | 13F | Vanguard Group Inc | 590,505 | 414.86 | 31,468 | 590.24 | ||||
| 2025-05-27 | NP | USLUX - Holmes Macro Trends Fund | 10,800 | -45.45 | 429 | -50.80 | ||||
| 2025-06-27 | NP | AAARX - Strategic Allocation: Aggressive Fund R Class This fund is a listed as child fund of American Century Companies Inc and if that institution has disclosed ownership in this security, then these positions will not be double counted when calculating total shares and total value | 5,765 | 0.00 | 237 | -18.90 | ||||
| 2025-08-14 | 13F | Winton Capital Group Ltd | 68,375 | 3,644 | ||||||
| 2025-05-15 | 13F | PharVision Advisers, LLC | 0 | -100.00 | 0 | -100.00 | ||||
| 2025-08-14 | 13F | California State Teachers Retirement System | 12,821 | 683 | ||||||
| 2025-07-16 | 13F | West Branch Capital LLC | 0 | -100.00 | 0 | |||||
| 2025-08-14 | 13F | Bnp Paribas Arbitrage, Sa | 459,758 | -35.13 | 24,501 | -13.04 | ||||
| 2025-08-13 | 13F | Teca Partners, LP | 468,209 | 24,951 | ||||||
| 2025-08-12 | 13F | BlackRock, Inc. | 5,159,986 | 1,311.00 | 274,976 | 1,791.68 | ||||
| 2025-08-13 | 13F | Colonial Trust Co / SC | 38,300 | 34.94 | 2,041 | 80.94 | ||||
| 2025-08-14 | 13F | KADENSA CAPITAL Ltd | 600,187 | 42.41 | 31,984 | 90.92 | ||||
| 2025-08-14 | 13F | Evercore Wealth Management, LLC | 1,678,470 | 6.00 | 89,446 | 42.11 | ||||
| 2025-08-14 | 13F/A | Barclays Plc | 126,289 | -6.02 | 7 | 20.00 | ||||
| 2025-06-27 | NP | TWSMX - Strategic Allocation: Moderate Fund Investor Class This fund is a listed as child fund of American Century Companies Inc and if that institution has disclosed ownership in this security, then these positions will not be double counted when calculating total shares and total value | 5,021 | 0.00 | 206 | -18.90 | ||||
| 2025-07-18 | 13F | Renaissance Capital LLC | 158,875 | 28.51 | 8,466 | 72.28 | ||||
| 2025-04-21 | 13F | Nelson, Van Denburg & Campbell Wealth Management Group, LLC | 0 | -100.00 | 0 | |||||
| 2025-09-04 | 13F/A | Advisor Group Holdings, Inc. | 32,144 | 62.37 | 1,713 | 117.81 | ||||
| 2025-08-14 | 13F | Xponance, Inc. | 28,593 | 1,524 | ||||||
| 2025-07-31 | 13F | CVA Family Office, LLC | 12 | 0.00 | 1 | |||||
| 2025-08-14 | 13F | Pentwater Capital Management LP | 0 | -100.00 | 0 | |||||
| 2025-08-13 | 13F | Walleye Capital LLC | 45,847 | 25.66 | 2,443 | 68.48 | ||||
| 2025-08-13 | 13F | Walleye Capital LLC | Put | 23,100 | -32.46 | 1,231 | -9.49 | |||
| 2025-08-13 | 13F | Walleye Capital LLC | Call | 17,700 | -60.93 | 943 | -47.61 | |||
| 2025-07-24 | 13F | Us Bancorp \de\ | 15,017 | 43.18 | 800 | 92.31 | ||||
| 2025-08-08 | 13F | Pinnbrook Capital Management Lp | 47,213 | 2,516 | ||||||
| 2025-08-14 | 13F | Stifel Financial Corp | 144,619 | 203.53 | 7,707 | 307.08 | ||||
| 2025-07-29 | 13F | Private Trust Co Na | 545 | 29 | ||||||
| 2025-08-07 | 13F | Lisanti Capital Growth, LLC | 33,320 | 0.00 | 1,776 | 34.06 | ||||
| 2025-05-13 | 13F | Quadrature Capital Ltd | 0 | -100.00 | 0 | -100.00 | ||||
| 2025-08-14 | 13F | Hilltop Holdings Inc. | 11,220 | 598 | ||||||
| 2025-08-14 | 13F | Sandia Investment Management LP | 5,000 | -50.00 | 266 | -33.00 | ||||
| 2025-08-14 | 13F | Graham Capital Management, L.P. | 42,603 | 55.64 | 2,270 | 108.64 | ||||
| 2025-06-26 | NP | KCXIX - Knights of Columbus U.S. All Cap Index Fund I Shares | 616 | 25 | ||||||
| 2025-08-27 | NP | ALLIANZ VARIABLE INSURANCE PRODUCTS TRUST - AZL Russell 1000 Growth Index Fund Class 2 | 4,161 | 222 | ||||||
| 2025-08-14 | 13F | Jane Street Group, Llc | Put | 12,600 | -28.41 | 671 | -4.01 | |||
| 2025-08-14 | 13F | Jane Street Group, Llc | 164,792 | 8,782 | ||||||
| 2025-04-25 | NP | PMSAX - Global Multi-Strategy Fund Class A | 959 | -23.03 | 46 | -19.30 | ||||
| 2025-08-11 | 13F | FSC Wealth Advisors, LLC | 110 | 0.00 | 6 | 25.00 | ||||
| 2025-08-14 | 13F | Jane Street Group, Llc | Call | 43,600 | 2,323 | |||||
| 2025-08-11 | 13F | Cornerstone Planning Group LLC | 7 | 0 | ||||||
| 2025-05-29 | NP | MMBUX - MassMutual Select T. Rowe Price Small and Mid Cap Blend Fund Class I | 8,802 | -62.86 | 350 | -66.57 | ||||
| 2025-08-14 | 13F | Susquehanna International Group, Llp | 0 | -100.00 | 0 | |||||
| 2025-08-26 | NP | GEIZX - Growth Equity Index Fund Investor | 2,274 | 121 | ||||||
| 2025-04-29 | NP | SCPAX - Siit Large Cap Disciplined Equity Fund - Class A | 0 | -100.00 | 0 | -100.00 | ||||
| 2025-07-15 | 13F | Public Employees Retirement System Of Ohio | 63,107 | 3,363 | ||||||
| 2025-04-29 | NP | SLCAX - Siit Large Cap Fund - Class A | 0 | -100.00 | 0 | -100.00 | ||||
| 2025-07-24 | 13F | Jfs Wealth Advisors, Llc | 400 | 21 | ||||||
| 2025-08-13 | 13F | Railway Pension Investments Ltd | 319,400 | 17,021 | ||||||
| 2025-07-25 | 13F | Cwm, Llc | 110 | 57.14 | 0 | |||||
| 2025-08-14 | 13F | Sculptor Capital LP | 1,518,000 | 10.24 | 80,894 | 47.79 | ||||
| 2025-07-18 | 13F | Truist Financial Corp | 4,035 | 215 | ||||||
| 2025-05-09 | 13F/A | Oversea-Chinese Banking CORP Ltd | 0 | -100.00 | 0 | -100.00 | ||||
| 2025-06-30 | NP | AIM INVESTMENT FUNDS (INVESCO INVESTMENT FUNDS) - Invesco Oppenheimer Discovery Mid Cap Growth Fund Class R6 | 1,376,810 | 3.53 | 56,491 | -16.10 | ||||
| 2025-05-15 | 13F | Twinbeech Capital Lp | 0 | -100.00 | 0 | -100.00 | ||||
| 2025-08-14 | 13F | Polymer Capital Management (HK) LTD | 5,152 | 275 | ||||||
| 2025-08-13 | 13F | Hbk Investments L P | 20,000 | 1,066 | ||||||
| 2025-08-13 | 13F | Norges Bank | 4,445,687 | 236,911 | ||||||
| 2025-05-30 | NP | RAYD - Rayliant Quantitative Developed Market Equity ETF | 3,924 | -83.35 | 156 | -85.07 | ||||
| 2025-08-14 | 13F | Qube Research & Technologies Ltd | 1,164,474 | -30.09 | 62,055 | -6.28 | ||||
| 2025-08-14 | 13F | Two Sigma Advisers, Lp | 2,612,800 | -14.21 | 139,236 | 15.02 | ||||
| 2025-08-14 | 13F | Quantessence Capital LLC | 0 | -100.00 | 0 | |||||
| 2025-08-14 | 13F | Diversify Wealth Management, Llc | 65,247 | 6.39 | 3,895 | 54.50 | ||||
| 2025-08-11 | 13F | Baldwin Investment Management, LLC | 26,505 | 0.19 | 1,412 | 34.35 | ||||
| 2025-07-22 | 13F | Gsa Capital Partners Llp | 8,733 | -31.14 | 0 | |||||
| 2025-07-24 | 13F | Stonebridge Financial Group, LLC | 0 | -100.00 | 0 | |||||
| 2025-08-14 | 13F | D1 Capital Partners L.P. | 1,150,443 | 61,307 | ||||||
| 2025-08-12 | 13F | LPL Financial LLC | 66,669 | 31.40 | 3,553 | 76.19 | ||||
| 2025-08-14 | 13F | Voloridge Investment Management, Llc | 883,018 | -25.70 | 47,056 | -0.39 | ||||
| 2025-05-12 | 13F | Entropy Technologies, LP | 0 | -100.00 | 0 | |||||
| 2025-08-13 | 13F | EverSource Wealth Advisors, LLC | 89 | -81.80 | 5 | -78.95 | ||||
| 2025-08-14 | 13F | Fmr Llc | 7,139,911 | 15.01 | 380,486 | 54.18 | ||||
| 2025-07-14 | 13F | GAMMA Investing LLC | 19 | 111.11 | 1 | |||||
| 2025-07-16 | 13F | Highline Wealth Partners Llc | 91 | 0.00 | 5 | 33.33 | ||||
| 2025-08-04 | 13F | Wealth Management Associates, Inc. | 4,690 | 250 | ||||||
| 2025-08-14 | 13F | T. Rowe Price Investment Management, Inc. | 12,609,091 | 42.83 | 672 | 91.71 | ||||
| 2025-08-14 | 13F | Mpwm Advisory Solutions, Llc | 200 | 0.00 | 11 | 42.86 | ||||
| 2025-07-08 | 13F | Parallel Advisors, LLC | 69,764 | 9.09 | 3,718 | 46.28 | ||||
| 2025-08-11 | 13F | Citigroup Inc | 33,263 | -70.41 | 1,773 | -60.34 | ||||
| 2025-03-31 | NP | PGEOX - GEORGE PUTNAM FUND OF BOSTON Class A Shares | 93,961 | -20.91 | 4,757 | 2.02 | ||||
| 2025-08-14 | 13F | Select Equity Group, L.P. | 17,880,920 | -4.16 | 952,874 | 28.49 | ||||
| 2025-06-26 | NP | SVBAX - Balanced Fund Class A | 630,773 | 54.81 | 25,881 | 25.45 | ||||
| 2025-06-27 | NP | TWHIX - Heritage Fund Investor Class This fund is a listed as child fund of American Century Companies Inc and if that institution has disclosed ownership in this security, then these positions will not be double counted when calculating total shares and total value | 744,076 | 0.00 | 30,529 | -18.96 | ||||
| 2025-08-08 | 13F | Westbourne Investment Advisors, Inc. | 3,765 | 201 | ||||||
| 2025-08-13 | 13F | Victory Capital Management Inc | 596,148 | 294.79 | 31,769 | 429.29 | ||||
| 2025-08-14 | 13F | Hood River Capital Management LLC | 234,828 | -2.96 | 12,514 | 30.09 | ||||
| 2025-08-14 | 13F | Wells Fargo & Company/mn | 98,929 | 7.18 | 5,272 | 43.66 | ||||
| 2025-07-31 | 13F | Oppenheimer & Co Inc | 7,197 | -6.50 | 384 | 25.57 | ||||
| 2025-08-27 | NP | BBGLX - Bridge Builder Large Cap Growth Fund | 19,673 | 1,048 | ||||||
| 2025-08-14 | 13F | Canada Pension Plan Investment Board | 31,344,744 | -22.49 | 1,670,361 | 3.92 | ||||
| 2025-08-13 | 13F | Capital Analysts, Inc. | 200 | 0 | ||||||
| 2025-08-15 | 13F | Captrust Financial Advisors | 48,800 | 10.10 | 2,601 | 47.64 | ||||
| 2025-08-27 | NP | AWSAX - INVESCO Global Core Equity Fund Class A | 119,714 | 6,380 | ||||||
| 2025-08-14 | 13F | Burkehill Global Management, LP | 400,000 | -46.67 | 21,316 | -28.50 | ||||
| 2025-07-22 | 13F | Chung Wu Investment Group, LLC | 7,100 | 1.43 | 378 | 35.97 | ||||
| 2025-08-08 | 13F | Police & Firemen's Retirement System of New Jersey | 30,706 | 1,636 | ||||||
| 2025-08-14 | 13F | Zimmer Partners, LP | 0 | -100.00 | 0 | |||||
| 2025-08-15 | 13F | Tower Research Capital LLC (TRC) | 2,219 | 79.97 | 118 | 140.82 | ||||
| 2025-08-12 | 13F | Charles Schwab Investment Management Inc | 150,160 | 165.27 | 8,002 | 255.64 | ||||
| 2025-08-13 | 13F | MetLife Investment Management, LLC | 12,638 | 673 | ||||||
| 2025-08-12 | 13F | Pathstone Holdings, LLC | 22,470 | -14.39 | 1,197 | 14.77 | ||||
| 2025-08-14 | 13F | Holocene Advisors, LP | 5,706,427 | 57.91 | 304,095 | 111.70 | ||||
| 2025-08-14 | 13F | Sciencast Management LP | 35,323 | 382.16 | 1,882 | 546.74 | ||||
| 2025-08-14 | 13F | Ameriprise Financial Inc | 510,592 | -0.30 | 27,209 | 33.67 | ||||
| 2025-08-15 | 13F | Morse Asset Management, Inc | 23,249 | 1,239 | ||||||
| 2025-04-29 | NP | PHYIX - PUTNAM HIGH YIELD FUND Class Y Shares | 71,600 | 0.00 | 3,444 | 3.55 | ||||
| 2025-07-29 | 13F | Empirical Asset Management, LLC | 8,880 | -2.20 | 473 | 31.39 | ||||
| 2025-08-08 | 13F | Gts Securities Llc | 0 | -100.00 | 0 | |||||
| 2025-08-08 | 13F | SBI Securities Co., Ltd. | 12 | -45.45 | 1 | |||||
| 2025-07-21 | 13F/A | Point72 Asset Management, L.P. | Call | 0 | -100.00 | 0 | -100.00 | |||
| 2025-08-04 | 13F | Keybank National Association/oh | 5,634 | -38.74 | 300 | -17.81 | ||||
| 2025-08-14 | 13F | GWM Advisors LLC | 1,540 | 6.94 | 82 | 43.86 | ||||
| 2025-08-18 | 13F | N.E.W. Advisory Services LLC | 500 | 0.00 | 27 | 36.84 | ||||
| 2025-07-25 | 13F | Allspring Global Investments Holdings, LLC | 1,094,169 | -6.41 | 59,096 | 24.84 | ||||
| 2025-08-08 | 13F | Vestcor Inc | 0 | -100.00 | 0 | |||||
| 2025-08-11 | 13F | Principal Securities, Inc. | 145 | 8 | ||||||
| 2025-05-29 | NP | PUTNAM VARIABLE TRUST - Putnam VT Sustainable Leaders Fund Class IA Shares | 184,900 | -14.87 | 7,350 | -23.20 | ||||
| 2025-08-21 | NP | MXMGX - Great-West T. Rowe Price Mid Cap Growth Fund Investor Class | 429,461 | 47.56 | 22,886 | 97.83 | ||||
| 2025-07-30 | 13F | Stephens Investment Management Group LLC | 608,493 | 32,427 | ||||||
| 2025-08-14 | 13F | Schonfeld Strategic Advisors LLC | 163,484 | 151.30 | 8,712 | 237.02 | ||||
| 2025-07-11 | 13F | Farther Finance Advisors, LLC | 2,250 | 4,400.00 | 120 | 5,850.00 | ||||
| 2025-08-14 | 13F | LMR Partners LLP | 105,000 | 5,595 | ||||||
| 2025-08-14 | 13F | D. E. Shaw & Co., Inc. | 257,562 | 13,725 | ||||||
| 2025-07-10 | 13F | Atticus Wealth Management, Llc | 10 | 1 | ||||||
| 2025-05-29 | NP | JAEVX - Mid Cap Stock Trust NAV | 131,423 | -18.85 | 5,224 | -26.78 | ||||
| 2025-08-13 | 13F | Renaissance Technologies Llc | 1,374,305 | -39.88 | 73,237 | -19.41 | ||||
| 2025-06-27 | NP | OOTO - Direxion Daily Travel & Vacation Bull 2X Shares | 814 | -37.38 | 33 | -49.23 | ||||
| 2025-05-14 | 13F | EntryPoint Capital, LLC | 0 | -100.00 | 0 | -100.00 | ||||
| 2025-08-12 | 13F | Legal & General Group Plc | 47,710 | 28.69 | 2,543 | 72.57 | ||||
| 2025-07-21 | 13F | Cromwell Holdings LLC | 17 | 1 | ||||||
| 2025-08-11 | 13F | TD Waterhouse Canada Inc. | 1,000 | 0.00 | 54 | 35.00 | ||||
| 2025-07-23 | 13F | Nbt Bank N A /ny | 75 | 0.00 | 4 | 50.00 | ||||
| 2025-08-13 | 13F | Cerity Partners LLC | 8,510 | -55.46 | 453 | -40.32 | ||||
| 2025-05-08 | 13F | Parkside Financial Bank & Trust | 0 | -100.00 | 0 | |||||
| 2025-07-31 | 13F | Optimum Investment Advisors | 427 | 0.00 | 23 | 37.50 | ||||
| 2025-08-14 | 13F | Manufacturers Life Insurance Company, The | 646,807 | -5.41 | 34,468 | 26.82 | ||||
| 2025-06-27 | NP | AACRX - Strategic Allocation: Conservative Fund R Class This fund is a listed as child fund of American Century Companies Inc and if that institution has disclosed ownership in this security, then these positions will not be double counted when calculating total shares and total value | 1,312 | 0.00 | 54 | -19.70 | ||||
| 2025-08-01 | 13F | Envestnet Asset Management Inc | 29,179 | 6.44 | 1,555 | 42.70 | ||||
| 2025-07-09 | 13F | Byrne Asset Management LLC | 120 | -20.00 | 6 | 20.00 | ||||
| 2025-08-12 | 13F | Jefferies Financial Group Inc. | 0 | -100.00 | 0 | |||||
| 2025-08-04 | 13F | Quaker Wealth Management, LLC | Put | 0 | -100.00 | 0 | ||||
| 2025-07-28 | NP | QGRO - American Century STOXX U.S. Quality Growth ETF This fund is a listed as child fund of American Century Companies Inc and if that institution has disclosed ownership in this security, then these positions will not be double counted when calculating total shares and total value | 55,879 | 2,494 | ||||||
| 2025-08-11 | 13F | Primecap Management Co/ca/ | 934,073 | 22.29 | 49,777 | 63.95 | ||||
| 2025-08-07 | 13F | Freemont Management S.A. | 50,000 | 2,664 | ||||||
| 2025-08-13 | 13F | Jump Financial, LLC | 73,892 | -53.99 | 3,938 | -38.33 | ||||
| 2025-08-25 | NP | PRINCIPAL VARIABLE CONTRACTS FUNDS INC - LargeCap Growth Account I Class 1 | 591 | 31 | ||||||
| 2025-08-06 | 13F | Commonwealth Equity Services, Llc | 8,824 | -10.97 | 0 | |||||
| 2025-08-11 | 13F | Westover Capital Advisors, LLC | 4,500 | 240 | ||||||
| 2025-08-14 | 13F | Tpg Gp A, Llc | 0 | -100.00 | 0 | -100.00 | ||||
| 2025-05-15 | 13F | Rakuten Investment Management, Inc. | 325 | 13 | ||||||
| 2025-08-14 | 13F | Steadfast Capital Management Lp | 972,635 | 1,338.81 | 51,832 | 1,828.95 | ||||
| 2025-08-14 | 13F | PDT Partners, LLC | 97,839 | -14.36 | 5,214 | 14.80 | ||||
| 2025-08-14 | 13F | Jain Global LLC | 0 | -100.00 | 0 | |||||
| 2025-08-14 | 13F | Forest Avenue Capital Management LP | 3,801,316 | 164.36 | 202,572 | 254.41 | ||||
| 2025-08-14 | 13F | Nebula Research & Development LLC | 30,257 | 274.98 | 1,612 | 403.75 | ||||
| 2025-08-06 | 13F | Tabor Asset Management, LP | 92,361 | 22.08 | 4,922 | 63.65 | ||||
| 2025-05-13 | 13F | M&G Plc | 0 | -100.00 | 0 | -100.00 | ||||
| 2025-08-13 | 13F | Walleye Trading LLC | 0 | -100.00 | 0 | -100.00 | ||||
| 2025-08-14 | 13F | Mane Global Capital Management Lp | 1,056,961 | 56,325 | ||||||
| 2025-08-14 | 13F | CIBC World Markets Inc. | 31,153 | 12.27 | 1,660 | 50.64 | ||||
| 2025-06-10 | 13F/A | Militia Capital Partners, LP | 0 | -100.00 | 0 | -100.00 | ||||
| 2025-08-18 | 13F | Wolverine Trading, Llc | Call | 30,200 | 36.04 | 1,592 | 82.36 | |||
| 2025-07-30 | 13F | FNY Investment Advisers, LLC | 133 | 0 | ||||||
| 2025-08-12 | 13F | Global Retirement Partners, LLC | 834 | 19.83 | 44 | 46.67 | ||||
| 2025-08-18 | 13F | Wolverine Trading, Llc | Put | 22,300 | 0.00 | 1,176 | 33.98 | |||
| 2025-08-14 | 13F | Verition Fund Management LLC | 192,346 | -43.28 | 10,250 | -23.96 | ||||
| 2025-07-24 | 13F | Acima Private Wealth, Llc | 100 | 0.00 | 5 | 66.67 | ||||
| 2025-08-05 | 13F | Bank of New York Mellon Corp | 292,676 | 1,063.49 | 15,597 | 1,461.16 | ||||
| 2025-08-11 | 13F | Bell Investment Advisors, Inc | 48 | -26.15 | 3 | 0.00 | ||||
| 2025-08-18 | 13F | Wolverine Trading, Llc | 0 | -100.00 | 0 | -100.00 | ||||
| 2025-08-14 | 13F | Blackstone Group Inc | 0 | -100.00 | 0 | |||||
| 2025-08-14 | 13F | Lazard Asset Management Llc | 22,787 | 1 | ||||||
| 2025-07-11 | 13F | Fruth Investment Management | 69,819 | -0.97 | 4 | 50.00 | ||||
| 2025-07-16 | 13F | American National Bank | 2,000 | 0.00 | 107 | 34.18 | ||||
| 2025-08-26 | NP | IWB - iShares Russell 1000 ETF | 146,806 | 7,823 | ||||||
| 2025-08-08 | 13F | Larson Financial Group LLC | 6,000 | 320 | ||||||
| 2025-08-08 | 13F | Geode Capital Management, Llc | 1,319,430 | 1,659.78 | 70,312 | 2,259.46 | ||||
| 2025-08-07 | 13F | Commerce Bank | 9,078 | 1.59 | 484 | 36.06 | ||||
| 2025-08-12 | 13F | Southeast Asset Advisors Inc. | 87,090 | 0.09 | 4,641 | 34.21 | ||||
| 2025-08-12 | 13F | Trexquant Investment LP | 81,245 | 4,330 | ||||||
| 2025-08-11 | 13F | Universal- Beteiligungs- und Servicegesellschaft mbH | 59,746 | 3,184 | ||||||
| 2025-08-14 | 13F | Anomaly Capital Management, LP | 0 | -100.00 | 0 | |||||
| 2025-04-15 | 13F | SJS Investment Consulting Inc. | 0 | -100.00 | 0 | -100.00 | ||||
| 2025-08-07 | 13F | Acadian Asset Management Llc | 111,812 | 762.88 | 6 | |||||
| 2025-07-31 | 13F | Fedenia Advisers LLC | 5,355 | 285 | ||||||
| 2025-08-14 | 13F | Balyasny Asset Management Llc | 838,905 | 7.59 | 44,705 | 44.24 | ||||
| 2025-07-31 | 13F | Orion Capital Management LLC | 2,005 | 0.00 | 107 | 34.18 | ||||
| 2025-08-14 | 13F | MIRAE ASSET GLOBAL ETFS HOLDINGS Ltd. | 995 | 53 | ||||||
| 2025-08-26 | NP | DSMDX - Driehaus Small/Mid Cap Growth Fund | 6,813 | 5.99 | 363 | 42.35 | ||||
| 2025-08-14 | 13F | Susquehanna International Group, Llp | Call | 131,900 | 1.38 | 7,029 | 35.91 | |||
| 2025-08-27 | NP | BBTSX - Bridge Builder Tax Managed Small/Mid Cap Fund | 121,234 | 0.00 | 6,461 | 34.05 | ||||
| 2025-08-14 | 13F | Susquehanna International Group, Llp | Put | 67,000 | 39.87 | 3,570 | 87.50 | |||
| 2025-08-05 | 13F | Huntington National Bank | 21 | 1 | ||||||
| 2025-05-29 | NP | PUTNAM VARIABLE TRUST - Putnam VT Multi-Cap Core Fund Class IA Shares | 15,473 | -2.32 | 615 | -11.76 | ||||
| 2025-08-12 | 13F | Manchester Capital Management LLC | 6 | 0 | ||||||
| 2025-06-23 | NP | IYY - iShares Dow Jones U.S. ETF | 3,862 | 1.90 | 158 | -17.28 | ||||
| 2025-05-15 | 13F | Maplelane Capital, Llc | Call | 0 | -100.00 | 0 | -100.00 | |||
| 2025-08-08 | 13F | Cetera Investment Advisers | 6,562 | -6.46 | 350 | 25.54 | ||||
| 2025-07-29 | 13F | Tradewinds Capital Management, LLC | 5 | 0 | ||||||
| 2025-08-14 | 13F | Bank Of America Corp /de/ | 1,404,278 | 27.36 | 74,834 | 70.73 | ||||
| 2025-05-05 | 13F | Del-Sette Capital Management, LLC | 0 | -100.00 | 0 | -100.00 | ||||
| 2025-04-29 | NP | Putnam ETF Trust - Putnam Sustainable Leaders ETF - | 137,633 | -35.79 | 6,620 | -33.51 | ||||
| 2025-08-12 | 13F | Magnetar Financial LLC | 6,454 | 344 | ||||||
| 2025-08-14 | 13F | GCM Grosvenor Holdings, LLC | 300,042 | -8.61 | 15,989 | 22.52 | ||||
| 2025-08-26 | NP | IWF - iShares Russell 1000 Growth ETF | 768,707 | 40,964 | ||||||
| 2025-08-14 | 13F | Soros Fund Management Llc | 0 | -100.00 | 0 | |||||
| 2025-08-19 | 13F | State of Wyoming | 1 | -99.98 | 0 | -100.00 | ||||
| 2025-08-11 | 13F | Qsemble Capital Management, LP | 61,090 | 136.57 | 3,255 | 217.25 | ||||
| 2025-08-12 | 13F | Ci Investments Inc. | 360 | -16.28 | 0 | |||||
| 2025-06-30 | NP | AIM INVESTMENT FUNDS (INVESCO INVESTMENT FUNDS) - Invesco Oppenheimer Global Allocation Fund Class R | 10,813 | 0.00 | 444 | -19.01 | ||||
| 2025-05-29 | NP | PUTNAM VARIABLE TRUST - Putnam VT High Yield Fund Class IA Shares | 11,800 | 0.00 | 469 | -9.63 | ||||
| 2025-07-31 | 13F | Acuitas Investments, LLC | 0 | -100.00 | 0 | |||||
| 2025-08-12 | 13F | Cumberland Partners Ltd | 37,500 | 1,998 | ||||||
| 2025-08-14 | 13F | Hudson Bay Capital Management LP | 0 | -100.00 | 0 | |||||
| 2025-05-15 | 13F | Integrated Wealth Concepts LLC | 0 | -100.00 | 0 | -100.00 | ||||
| 2025-07-14 | 13F | Hoey Investments, Inc | 100 | 5 | ||||||
| 2025-08-13 | 13F | Marshall Wace, Llp | 386,197 | 2,325.86 | 20,580 | 3,156.33 | ||||
| 2025-08-12 | 13F | Jpmorgan Chase & Co | 1,467,311 | 74.61 | 78,193 | 134.09 | ||||
| 2025-07-18 | 13F | Bartlett & Co. Wealth Management Llc | 200 | 0.00 | 11 | 42.86 | ||||
| 2025-08-14 | 13F | Interval Partners, LP | 453,319 | 24,157 | ||||||
| 2025-08-14 | 13F | J. Goldman & Co LP | 66,202 | 14.59 | 3,528 | 53.61 | ||||
| 2025-08-14 | 13F | CIBC Asset Management Inc | 9,452 | 0.00 | 504 | 34.13 | ||||
| 2025-07-29 | 13F | Wcm Investment Management, Llc | 121,049 | 0.04 | 6,382 | 34.05 | ||||
| 2025-06-26 | NP | USMIX - Extended Market Index Fund | 20,310 | 3.81 | 833 | -15.86 | ||||
| 2025-08-14 | 13F | Alliancebernstein L.p. | 1,307,779 | 0.76 | 69,692 | 35.09 | ||||
| 2025-08-14 | 13F | Adage Capital Partners Gp, L.l.c. | 228,000 | 12,150 | ||||||
| 2025-08-14 | 13F | Cubist Systematic Strategies, LLC | 55,460 | -78.68 | 2,955 | -71.42 | ||||
| 2025-08-14 | 13F | Ghisallo Capital Management LLC | 250,000 | 0.00 | 13,322 | 34.06 | ||||
| 2025-05-15 | 13F | Maplelane Capital, Llc | 0 | -100.00 | 0 | -100.00 | ||||
| 2025-08-26 | NP | TLSTX - Stock Index Fund | 2,538 | 135 | ||||||
| 2025-08-12 | 13F | Steward Partners Investment Advisory, Llc | 199 | 7.57 | 11 | 42.86 | ||||
| 2025-08-13 | 13F | Capital Research Global Investors | 32,238,381 | 14.45 | 1,717,967 | 53.44 | ||||
| 2025-05-13 | 13F | Arrowpoint Investment Partners (Singapore) Pte. Ltd. | Put | 0 | -100.00 | 0 | -100.00 | |||
| 2025-07-31 | 13F | Sumitomo Mitsui Trust Holdings, Inc. | 44,847 | 14.41 | 2,390 | 53.34 | ||||
| 2025-05-13 | 13F | Arrowpoint Investment Partners (Singapore) Pte. Ltd. | 0 | -100.00 | 0 | -100.00 | ||||
| 2025-05-15 | 13F | Alyeska Investment Group, L.P. | 0 | -100.00 | 0 | |||||
| 2025-08-04 | 13F | Pinnacle Associates Ltd | 3,850 | 205 | ||||||
| 2025-05-13 | 13F | Arrowpoint Investment Partners (Singapore) Pte. Ltd. | Call | 0 | -100.00 | 0 | -100.00 | |||
| 2025-08-14 | 13F | Freestone Grove Partners LP | 361,720 | -18.76 | 19,276 | 8.92 | ||||
| 2025-08-28 | NP | GFLW - VictoryShares Free Cash Flow Growth ETF | 116,303 | -11.01 | 6,198 | 19.29 |