Mga Batayang Estadistika
| Saham Institusional (Jangka Panjang) | 102,828,750 - 62.45% (ex 13D/G) - change of 8.60MM shares 9.13% MRQ |
| Nilai Institusional (Jangka Panjang) | $ 1,155,677 USD ($1000) |
Kepemilikan Institusional dan Pemegang Saham
DLocal Limited (US:DLO) memiliki 151 pemilik institusional dan pemegang saham yang telah mengajukan formulir 13D/G atau 13F kepada Komisi Bursa Efek (Securities Exchange Commission/SEC). Lembaga-lembaga ini memegang total 102,828,750 saham. Pemegang saham terbesar meliputi General Atlantic Llc, Bank Of America Corp /de/, Ribbit Management Company, LLC, Baillie Gifford & Co, Marshall Wace, Llp, Jane Street Group, Llc, Jane Street Group, Llc, Fourth Sail Capital LP, Jane Street Group, Llc, and Morgan Stanley .
Struktur kepemilikan institusional DLocal Limited (NasdaqGS:DLO) menunjukkan posisi terkini di perusahaan oleh institusi dan dana, serta perubahan terbaru dalam ukuran posisi. Pemegang saham utama dapat mencakup investor individu, reksa dana, dana lindung nilai, atau institusi. Jadwal 13D menunjukkan bahwa investor memegang (atau pernah memegang) lebih dari 5% saham perusahaan dan bermaksud (atau pernah bermaksud) untuk secara aktif mengejar perubahan strategi bisnis. Jadwal 13G menunjukkan investasi pasif lebih dari 5%.
The share price as of September 5, 2025 is 13.42 / share. Previously, on September 9, 2024, the share price was 8.30 / share. This represents an increase of 61.69% over that period.

Skor Sentimen Dana
Skor Sentimen Dana (sebelumnya dikenal sebagai Skor Akumulasi Kepemilikan) menemukan saham-saham yang paling banyak dibeli oleh dana. Ini adalah hasil dari model kuantitatif multi-faktor yang canggih yang mengidentifikasi perusahaan dengan tingkat akumulasi institusional tertinggi. Model penilaian menggunakan kombinasi dari total peningkatan pemilik yang diungkapkan, perubahan dalam alokasi portofolio pada pemilik tersebut, dan metrik lainnya. Angka berkisar dari 0 hingga 100, dengan angka yang lebih tinggi menunjukkan tingkat akumulasi yang lebih tinggi dibandingkan dengan perusahaan sejenisnya, dan 50 adalah rata-ratanya.
Frekuensi Pembaruan: Setiap Hari
Lihat Ownership Explorer, yang menyediakan daftar perusahaan dengan peringkat tertinggi.
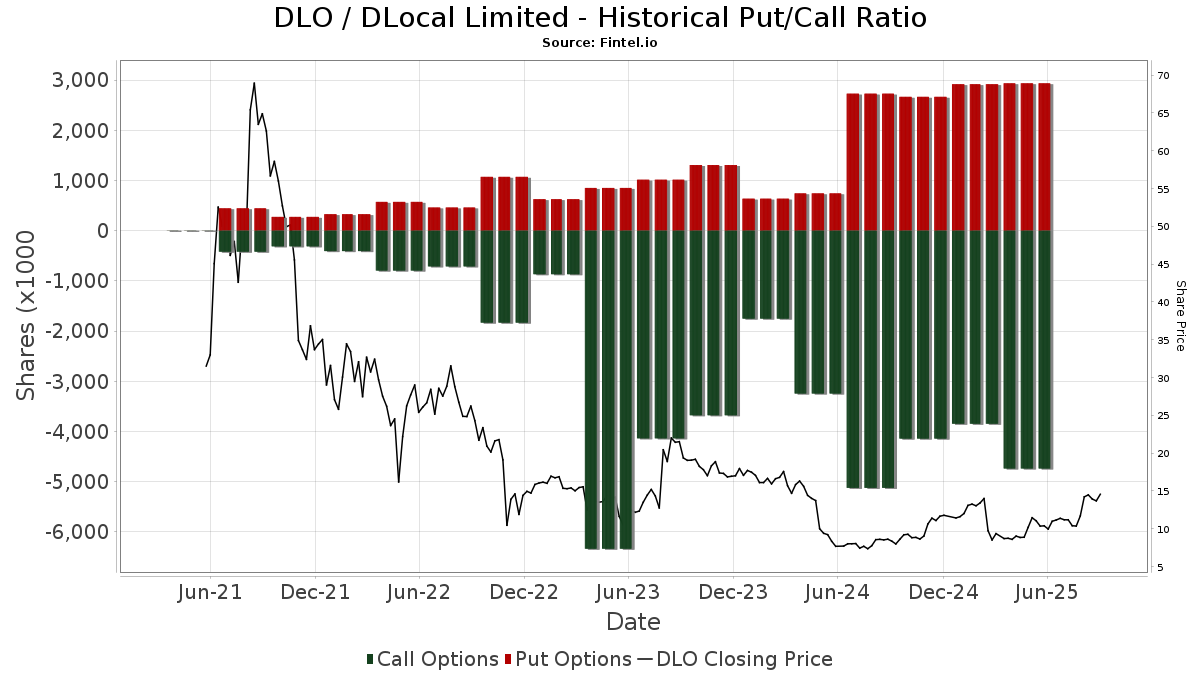
Rasio Put/Call Institusional
Selain melaporkan isu ekuitas dan utang standar, institusi dengan aset di bawah manajemen lebih dari 100 juta dolar AS juga harus mengungkapkan kepemilikan opsi put dan call mereka. Karena opsi put umumnya menunjukkan sentimen negatif, dan opsi call menunjukkan sentimen positif, kita dapat mengetahui sentimen institusional secara keseluruhan dengan memplot rasio put terhadap call. Grafik di sebelah kanan memplot rasio put/call historis untuk instrumen ini.
Menggunakan Rasio Put/Call sebagai indikator sentimen investor mengatasi salah satu kekurangan utama dari penggunaan total kepemilikan institusional, yaitu sejumlah besar aset yang dikelola diinvestasikan secara pasif untuk melacak indeks. Dana yang dikelola secara pasif biasanya tidak membeli opsi, sehingga indikator rasio put/call lebih akurat dalam melacak sentimen dana yang dikelola secara aktif.
Pengajuan 13D/G
Kami menyajikan pengajuan 13D/G secara terpisah dari pengajuan 13F karena perlakuan yang berbeda oleh SEC. Pengajuan 13D/G dapat diajukan oleh kelompok investor (dengan satu pemimpin), sedangkan pengajuan 13F tidak bisa. Hal ini mengakibatkan situasi di mana seorang investor dapat mengajukan 13D/G yang melaporkan satu nilai untuk total saham (mewakili semua saham yang dimiliki oleh kelompok investor), tetapi kemudian mengajukan 13F yang melaporkan nilai yang berbeda untuk total saham (mewakili kepemilikan mereka sendiri). Ini berarti bahwa kepemilikan saham dari pengajuan 13D/G dan pengajuan 13F seringkali tidak dapat dibandingkan secara langsung, sehingga kami menyajikannya secara terpisah.
Catatan: Mulai 16 Mei 2021, kami tidak lagi menampilkan pemilik yang belum mengajukan 13D/G dalam setahun terakhir. Sebelumnya, kami menampilkan riwayat lengkap pengajuan 13D/G. Secara umum, entitas yang diwajibkan untuk mengajukan pengajuan 13D/G harus mengajukan setidaknya setiap tahun sebelum mengirimkan pengajuan penutupan. Namun, terkadang dana keluar dari posisi tanpa mengirimkan pengajuan penutupan (misalnya, mereka menghentikan operasi), sehingga menampilkan riwayat lengkap terkadang menyebabkan kebingungan tentang kepemilikan saat ini. Untuk mencegah kebingungan, kami sekarang hanya menampilkan pemilik 'saat ini' - yaitu - pemilik yang telah mengajukan dalam setahun terakhir.
Upgrade to unlock premium data.
| Tanggal File | Formulir | Investor | Sebelumnya Saham |
Terbaru Saham |
Δ Saham (Persen) |
Kepemilikan (Persen) |
Δ Pagmamay-ari (Persen) |
|
|---|---|---|---|---|---|---|---|---|
| 2025-02-14 | Fogel Kaplan Sergio Enrique | 50,893,599 | 50,893,599 | 0.00 | 25.40 | 4.96 | ||
| 2025-02-14 | Fernandez Balague Emiliano Sebastian | 14,603,576 | 16,346,624 | 11.94 | 10.80 | 20.00 | ||
| 2024-11-12 | FMR LLC | 9,542,170 | 95,435 | -99.00 | 0.06 | -99.05 |
Pengajuan 13F dan NPORT
Detail pada pengajuan 13F tersedia gratis. Detail pada pengajuan NP memerlukan keanggotaan premium. Baris berwarna hijau menunjukkan posisi baru. Baris berwarna merah menunjukkan posisi yang sudah ditutup. Klik tautan ini ikon untuk melihat riwayat transaksi selengkapnya.
Tingkatkan
untuk membuka data premium dan mengekspor ke Excel ![]() .
.
| Tanggal File | Sumber | Investor | Ketik | Presyo ng Avg (Silangan) |
Saham | Δ Saham (%) |
Dilaporkan Nilai ($1000) |
Nilai Δ (%) |
Alokasi Port (%) |
|
|---|---|---|---|---|---|---|---|---|---|---|
| 2025-08-07 | 13F | Mitsubishi UFJ Kokusai Asset Management Co., Ltd. | 23,956 | 1.26 | 272 | 37.56 | ||||
| 2025-08-14 | 13F | Bnp Paribas Arbitrage, Sa | 394,793 | 9.71 | 4,477 | 49.15 | ||||
| 2025-08-14 | 13F | Verition Fund Management LLC | 47,871 | 42.19 | 543 | 93.57 | ||||
| 2025-05-15 | 13F | Barclays Plc | 0 | -100.00 | 0 | |||||
| 2025-08-12 | 13F | Legal & General Group Plc | 18,317 | -7.21 | 208 | 26.22 | ||||
| 2025-08-13 | 13F | National Bank Of Canada /fi/ | 0 | -100.00 | 0 | |||||
| 2025-05-15 | 13F | Alliancebernstein L.p. | 0 | -100.00 | 0 | |||||
| 2025-08-13 | 13F | EverSource Wealth Advisors, LLC | 0 | -100.00 | 0 | |||||
| 2025-08-12 | 13F | Jefferies Financial Group Inc. | 137,691 | 1,561 | ||||||
| 2025-05-15 | 13F | Mirabella Financial Services Llp | 0 | -100.00 | 0 | |||||
| 2025-08-12 | 13F | Insigneo Advisory Services, Llc | 16,011 | 182 | ||||||
| 2025-08-14 | 13F | Holocene Advisors, LP | 491,680 | -11.73 | 5,576 | 20.02 | ||||
| 2025-08-14 | 13F | Fieldview Capital Management, LLC | 17,108 | 194 | ||||||
| 2025-08-11 | 13F | Citigroup Inc | 4,315 | 4.43 | 49 | 41.18 | ||||
| 2025-08-18 | 13F | Wolverine Trading, Llc | Call | 136,700 | 1,569 | |||||
| 2025-08-18 | 13F | Wolverine Trading, Llc | Put | 17,100 | 196 | |||||
| 2025-08-18 | 13F | Wolverine Trading, Llc | 17,783 | 204 | ||||||
| 2025-07-09 | 13F | Northwest & Ethical Investments L.P. | 0 | -100.00 | 0 | -100.00 | ||||
| 2025-08-08 | 13F | Geode Capital Management, Llc | 142,677 | 0.80 | 1,618 | 37.03 | ||||
| 2025-08-14 | 13F | Goldman Sachs Group Inc | 378,090 | -34.26 | 4,288 | -10.61 | ||||
| 2025-08-26 | NP | NORTHERN FUNDS - NORTHERN SMALL CAP CORE FUND Class K | 36,430 | -5.58 | 413 | 28.66 | ||||
| 2025-08-14 | 13F | Boothbay Fund Management, Llc | 10,768 | 122 | ||||||
| 2025-08-15 | 13F | Tower Research Capital LLC (TRC) | 3,228 | 225.08 | 37 | 350.00 | ||||
| 2025-08-14 | 13F | Peak6 Llc | Put | 107,500 | 0.00 | 1,219 | 36.05 | |||
| 2025-08-14 | 13F | Peak6 Llc | Call | 332,600 | 2.84 | 3,772 | 39.82 | |||
| 2025-07-24 | NP | ONEQ - Fidelity Nasdaq Composite Index Tracking Stock This fund is a listed as child fund of Fmr Llc and if that institution has disclosed ownership in this security, then these positions will not be double counted when calculating total shares and total value | 57,194 | 0.49 | 621 | 14.36 | ||||
| 2025-08-14 | 13F | Millennium Management Llc | Put | 0 | -100.00 | 0 | ||||
| 2025-08-14 | 13F | Axa S.a. | 82,270 | 933 | ||||||
| 2025-08-14 | 13F | Alkeon Capital Management Llc | 823,837 | 0.00 | 9,342 | 35.98 | ||||
| 2025-05-14 | 13F | Walleye Trading LLC | 0 | -100.00 | 0 | -100.00 | ||||
| 2025-08-28 | NP | KEMQ - KraneShares Emerging Markets Consumer Technology Index ETF | 17,145 | -10.47 | 194 | 22.01 | ||||
| 2025-08-19 | 13F | State of Wyoming | 27,116 | 45.12 | 307 | 98.06 | ||||
| 2025-08-14 | 13F | Bayesian Capital Management, LP | 25,106 | 285 | ||||||
| 2025-07-30 | 13F | FNY Investment Advisers, LLC | 936 | 0 | ||||||
| 2025-09-04 | 13F/A | Advisor Group Holdings, Inc. | 9,108 | 17.08 | 103 | 60.94 | ||||
| 2025-07-31 | 13F | R Squared Ltd | 11,176 | 127 | ||||||
| 2025-08-14 | 13F | Vident Advisory, LLC | 24,195 | 48.71 | 274 | 102.96 | ||||
| 2025-08-11 | 13F | Empowered Funds, LLC | 0 | -100.00 | 0 | |||||
| 2025-05-13 | 13F | Marcho Partners LLP | 0 | -100.00 | 0 | |||||
| 2025-08-28 | NP | GHTA - Goose Hollow Tactical Allocation ETF | 64,964 | 737 | ||||||
| 2025-05-13 | 13F | Marcho Partners LLP | Call | 0 | -100.00 | 0 | ||||
| 2025-08-04 | 13F | Yorktown Management & Research Co Inc | 41,500 | 0.00 | 471 | 35.84 | ||||
| 2025-08-14 | 13F | Fmr Llc | 0 | -100.00 | 0 | |||||
| 2025-08-14 | 13F | Two Sigma Advisers, Lp | 353,107 | -50.06 | 4,004 | -32.10 | ||||
| 2025-07-29 | 13F | Activest Wealth Management | 7,067 | 80 | ||||||
| 2025-05-05 | 13F | Migdal Insurance & Financial Holdings Ltd. | 0 | -100.00 | 0 | |||||
| 2025-08-14 | 13F | Millennium Management Llc | Call | 0 | -100.00 | 0 | ||||
| 2025-08-14 | 13F | Ameriprise Financial Inc | 563,990 | 6.88 | 6,396 | 45.34 | ||||
| 2025-08-01 | 13F | Lane Generational LLC | 525,530 | 0.00 | 5,960 | 35.99 | ||||
| 2025-08-13 | 13F | PharVision Advisers, LLC | 20,984 | 238 | ||||||
| 2025-08-14 | 13F | Millennium Management Llc | 866,818 | 53.98 | 9,830 | 109.39 | ||||
| 2025-08-14 | 13F | Hrt Financial Lp | 314,265 | 237.23 | 4 | |||||
| 2025-05-14 | 13F | Stifel Financial Corp | 0 | -100.00 | 0 | |||||
| 2025-08-14 | 13F/A | Skopos Labs, Inc. | 836 | 9 | ||||||
| 2025-08-14 | 13F | Voloridge Investment Management, Llc | 45,553 | -84.67 | 517 | -79.18 | ||||
| 2025-05-29 | NP | MFMIX - Frontier Markets Portfolio Class I | 0 | -100.00 | 0 | -100.00 | ||||
| 2025-08-12 | 13F | Clear Street Markets Llc | 0 | -100.00 | 0 | |||||
| 2025-08-14 | 13F | PDT Partners, LLC | 332,739 | -1.03 | 3,773 | 34.61 | ||||
| 2025-08-12 | 13F | Jpmorgan Chase & Co | 12,180 | -87.50 | 138 | -83.00 | ||||
| 2025-08-12 | 13F | Main Management ETF Advisors, LLC | 146,579 | 1.66 | 2 | 0.00 | ||||
| 2025-08-14 | 13F | Caption Management, LLC | 131,249 | 1,066.76 | 1,488 | 1,500.00 | ||||
| 2025-07-31 | 13F | Caitong International Asset Management Co., Ltd | 736 | 65.39 | 8 | 166.67 | ||||
| 2025-08-12 | 13F | Deutsche Bank Ag\ | 0 | -100.00 | 0 | |||||
| 2025-08-13 | 13F | Polen Capital Management Llc | 605,885 | -3.45 | 6,871 | 31.28 | ||||
| 2025-05-06 | 13F | Y-Intercept (Hong Kong) Ltd | 0 | -100.00 | 0 | |||||
| 2025-08-14 | 13F | Wells Fargo & Company/mn | 2,455 | 439.56 | 28 | 800.00 | ||||
| 2025-07-25 | 13F | Gw Henssler & Associates Ltd | 15,873 | 0.00 | 180 | 36.36 | ||||
| 2025-08-15 | 13F | Morgan Stanley | 1,121,067 | 2.64 | 12,713 | 39.57 | ||||
| 2025-06-25 | NP | BKSE - BNY Mellon US Small Cap Core Equity ETF | 3,377 | -27.66 | 30 | -52.46 | ||||
| 2025-08-27 | NP | PCEM - Polen Capital Emerging Markets ex-China Growth ETF | 8,738 | 0.00 | 99 | 37.50 | ||||
| 2025-06-27 | NP | PNQI - Invesco NASDAQ Internet ETF This fund is a listed as child fund of Invesco Ltd. and if that institution has disclosed ownership in this security, then these positions will not be double counted when calculating total shares and total value | 32,880 | -7.88 | 291 | -38.43 | ||||
| 2025-08-07 | 13F | Fourth Sail Capital LP | 1,546,639 | 33.75 | 17,539 | 81.85 | ||||
| 2025-07-25 | 13F | Cwm, Llc | 10,000 | 0 | ||||||
| 2025-08-13 | 13F | Corsair Capital Management, L.p. | 30,000 | 340 | ||||||
| 2025-08-14 | 13F | Sunbelt Securities, Inc. | 0 | -100.00 | 0 | |||||
| 2025-08-14 | 13F | SummitTX Capital, L.P. | 0 | -100.00 | 0 | |||||
| 2025-07-24 | NP | FNCMX - Fidelity Nasdaq Composite Index Fund This fund is a listed as child fund of Fmr Llc and if that institution has disclosed ownership in this security, then these positions will not be double counted when calculating total shares and total value | 85,025 | 0.00 | 923 | 13.67 | ||||
| 2025-08-28 | NP | KOMP - SPDR S&P Kensho New Economies Composite ETF This fund is a listed as child fund of State Street Corp and if that institution has disclosed ownership in this security, then these positions will not be double counted when calculating total shares and total value | 169,663 | -68.90 | 1,924 | -57.73 | ||||
| 2025-08-12 | 13F | Proequities, Inc. | 0 | 0 | ||||||
| 2025-05-15 | 13F/A | Clear Street Llc | Put | 0 | -100.00 | 0 | -100.00 | |||
| 2025-08-08 | 13F | Pnc Financial Services Group, Inc. | 15 | -75.41 | 0 | |||||
| 2025-08-14 | 13F | Jane Street Group, Llc | Put | 1,762,900 | 0.11 | 19,991 | 36.12 | |||
| 2025-08-14 | 13F | Jane Street Group, Llc | Call | 1,860,400 | 5.14 | 21,097 | 42.97 | |||
| 2025-08-13 | 13F | Renaissance Technologies Llc | 526,000 | 62.34 | 5,965 | 120.73 | ||||
| 2025-08-13 | 13F | ExodusPoint Capital Management, LP | 20,917 | 0 | ||||||
| 2025-08-14 | 13F | Jane Street Group, Llc | 1,230,623 | 11.24 | 13,955 | 51.26 | ||||
| 2025-08-14 | 13F | Petrus Trust Company, LTA | 24,766 | 281 | ||||||
| 2025-08-14 | 13F | State Street Corp | 169,263 | -68.97 | 1,919 | -57.81 | ||||
| 2025-08-13 | 13F | Russell Investments Group, Ltd. | 53 | 0.00 | 1 | |||||
| 2025-08-13 | 13F | Marshall Wace, Llp | 2,683,988 | 64.03 | 30,436 | 123.04 | ||||
| 2025-08-14 | 13F | Two Sigma Investments, Lp | 747,799 | -25.87 | 8,480 | 0.80 | ||||
| 2025-07-22 | 13F | IMC-Chicago, LLC | 125,838 | 245.10 | 1,427 | 369.41 | ||||
| 2025-08-14 | 13F | Wiley Bros.-aintree Capital, Llc | 35,181 | 399 | ||||||
| 2025-08-28 | NP | Amplify ETF Trust - Amplify Mobile Payments ETF | 112,436 | -5.32 | 1,275 | 28.79 | ||||
| 2025-08-12 | 13F | Proem Advisors LLC | 313,298 | 3,553 | ||||||
| 2025-08-14 | 13F | J. Goldman & Co LP | 1,014,813 | 11,508 | ||||||
| 2025-08-11 | 13F | Absolute Gestao de Investimentos Ltda. | 45,045 | 511 | ||||||
| 2025-08-26 | NP | GAFCX - Virtus AlphaSimplex Global Alternatives Fund Class C | 7,826 | 3.55 | 89 | 39.68 | ||||
| 2025-07-21 | 13F | Mirae Asset Global Investments Co., Ltd. | 486 | -88.01 | 6 | |||||
| 2025-08-14 | 13F | Parvin Asset Management, LLC | 4,900 | 0.00 | 56 | 37.50 | ||||
| 2025-08-13 | 13F | Jones Financial Companies Lllp | 1,500 | 2,900.00 | 17 | |||||
| 2025-08-08 | 13F | SG Americas Securities, LLC | 23,384 | -20.96 | 0 | |||||
| 2025-08-14 | 13F | J. Goldman & Co LP | Call | 1,000,000 | 11,340 | |||||
| 2025-08-14 | 13F | Price T Rowe Associates Inc /md/ | 0 | -100.00 | 0 | |||||
| 2025-08-14 | 13F | Man Group plc | 11,472 | 130 | ||||||
| 2025-08-12 | 13F | Virtu Financial LLC | 38,536 | 0.70 | 0 | |||||
| 2025-07-10 | 13F | Exchange Traded Concepts, Llc | 24,213 | 275 | ||||||
| 2025-06-27 | NP | TMAT - Main Thematic Innovation ETF | 144,589 | 1.40 | 1,280 | -32.04 | ||||
| 2025-08-12 | 13F | Advisors Asset Management, Inc. | 951 | -8.91 | 11 | 25.00 | ||||
| 2025-08-14 | 13F | GWM Advisors LLC | 945 | 0.00 | 11 | 42.86 | ||||
| 2025-08-28 | NP | DODEX - Dodge & Cox Emerging Markets Stock Fund | 34,500 | -17.07 | 391 | 13.01 | ||||
| 2025-08-13 | 13F | Invesco Ltd. | 35,987 | -22.40 | 408 | 5.70 | ||||
| 2025-07-24 | 13F | PayPay Securities Corp | 30 | -25.00 | 0 | |||||
| 2025-08-14 | 13F | Citadel Advisors Llc | 359,657 | -42.22 | 4,079 | -21.43 | ||||
| 2025-08-14 | 13F | Citadel Advisors Llc | Call | 423,300 | 0.24 | 4,800 | 36.32 | |||
| 2025-08-13 | 13F | Quantbot Technologies LP | 22,407 | 254 | ||||||
| 2025-08-14 | 13F | Citadel Advisors Llc | Put | 215,700 | 5.89 | 2,446 | 44.05 | |||
| 2025-08-27 | 13F/A | Squarepoint Ops LLC | Call | 20,600 | -68.98 | 234 | -57.87 | |||
| 2025-08-27 | 13F/A | Squarepoint Ops LLC | 73,160 | 830 | ||||||
| 2025-08-14 | 13F | Parallax Volatility Advisers, L.P. | Put | 20,000 | 0.00 | 227 | 36.14 | |||
| 2025-04-22 | NP | GINN - Goldman Sachs Innovate Equity ETF | 23,509 | -24.55 | 225 | -37.08 | ||||
| 2025-08-14 | 13F | Royal Bank Of Canada | 9,855 | -79.75 | 112 | -72.41 | ||||
| 2025-05-15 | 13F/A | Clear Street Llc | 0 | -100.00 | 0 | -100.00 | ||||
| 2025-07-28 | 13F | Harbour Investments, Inc. | 1,000 | 0.00 | 11 | 37.50 | ||||
| 2025-08-11 | 13F | Vanguard Group Inc | 69,848 | -17.12 | 792 | 12.82 | ||||
| 2025-08-14 | 13F | Point72 (DIFC) Ltd | 2,600 | 29 | ||||||
| 2025-08-14 | 13F | Parallax Volatility Advisers, L.P. | Call | 40,000 | 0.00 | 454 | 36.04 | |||
| 2025-08-14 | 13F | MIRAE ASSET GLOBAL ETFS HOLDINGS Ltd. | 102,121 | -3.48 | 1,159 | 31.29 | ||||
| 2025-08-12 | 13F | BlackRock, Inc. | 151,403 | -46.80 | 1,717 | -27.69 | ||||
| 2025-08-14 | 13F | Susquehanna Portfolio Strategies, LLC | 17,700 | 201 | ||||||
| 2025-05-15 | 13F | Hidden Lake Asset Management LP | 0 | -100.00 | 0 | |||||
| 2025-08-14 | 13F | Bank Of America Corp /de/ | Call | 49,700 | 0.00 | 564 | 35.99 | |||
| 2025-08-13 | 13F | Walleye Capital LLC | 70,822 | 50,128.37 | 803 | 80,200.00 | ||||
| 2025-08-14 | 13F | Mariner, LLC | 18,606 | -22.74 | 211 | 5.00 | ||||
| 2025-08-13 | 13F | Walleye Capital LLC | Put | 3,000 | -41.18 | 34 | -19.05 | |||
| 2025-08-14 | 13F | Raymond James Financial Inc | 62,951 | 714 | ||||||
| 2025-08-06 | 13F | Baillie Gifford & Co | 2,699,607 | 3.73 | 30,614 | 41.04 | ||||
| 2025-08-14 | 13F | Lazard Asset Management Llc | 3,823 | 0 | ||||||
| 2025-08-14 | 13F | Bank Of America Corp /de/ | 7,335,958 | 3,174.08 | 83,190 | 4,353.37 | ||||
| 2025-06-30 | NP | APITX - Yorktown Growth Fund Class L Shares | 41,500 | 0.00 | 367 | -32.91 | ||||
| 2025-08-14 | 13F | Winton Capital Group Ltd | 25,665 | 291 | ||||||
| 2025-08-06 | 13F | Stone House Investment Management, LLC | 1,000 | 0.00 | 11 | 37.50 | ||||
| 2025-05-05 | 13F | Creekmur Asset Management LLC | 0 | -100.00 | 0 | |||||
| 2025-08-06 | 13F | Penserra Capital Management LLC | 112,436 | -5.32 | 1 | |||||
| 2025-08-08 | 13F | Larson Financial Group LLC | 218 | 26.74 | 2 | 100.00 | ||||
| 2025-08-14 | 13F | Federation des caisses Desjardins du Quebec | 7,400 | 0.00 | 84 | 36.07 | ||||
| 2025-08-11 | 13F | Krane Funds Advisors LLC | 17,145 | -10.47 | 194 | 22.01 | ||||
| 2025-08-14 | 13F | Point72 Hong Kong Ltd | 23,300 | 264 | ||||||
| 2025-08-08 | 13F | SBI Securities Co., Ltd. | 17,146 | -1.66 | 194 | 33.79 | ||||
| 2025-04-25 | 13F | New Wave Wealth Advisors Llc | 0 | -100.00 | 0 | |||||
| 2025-06-30 | NP | VT - Vanguard Total World Stock Index Fund ETF Shares | 51,770 | 0.00 | 458 | -32.94 | ||||
| 2025-05-05 | 13F | IFP Advisors, Inc | 0 | -100.00 | 0 | |||||
| 2025-07-30 | NP | HEQFX - Monteagle Opportunity Equity Fund Investor Class | 10,648 | 0.00 | 116 | 13.86 | ||||
| 2025-06-27 | 13F/A | Goldman Sachs Group Inc | Put | 0 | -100.00 | 0 | -100.00 | |||
| 2025-05-16 | 13F | Bell Investment Advisors, Inc | 0 | -100.00 | 0 | |||||
| 2025-05-14 | 13F/A | Norges Bank | 194,769 | -30.13 | 2,863 | -41.94 | ||||
| 2025-08-26 | NP | FTKI - First Trust Small Cap BuyWrite Income ETF | 0 | -100.00 | 0 | -100.00 | ||||
| 2025-08-14 | 13F | Group One Trading, L.p. | 26,888 | 305 | ||||||
| 2025-08-14 | 13F | Susquehanna International Group, Llp | Put | 782,600 | 0.68 | 8,875 | 36.90 | |||
| 2025-08-14 | 13F | Susquehanna International Group, Llp | 825,805 | 14.03 | 9,365 | 55.06 | ||||
| 2025-08-14 | 13F | Tudor Investment Corp Et Al | 18,061 | -41.13 | 205 | -20.00 | ||||
| 2025-08-14 | 13F | Susquehanna International Group, Llp | Call | 703,800 | -28.71 | 7,981 | -3.06 | |||
| 2025-08-07 | 13F | Parkside Financial Bank & Trust | 35 | 0.00 | 0 | |||||
| 2025-06-30 | NP | TRFM - AAM Transformers ETF | 16,270 | 1.47 | 144 | -32.23 | ||||
| 2025-08-14 | 13F | Balyasny Asset Management Llc | 437,145 | 405.04 | 4,957 | 587.52 | ||||
| 2025-05-29 | NP | CPAEX - Counterpoint Tactical Equity Fund Class A Shares | 41,525 | -28.26 | 346 | -25.27 | ||||
| 2025-08-18 | 13F/A | Kestra Investment Management, LLC | 120 | 1.69 | 1 | |||||
| 2025-05-15 | 13F | Canada Pension Plan Investment Board | 0 | -100.00 | 0 | -100.00 | ||||
| 2025-05-15 | 13F | Tairen Capital Ltd | 0 | -100.00 | 0 | |||||
| 2025-08-14 | 13F | UBS Group AG | 216,718 | 88.01 | 2,458 | 155.67 | ||||
| 2025-08-11 | 13F | Y.D. More Investments Ltd | 1,383 | 84.40 | 16 | 50.00 | ||||
| 2025-08-12 | 13F | Trexquant Investment LP | 0 | -100.00 | 0 | |||||
| 2025-08-13 | 13F | Walleye Capital LLC | Call | 0 | -100.00 | 0 | -100.00 | |||
| 2025-08-06 | 13F | Fox Run Management, L.l.c. | 47,325 | 61.25 | 537 | 119.67 | ||||
| 2025-07-14 | 13F | Ridgewood Investments LLC | 3,796 | 0.00 | 43 | 38.71 | ||||
| 2025-08-11 | 13F | TD Waterhouse Canada Inc. | 0 | -100.00 | 0 | |||||
| 2025-08-14 | 13F | TB Capital Gestao de Recursos Ltda. | 641,185 | 7,271 | ||||||
| 2025-06-30 | NP | PRFZ - Invesco FTSE RAFI US 1500 Small-Mid ETF This fund is a listed as child fund of Invesco Ltd. and if that institution has disclosed ownership in this security, then these positions will not be double counted when calculating total shares and total value | 12,391 | -31.35 | 110 | -54.20 | ||||
| 2025-08-14 | 13F | D. E. Shaw & Co., Inc. | 274,175 | 3,109 | ||||||
| 2025-08-05 | 13F | Simplex Trading, Llc | 58,025 | 1 | ||||||
| 2025-08-14 | 13F | General Atlantic Llc | 63,906,695 | 0.00 | 724,702 | 35.97 | ||||
| 2025-08-14 | 13F | Tikvah Management LLC | 1,054,499 | 0.00 | 11,958 | 35.98 | ||||
| 2025-08-14 | 13F | Point72 Asia (Singapore) Pte. Ltd. | 2,508 | 28 | ||||||
| 2025-05-14 | 13F | Peak6 Llc | 0 | -100.00 | 0 | -100.00 | ||||
| 2025-08-13 | 13F | Bond Capital Management, LP | 927,500 | 0.00 | 10,518 | 35.97 | ||||
| 2025-08-14 | 13F | Cubist Systematic Strategies, LLC | 449,106 | 5,093 | ||||||
| 2025-08-14 | 13F | Ribbit Management Company, LLC | 3,891,900 | 0.00 | 44,134 | 35.97 | ||||
| 2025-08-13 | 13F | Northern Trust Corp | 119,825 | -2.18 | 1,359 | 33.01 | ||||
| 2025-07-29 | NP | ESGV - Vanguard ESG U.S. Stock ETF ETF Shares | 18,958 | 5.50 | 206 | 19.88 | ||||
| 2025-04-25 | NP | FDFF - Fidelity Disruptive Finance ETF | 92,793 | 8.03 | 887 | -9.78 | ||||
| 2025-08-14 | 13F | Engineers Gate Manager LP | 11,685 | -77.74 | 133 | -69.79 | ||||
| 2025-08-13 | 13F | Centiva Capital, LP | 0 | -100.00 | 0 | |||||
| 2025-07-30 | NP | FINX - Global X FinTech ETF This fund is a listed as child fund of Mirae Asset Global Investments Co., Ltd. and if that institution has disclosed ownership in this security, then these positions will not be double counted when calculating total shares and total value | 95,576 | -23.06 | 1,038 | -12.56 | ||||
| 2025-05-15 | 13F | Crestline Management, LP | 0 | -100.00 | 0 | |||||
| 2025-08-14 | 13F | Point72 Asset Management, L.P. | 191,800 | 2,175 | ||||||
| 2025-07-22 | 13F | Gsa Capital Partners Llp | 157,391 | 391.63 | 2 | |||||
| 2025-08-14 | 13F | Azora Capital LP | 0 | -100.00 | 0 | |||||
| 2025-06-25 | NP | PGEIX - Polen Global Emerging Markets Growth Fund Institutional Class | 40,773 | -15.95 | 361 | -43.75 | ||||
| 2025-08-13 | 13F | Walleye Trading LLC | Call | 172,400 | 115.77 | 1,955 | 193.54 | |||
| 2025-08-14 | 13F | Quarry LP | 6,929 | 76.81 | 79 | 151.61 | ||||
| 2025-08-13 | 13F | Walleye Trading LLC | Put | 30,600 | 2.00 | 347 | 38.80 | |||
| 2025-08-04 | 13F | Quaker Wealth Management, LLC | Put | 0 | -100.00 | 0 | ||||
| 2025-08-14 | 13F | Summit Trail Advisors, Llc | 940,820 | 0.00 | 10,669 | 35.97 | ||||
| 2025-08-13 | 13F | Dodge & Cox | 36,700 | -18.26 | 416 | 11.23 | ||||
| 2025-07-14 | 13F | GAMMA Investing LLC | 24 | 0.00 | 0 |
Other Listings
| MX:DLO N |