Mga Batayang Estadistika
| Pemilik Institusional | 125 total, 117 long only, 0 short only, 8 long/short - change of -6.72% MRQ |
| Alokasi Portofolio Rata-rata | 0.3765 % - change of 4.28% MRQ |
| Saham Institusional (Jangka Panjang) | 24,346,962 (ex 13D/G) - change of -5.02MM shares -17.10% MRQ |
| Nilai Institusional (Jangka Panjang) | $ 435,401 USD ($1000) |
Kepemilikan Institusional dan Pemegang Saham
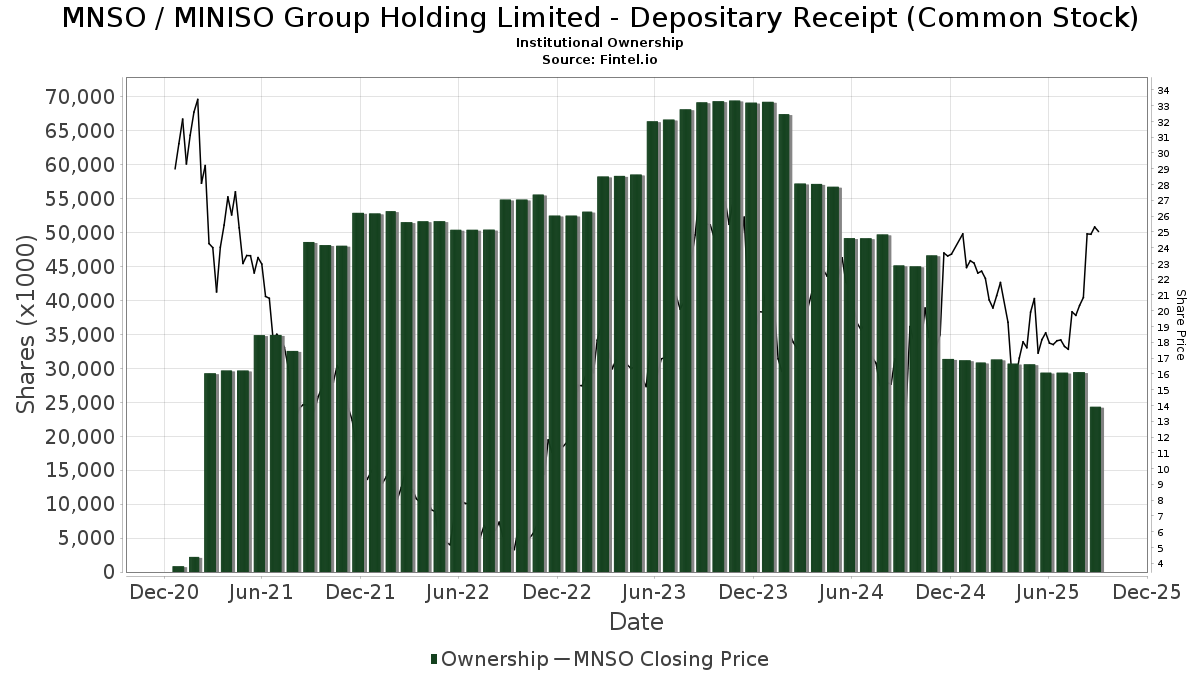
MINISO Group Holding Limited - Depositary Receipt (Common Stock) (US:MNSO) memiliki 125 pemilik institusional dan pemegang saham yang telah mengajukan formulir 13D/G atau 13F kepada Komisi Bursa Efek (Securities Exchange Commission/SEC). Lembaga-lembaga ini memegang total 24,346,962 saham. Pemegang saham terbesar meliputi KEYWISE CAPITAL MANAGEMENT (HK) Ltd, UBS Group AG, Marshall Wace, Llp, Morgan Stanley, Serenity Capital Management Pte. Ltd., Sequoia China Equity Partners (Hong Kong) Ltd, State Street Corp, Crossmark Global Holdings, Inc., Serenity Capital LLC, and Nordea Investment Management Ab .
Struktur kepemilikan institusional MINISO Group Holding Limited - Depositary Receipt (Common Stock) (NYSE:MNSO) menunjukkan posisi terkini di perusahaan oleh institusi dan dana, serta perubahan terbaru dalam ukuran posisi. Pemegang saham utama dapat mencakup investor individu, reksa dana, dana lindung nilai, atau institusi. Jadwal 13D menunjukkan bahwa investor memegang (atau pernah memegang) lebih dari 5% saham perusahaan dan bermaksud (atau pernah bermaksud) untuk secara aktif mengejar perubahan strategi bisnis. Jadwal 13G menunjukkan investasi pasif lebih dari 5%.
The share price as of September 5, 2025 is 24.52 / share. Previously, on September 9, 2024, the share price was 16.57 / share. This represents an increase of 47.98% over that period.
Skor Sentimen Dana
Skor Sentimen Dana (sebelumnya dikenal sebagai Skor Akumulasi Kepemilikan) menemukan saham-saham yang paling banyak dibeli oleh dana. Ini adalah hasil dari model kuantitatif multi-faktor yang canggih yang mengidentifikasi perusahaan dengan tingkat akumulasi institusional tertinggi. Model penilaian menggunakan kombinasi dari total peningkatan pemilik yang diungkapkan, perubahan dalam alokasi portofolio pada pemilik tersebut, dan metrik lainnya. Angka berkisar dari 0 hingga 100, dengan angka yang lebih tinggi menunjukkan tingkat akumulasi yang lebih tinggi dibandingkan dengan perusahaan sejenisnya, dan 50 adalah rata-ratanya.
Frekuensi Pembaruan: Setiap Hari
Lihat Ownership Explorer, yang menyediakan daftar perusahaan dengan peringkat tertinggi.
Rasio Put/Call Institusional
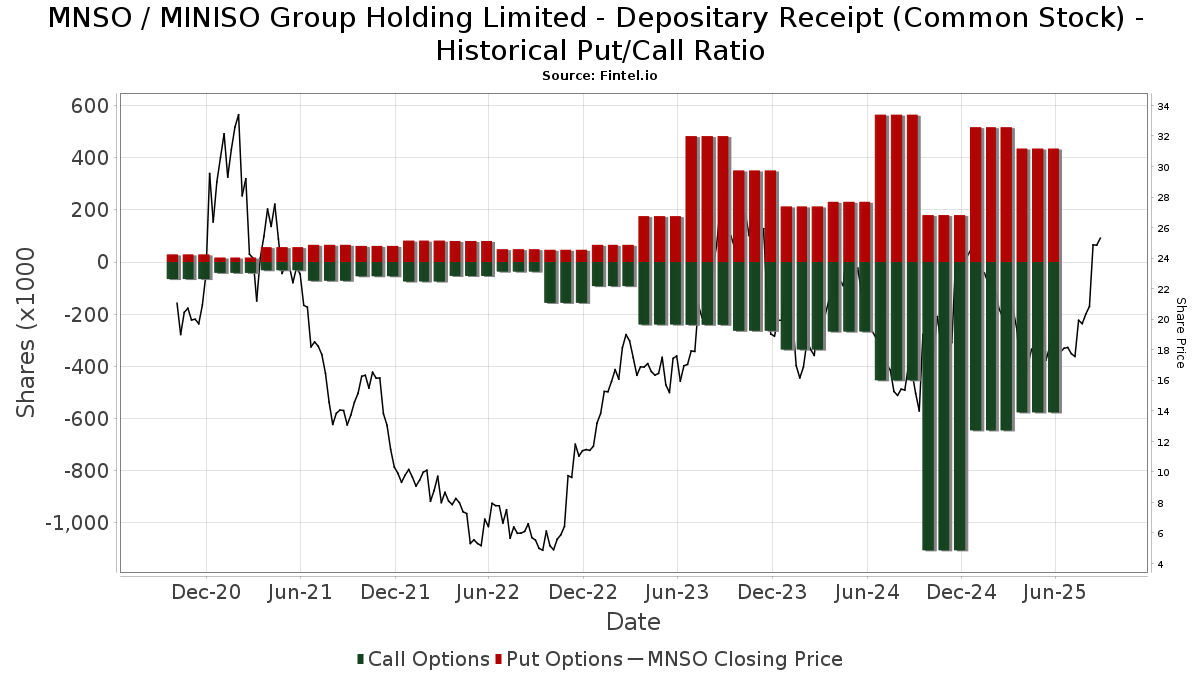
Selain melaporkan isu ekuitas dan utang standar, institusi dengan aset di bawah manajemen lebih dari 100 juta dolar AS juga harus mengungkapkan kepemilikan opsi put dan call mereka. Karena opsi put umumnya menunjukkan sentimen negatif, dan opsi call menunjukkan sentimen positif, kita dapat mengetahui sentimen institusional secara keseluruhan dengan memplot rasio put terhadap call. Grafik di sebelah kanan memplot rasio put/call historis untuk instrumen ini.
Menggunakan Rasio Put/Call sebagai indikator sentimen investor mengatasi salah satu kekurangan utama dari penggunaan total kepemilikan institusional, yaitu sejumlah besar aset yang dikelola diinvestasikan secara pasif untuk melacak indeks. Dana yang dikelola secara pasif biasanya tidak membeli opsi, sehingga indikator rasio put/call lebih akurat dalam melacak sentimen dana yang dikelola secara aktif.
Pengajuan 13D/G
Kami menyajikan pengajuan 13D/G secara terpisah dari pengajuan 13F karena perlakuan yang berbeda oleh SEC. Pengajuan 13D/G dapat diajukan oleh kelompok investor (dengan satu pemimpin), sedangkan pengajuan 13F tidak bisa. Hal ini mengakibatkan situasi di mana seorang investor dapat mengajukan 13D/G yang melaporkan satu nilai untuk total saham (mewakili semua saham yang dimiliki oleh kelompok investor), tetapi kemudian mengajukan 13F yang melaporkan nilai yang berbeda untuk total saham (mewakili kepemilikan mereka sendiri). Ini berarti bahwa kepemilikan saham dari pengajuan 13D/G dan pengajuan 13F seringkali tidak dapat dibandingkan secara langsung, sehingga kami menyajikannya secara terpisah.
Catatan: Mulai 16 Mei 2021, kami tidak lagi menampilkan pemilik yang belum mengajukan 13D/G dalam setahun terakhir. Sebelumnya, kami menampilkan riwayat lengkap pengajuan 13D/G. Secara umum, entitas yang diwajibkan untuk mengajukan pengajuan 13D/G harus mengajukan setidaknya setiap tahun sebelum mengirimkan pengajuan penutupan. Namun, terkadang dana keluar dari posisi tanpa mengirimkan pengajuan penutupan (misalnya, mereka menghentikan operasi), sehingga menampilkan riwayat lengkap terkadang menyebabkan kebingungan tentang kepemilikan saat ini. Untuk mencegah kebingungan, kami sekarang hanya menampilkan pemilik 'saat ini' - yaitu - pemilik yang telah mengajukan dalam setahun terakhir.
Upgrade to unlock premium data.
| Tanggal File | Formulir | Investor | Sebelumnya Saham |
Terbaru Saham |
Δ Saham (Persen) |
Kepemilikan (Persen) |
Δ Pagmamay-ari (Persen) |
|
|---|---|---|---|---|---|---|---|---|
| 2025-08-13 | Ye Guofu | 775,541,061 | 789,541,061 | 1.81 | 63.20 | 2.93 | ||
| 2025-07-31 | NORGES BANK | 62,502,740 | 5.00 |
Pengajuan 13F dan NPORT
Detail pada pengajuan 13F tersedia gratis. Detail pada pengajuan NP memerlukan keanggotaan premium. Baris berwarna hijau menunjukkan posisi baru. Baris berwarna merah menunjukkan posisi yang sudah ditutup. Klik tautan ini ikon untuk melihat riwayat transaksi selengkapnya.
Tingkatkan
untuk membuka data premium dan mengekspor ke Excel ![]() .
.
| Tanggal File | Sumber | Investor | Ketik | Presyo ng Avg (Silangan) |
Saham | Δ Saham (%) |
Dilaporkan Nilai ($1000) |
Nilai Δ (%) |
Alokasi Port (%) |
|
|---|---|---|---|---|---|---|---|---|---|---|
| 2025-08-14 | 13F | Weiss Asset Management LP | 61,456 | 1,120 | ||||||
| 2025-08-12 | 13F | XTX Topco Ltd | 28,647 | 522 | ||||||
| 2025-08-14 | 13F | Erste Asset Management GmbH | 0 | -100.00 | 0 | |||||
| 2025-08-12 | 13F | Aigen Investment Management, Lp | 12,798 | 233 | ||||||
| 2025-08-14 | 13F | Parallax Volatility Advisers, L.P. | Call | 0 | -100.00 | 0 | ||||
| 2025-08-08 | 13F | Larson Financial Group LLC | 70 | 1 | ||||||
| 2025-08-14 | 13F | Group One Trading, L.p. | Call | 130,800 | 41.25 | 2,383 | 39.19 | |||
| 2025-08-14 | 13F | Group One Trading, L.p. | 13,722 | 250 | ||||||
| 2025-08-14 | 13F | Group One Trading, L.p. | Put | 68,800 | 24.19 | 1,254 | 22.36 | |||
| 2025-05-05 | 13F | Creekmur Asset Management LLC | 0 | -100.00 | 0 | |||||
| 2025-05-20 | 13F/A | Lansdowne Partners (uk) Llp | 0 | -100.00 | 0 | -100.00 | ||||
| 2025-08-14 | 13F | Sunbelt Securities, Inc. | 2,030 | 0.00 | 49 | 29.73 | ||||
| 2025-08-05 | 13F | Simplex Trading, Llc | Call | 75,100 | 59.11 | 1 | ||||
| 2025-07-30 | NP | APIE - ActivePassive International Equity ETF | 8,277 | -61.74 | 141 | -68.89 | ||||
| 2025-05-15 | 13F | Schonfeld Strategic Advisors LLC | 0 | -100.00 | 0 | |||||
| 2025-08-07 | 13F | Connor, Clark & Lunn Investment Management Ltd. | 0 | -100.00 | 0 | -100.00 | ||||
| 2025-08-14 | 13F | Jane Street Group, Llc | Put | 71,900 | -26.86 | 1,310 | -27.90 | |||
| 2025-08-05 | 13F | Simplex Trading, Llc | Put | 18,400 | -73.10 | 0 | -100.00 | |||
| 2025-08-05 | 13F | Simplex Trading, Llc | 2,020 | -95.59 | 0 | |||||
| 2025-08-14 | 13F | Jane Street Group, Llc | Call | 112,900 | -0.88 | 2,057 | -2.33 | |||
| 2025-05-15 | 13F | Tudor Investment Corp Et Al | Call | 0 | -100.00 | 0 | ||||
| 2025-08-14 | 13F | Jane Street Group, Llc | 13,828 | -96.63 | 252 | -96.69 | ||||
| 2025-05-05 | 13F | Pictet Asset Management Holding SA | 0 | -100.00 | 0 | |||||
| 2025-08-08 | 13F | M&G Plc | 0 | -100.00 | 0 | |||||
| 2025-08-14 | 13F | UBS Group AG | 2,520,980 | -40.64 | 45,932 | -41.51 | ||||
| 2025-08-07 | 13F | Vise Technologies, Inc. | 0 | -100.00 | 0 | |||||
| 2025-08-12 | 13F | Legal & General Group Plc | 352,471 | -0.47 | 6,417 | -1.99 | ||||
| 2025-08-11 | 13F | Citigroup Inc | 148 | -48.07 | 3 | -60.00 | ||||
| 2025-08-13 | 13F | Marshall Wace, Llp | 1,776,960 | 131.10 | 32,376 | 127.73 | ||||
| 2025-08-13 | 13F | Hsbc Holdings Plc | 0 | -100.00 | 0 | |||||
| 2025-08-13 | 13F | Invesco Ltd. | 22,894 | -19.16 | 417 | -20.27 | ||||
| 2025-08-14 | 13F | Vident Advisory, LLC | 29,127 | 18.02 | 531 | 16.23 | ||||
| 2025-08-28 | NP | GXC - SPDR(R) S&P(R) CHINA ETF | 16,479 | -10.15 | 300 | -11.50 | ||||
| 2025-07-28 | NP | AVEM - Avantis Emerging Markets Equity ETF This fund is a listed as child fund of American Century Companies Inc and if that institution has disclosed ownership in this security, then these positions will not be double counted when calculating total shares and total value | 117,342 | 0.00 | 1,997 | -18.19 | ||||
| 2025-08-07 | 13F | Allworth Financial LP | 7 | 0 | ||||||
| 2025-08-12 | 13F | MAI Capital Management | 341 | 0.00 | 6 | 0.00 | ||||
| 2025-06-23 | NP | UGPIX - UltraChina ProFund Investor Class | 5,405 | -24.36 | 97 | -40.85 | ||||
| 2025-07-22 | 13F | IMC-Chicago, LLC | 23,857 | -16.19 | 435 | -17.49 | ||||
| 2025-07-22 | 13F | IMC-Chicago, LLC | Put | 45,100 | 6.62 | 822 | 4.99 | |||
| 2025-07-22 | 13F | IMC-Chicago, LLC | Call | 24,300 | -12.59 | 443 | -14.01 | |||
| 2025-08-14 | 13F | Van Eck Associates Corp | 279,533 | 16.99 | 5 | 25.00 | ||||
| 2025-08-13 | 13F | Walleye Capital LLC | 0 | -100.00 | 0 | |||||
| 2025-08-15 | 13F | Tower Research Capital LLC (TRC) | 0 | -100.00 | 0 | |||||
| 2025-08-12 | 13F | Steward Partners Investment Advisory, Llc | 8 | 0 | ||||||
| 2025-08-12 | 13F | AI-Squared Management Ltd | 0 | -100.00 | 0 | |||||
| 2025-07-29 | 13F | Virginia Retirement Systems Et Al | 0 | -100.00 | 0 | |||||
| 2025-08-12 | 13F | Proequities, Inc. | Put | 0 | 0 | |||||
| 2025-08-13 | 13F | Walleye Capital LLC | Put | 0 | -100.00 | 0 | ||||
| 2025-08-12 | 13F | Proequities, Inc. | Call | 0 | 0 | |||||
| 2025-08-13 | 13F | Walleye Capital LLC | Call | 0 | -100.00 | 0 | ||||
| 2025-08-12 | 13F | IvyRock Asset Management (HK) Ltd | 0 | -100.00 | 0 | |||||
| 2025-08-12 | 13F | Proequities, Inc. | 0 | 0 | ||||||
| 2025-08-12 | 13F | Coldstream Capital Management Inc | 0 | -100.00 | 0 | |||||
| 2025-08-14 | 13F | Citadel Advisors Llc | Put | 0 | -100.00 | 0 | -100.00 | |||
| 2025-08-28 | NP | NDOW - Anydrus Advantage ETF | 0 | -100.00 | 0 | -100.00 | ||||
| 2025-08-14 | 13F | Ubs Asset Management Americas Inc | 2,836 | 52 | ||||||
| 2025-05-13 | 13F | Norges Bank | 0 | -100.00 | 0 | -100.00 | ||||
| 2025-08-14 | 13F | Susquehanna International Group, Llp | Call | 0 | -100.00 | 0 | ||||
| 2025-08-12 | 13F | Jpmorgan Chase & Co | 10 | 0.00 | 0 | |||||
| 2025-05-13 | 13F | Fox Run Management, L.l.c. | 0 | -100.00 | 0 | -100.00 | ||||
| 2025-05-15 | 13F | Two Sigma Advisers, Lp | 0 | -100.00 | 0 | |||||
| 2025-08-12 | 13F | CIBC Private Wealth Group, LLC | 482 | 0.00 | 9 | 33.33 | ||||
| 2025-04-30 | 13F | Sofos Investments, Inc. | 15 | 0 | ||||||
| 2025-05-15 | 13F | D. E. Shaw & Co., Inc. | 0 | -100.00 | 0 | |||||
| 2025-05-13 | 13F | Qtron Investments LLC | 0 | -100.00 | 0 | |||||
| 2025-08-13 | 13F | EverSource Wealth Advisors, LLC | 2,223 | 37.65 | 41 | 37.93 | ||||
| 2025-08-14 | 13F | Hrt Financial Lp | 0 | -100.00 | 0 | |||||
| 2025-08-14 | 13F | Goldman Sachs Group Inc | 329,456 | 4.45 | 6,003 | 2.91 | ||||
| 2025-06-26 | NP | DFAE - Dimensional Emerging Core Equity Market ETF | 1,100 | 0.00 | 20 | -24.00 | ||||
| 2025-08-12 | 13F | BlackRock, Inc. | 92,307 | -56.76 | 1,682 | -57.41 | ||||
| 2025-07-31 | 13F | Briaud Financial Planning, Inc | 426 | 0 | ||||||
| 2025-06-30 | NP | AIM INTERNATIONAL MUTUAL FUNDS (INVESCO INTERNATIONAL MUTUAL FUNDS) - Invesco Oppenheimer Global Multi-Asset Growth Fund Class R6 | 472 | 74.17 | 9 | 33.33 | ||||
| 2025-08-14 | 13F | Bank Of America Corp /de/ | 220,871 | -54.98 | 4,024 | -55.64 | ||||
| 2025-08-05 | 13F | NewSquare Capital LLC | 34 | 0.00 | 1 | |||||
| 2025-08-12 | 13F | Rhumbline Advisers | 2,013 | 2.18 | 37 | 0.00 | ||||
| 2025-08-13 | 13F | Sequoia China Equity Partners (Hong Kong) Ltd | 974,951 | -23.52 | 17,764 | -24.64 | ||||
| 2025-08-14 | 13F | Susquehanna International Group, Llp | 194,467 | -0.13 | 3,543 | -1.58 | ||||
| 2025-08-28 | NP | SSTIX - State Street Total Return V.I.S. Fund Class 1 Shares | 576 | -58.86 | 10 | -60.00 | ||||
| 2025-08-14 | 13F | Citadel Advisors Llc | 231,025 | 220.17 | 4,209 | 215.52 | ||||
| 2025-08-14 | 13F | Citadel Advisors Llc | Call | 132,000 | 91.30 | 2,405 | 88.63 | |||
| 2025-08-14 | 13F | Susquehanna International Group, Llp | Put | 191,300 | 20.92 | 3,485 | 19.15 | |||
| 2025-08-13 | 13F | Northwestern Mutual Wealth Management Co | 177 | 3 | ||||||
| 2025-08-14 | 13F | Old Mission Capital Llc | 0 | -100.00 | 0 | |||||
| 2025-05-14 | 13F | Taikang Asset Management (Hong Kong) Co Ltd | 0 | -100.00 | 0 | |||||
| 2025-07-24 | 13F | Ronald Blue Trust, Inc. | 170 | -78.37 | 3 | -78.57 | ||||
| 2025-05-15 | 13F | Two Sigma Investments, Lp | 0 | -100.00 | 0 | |||||
| 2025-08-14 | 13F | XY Capital Ltd | 0 | -100.00 | 0 | |||||
| 2025-06-30 | 13F/A | Deutsche Bank Ag\ | 0 | -100.00 | 0 | -100.00 | ||||
| 2025-07-21 | 13F | Qrg Capital Management, Inc. | 0 | -100.00 | 0 | |||||
| 2025-07-28 | NP | NSI - National Security Emerging Markets Index ETF | 825 | 38.66 | 14 | 16.67 | ||||
| 2025-08-12 | 13F | Tairen Capital Ltd | 378,270 | 26.86 | 6,892 | 25.01 | ||||
| 2025-08-29 | NP | JVANX - International Equity Index Trust NAV | 3,276 | 0.00 | 60 | -1.67 | ||||
| 2025-08-14 | 13F | Millennium Management Llc | 363,340 | 207.00 | 6,620 | 202.56 | ||||
| 2025-05-13 | 13F | Schroder Investment Management Group | 0 | -100.00 | 0 | -100.00 | ||||
| 2025-07-09 | 13F | Byrne Asset Management LLC | 0 | -100.00 | 0 | |||||
| 2025-08-11 | 13F | Keystone Investors Pte Ltd | 145,300 | 2,647 | ||||||
| 2025-08-21 | NP | VanEck VIP Trust - VanEck VIP Emerging Markets Fund Initial Class | 56,000 | 27.27 | 1,020 | 25.46 | ||||
| 2025-08-14 | 13F | Davidson Kempner Capital Management Lp | 110,576 | 2,015 | ||||||
| 2025-08-14 | 13F | Bnp Paribas Arbitrage, Sa | 35,516 | -72.18 | 647 | -72.58 | ||||
| 2025-08-08 | 13F | Financial Gravity Companies, Inc. | 7 | -53.33 | 0 | |||||
| 2025-06-24 | NP | TLTE - FlexShares Morningstar Emerging Markets Factor Tilt Index Fund | 1,992 | 0.00 | 36 | -22.22 | ||||
| 2025-08-01 | 13F | Brinker Capital Investments, LLC | 0 | -100.00 | 0 | -100.00 | ||||
| 2025-07-11 | 13F | Farther Finance Advisors, LLC | 96 | -54.72 | 2 | -75.00 | ||||
| 2025-05-06 | 13F | Venturi Wealth Management, LLC | 0 | -100.00 | 0 | |||||
| 2025-08-14 | 13F | Boston Private Wealth Llc | 0 | -100.00 | 0 | |||||
| 2025-05-05 | 13F | Lindbrook Capital, Llc | 34 | -66.34 | 1 | -100.00 | ||||
| 2025-08-14 | 13F/A | Skopos Labs, Inc. | 3,619 | 119.20 | 66 | 116.67 | ||||
| 2025-07-24 | 13F | Us Bancorp \de\ | 4,559 | -33.56 | 83 | -34.13 | ||||
| 2025-04-17 | 13F | Janney Montgomery Scott LLC | 0 | -100.00 | 0 | |||||
| 2025-08-06 | NP | LINCOLN VARIABLE INSURANCE PRODUCTS TRUST - LVIP SSGA Emerging Markets Equity Index Fund Standard Class | 2,865 | 0.00 | 52 | 0.00 | ||||
| 2025-05-15 | 13F | Caption Management, LLC | 0 | -100.00 | 0 | |||||
| 2025-07-29 | 13F | Nordea Investment Management Ab | 397,322 | 5.66 | 7,215 | 3.84 | ||||
| 2025-08-13 | 13F | Walleye Trading LLC | Put | 18,700 | -49.18 | 341 | -50.00 | |||
| 2025-08-13 | 13F | Walleye Trading LLC | Call | 20,500 | -50.96 | 374 | -51.68 | |||
| 2025-05-06 | 13F | Y-Intercept (Hong Kong) Ltd | 0 | -100.00 | 0 | -100.00 | ||||
| 2025-07-25 | 13F | Cwm, Llc | 263 | 115.57 | 0 | |||||
| 2025-05-16 | 13F | Bell Investment Advisors, Inc | 0 | -100.00 | 0 | |||||
| 2025-08-18 | 13F | Wolverine Trading, Llc | Call | 65,400 | 205.61 | 1,165 | 193.45 | |||
| 2025-08-13 | 13F | Walleye Trading LLC | 0 | -100.00 | 0 | -100.00 | ||||
| 2025-08-18 | 13F | Wolverine Trading, Llc | Put | 12,300 | -26.79 | 219 | -29.81 | |||
| 2025-08-14 | 13F | Peak6 Llc | 6,128 | 112 | ||||||
| 2025-07-11 | 13F | UMA Financial Services, Inc. | 0 | -100.00 | 0 | |||||
| 2025-08-28 | NP | GMF - SPDR(R) S&P(R) EMERGING ASIA PACIFIC ETF | 4,295 | -6.53 | 78 | -7.14 | ||||
| 2025-07-31 | 13F | Caitong International Asset Management Co., Ltd | 0 | -100.00 | 0 | |||||
| 2025-08-14 | 13F | Peak6 Llc | Put | 8,700 | 0.00 | 159 | -1.25 | |||
| 2025-08-14 | 13F | Peak6 Llc | Call | 15,200 | -90.16 | 277 | -90.33 | |||
| 2025-08-14 | 13F | Wells Fargo & Company/mn | 597 | -19.97 | 11 | -23.08 | ||||
| 2025-08-12 | 13F | Atlas Capital Advisors Llc | 6,705 | 0.00 | 122 | -0.81 | ||||
| 2025-08-12 | 13F | American Century Companies Inc | 133,224 | 0.45 | 2,427 | -1.02 | ||||
| 2025-08-13 | 13F | Quadrant Capital Group Llc | 41,972 | 12,244.71 | 765 | 12,633.33 | ||||
| 2025-08-14 | 13F | Quantinno Capital Management LP | 34,806 | 72.81 | 634 | 70.43 | ||||
| 2025-05-09 | 13F | J. Safra Sarasin Holding AG | 0 | -100.00 | 0 | |||||
| 2025-05-30 | NP | CGRO - CoreValues Alpha Greater China Growth ETF | 10,438 | -50.82 | 193 | -52.48 | ||||
| 2025-08-14 | 13F | Ameriprise Financial Inc | 14,770 | 1.99 | 269 | 0.75 | ||||
| 2025-07-21 | 13F | Mirae Asset Global Investments Co., Ltd. | 4,043 | 7.30 | 74 | 4.29 | ||||
| 2025-08-14 | 13F | Macquarie Group Ltd | 13,816 | 0.00 | 252 | -1.57 | ||||
| 2025-09-04 | 13F/A | Advisor Group Holdings, Inc. | 351 | 3,800.00 | 6 | |||||
| 2025-08-28 | NP | SPEM - SPDR(R) Portfolio Emerging Markets ETF | 117,786 | 1.94 | 2,146 | 0.47 | ||||
| 2025-05-15 | 13F | Advisors Asset Management, Inc. | 0 | -100.00 | 0 | |||||
| 2025-07-16 | 13F | Signaturefd, Llc | 107 | -36.31 | 2 | -66.67 | ||||
| 2025-05-14 | 13F | Candriam Luxembourg S.C.A. | 0 | -100.00 | 0 | |||||
| 2025-07-24 | 13F | Jfs Wealth Advisors, Llc | 46 | 24.32 | 1 | |||||
| 2025-08-13 | 13F | Victory Capital Management Inc | 11,791 | 0.00 | 215 | -1.83 | ||||
| 2025-08-12 | 13F | LPL Financial LLC | 11,152 | -6.06 | 203 | -7.31 | ||||
| 2025-08-14 | 13F | Fmr Llc | 1,085 | -71.68 | 20 | -72.86 | ||||
| 2025-08-07 | 13F | Aviva Plc | 55,825 | -1.54 | 1,017 | -2.96 | ||||
| 2025-08-08 | 13F | Creative Planning | 16,662 | 45.08 | 304 | 42.92 | ||||
| 2025-04-29 | 13F | Penserra Capital Management LLC | 0 | -100.00 | 0 | |||||
| 2025-08-08 | 13F | SBI Securities Co., Ltd. | 1,094 | 286.57 | 20 | 280.00 | ||||
| 2025-08-14 | 13F | Wexford Capital Lp | 0 | -100.00 | 0 | |||||
| 2025-08-14 | 13F | Toroso Investments, LLC | 0 | -100.00 | 0 | |||||
| 2025-08-13 | 13F | Northern Trust Corp | 22,037 | -6.33 | 402 | -7.60 | ||||
| 2025-08-14 | 13F/A | Barclays Plc | 38,837 | 1 | ||||||
| 2025-08-21 | NP | GBFAX - Emerging Markets Fund Class A | 200,000 | 11.11 | 3,644 | 9.50 | ||||
| 2025-08-14 | 13F | KEYWISE CAPITAL MANAGEMENT (HK) Ltd | 9,335,035 | 1.33 | 170,084 | -0.15 | ||||
| 2025-04-15 | 13F | SG Americas Securities, LLC | 0 | -100.00 | 0 | |||||
| 2025-08-08 | 13F | Pnc Financial Services Group, Inc. | 1,933 | 141.02 | 35 | 150.00 | ||||
| 2025-08-13 | 13F | Russell Investments Group, Ltd. | 10,400 | -36.59 | 189 | -37.62 | ||||
| 2025-08-15 | 13F | Sylebra Capital Llc | 0 | -100.00 | 0 | |||||
| 2025-07-28 | NP | TEMUX - Emerging Markets Equity Fund | 54,000 | 58.82 | 919 | 29.99 | ||||
| 2025-05-14 | 13F | Renaissance Technologies Llc | 0 | -100.00 | 0 | |||||
| 2025-07-28 | NP | AVSE - Avantis Responsible Emerging Markets Equity ETF | 3,339 | 13.30 | 57 | -8.20 | ||||
| 2025-08-14 | 13F | State Street Corp | 928,833 | -19.58 | 16,923 | -20.76 | ||||
| 2025-08-14 | 13F | LMR Partners LLP | 0 | -100.00 | 0 | |||||
| 2025-08-04 | 13F | Hantz Financial Services, Inc. | 2,139 | 3,465.00 | 0 | |||||
| 2025-08-14 | 13F | Raymond James Financial Inc | 299 | 5 | ||||||
| 2025-05-14 | 13F | MY.Alpha Management HK Advisors Ltd | 0 | -100.00 | 0 | |||||
| 2025-08-29 | 13F | Infini Capital Management Ltd | 15,650 | 0.00 | 285 | -1.38 | ||||
| 2025-08-01 | 13F | Envestnet Asset Management Inc | 17,913 | 326 | ||||||
| 2025-05-15 | 13F | Serenity Capital LLC | 463,450 | 8,569 | ||||||
| 2025-05-15 | 13F | Manufacturers Life Insurance Company, The | 0 | -100.00 | 0 | |||||
| 2025-08-14 | 13F | Mariner, LLC | 14,411 | -4.25 | 263 | -5.76 | ||||
| 2025-07-08 | 13F | Parallel Advisors, LLC | 389 | -58.31 | 7 | -58.82 | ||||
| 2025-07-30 | 13F | DekaBank Deutsche Girozentrale | 19,573 | 0.00 | 0 | |||||
| 2025-08-08 | 13F | Alberta Investment Management Corp | 20,100 | 0.00 | 366 | -1.35 | ||||
| 2025-08-13 | 13F | Mackenzie Financial Corp | 129,904 | -32.56 | 2,367 | -33.56 | ||||
| 2025-08-11 | 13F | Principal Securities, Inc. | 0 | -100.00 | 0 | |||||
| 2025-08-11 | 13F | Banque Cantonale Vaudoise | 4,024 | 0.00 | 0 | |||||
| 2025-08-15 | 13F | Morgan Stanley | 1,251,644 | -52.29 | 22,805 | -52.99 | ||||
| 2025-07-24 | 13F | GFG Capital, LLC | 3,165 | 58 | ||||||
| 2025-08-14 | 13F | Linden Advisors Lp | 50,590 | -40.27 | 922 | -41.15 | ||||
| 2025-08-28 | NP | SSGVX - State Street Global Equity ex-U.S. Index Portfolio State Street Global All Cap Equity ex-U.S. Index Portfolio This fund is a listed as child fund of State Street Corp and if that institution has disclosed ownership in this security, then these positions will not be double counted when calculating total shares and total value | 21,700 | 0.00 | 395 | -1.50 | ||||
| 2025-08-14 | 13F | Stifel Financial Corp | 88,114 | 1,605 | ||||||
| 2025-08-14 | 13F | Verition Fund Management LLC | 13,539 | 247 | ||||||
| 2025-08-13 | 13F | Serenity Capital Management Pte. Ltd. | 1,157,662 | 149.79 | 21,093 | 146.14 | ||||
| 2025-06-27 | NP | PGJ - Invesco Golden Dragon China ETF This fund is a listed as child fund of Invesco Ltd. and if that institution has disclosed ownership in this security, then these positions will not be double counted when calculating total shares and total value | 27,918 | -24.74 | 503 | -40.96 | ||||
| 2025-08-28 | NP | SPGM - SPDR(R) Portfolio MSCI Global Stock Market ETF | 372 | 2.48 | 7 | 0.00 | ||||
| 2025-08-28 | NP | SSKEX - State Street Emerging Markets Equity Index Fund Class K This fund is a listed as child fund of State Street Corp and if that institution has disclosed ownership in this security, then these positions will not be double counted when calculating total shares and total value | 6,396 | 0.00 | 117 | -1.69 | ||||
| 2025-08-14 | 13F | Barometer Capital Management Inc. | 16,900 | 43.22 | 308 | 44.13 | ||||
| 2025-08-13 | 13F | Healthcare Of Ontario Pension Plan Trust Fund | 0 | -100.00 | 0 | |||||
| 2025-04-21 | 13F | Nelson, Van Denburg & Campbell Wealth Management Group, LLC | 0 | -100.00 | 0 | |||||
| 2025-08-08 | 13F | Crossmark Global Holdings, Inc. | 679,199 | 12,375 | ||||||
| 2025-05-12 | 13F | Allianz Se | 0 | -100.00 | 0 | -100.00 | ||||
| 2025-07-16 | 13F | Strategic Investment Solutions, Inc. /IL | 100 | 0.00 | 2 | 0.00 | ||||
| 2025-07-22 | 13F | Gsa Capital Partners Llp | 123,531 | 608.52 | 2 | |||||
| 2025-07-28 | NP | AVEEX - Avantis Emerging Markets Equity Fund Institutional Class This fund is a listed as child fund of American Century Companies Inc and if that institution has disclosed ownership in this security, then these positions will not be double counted when calculating total shares and total value | 11,647 | 0.00 | 198 | -18.18 | ||||
| 2025-08-12 | 13F | O'shaughnessy Asset Management, Llc | 0 | -100.00 | 0 | |||||
| 2025-07-16 | 13F | ABS Direct Equity Fund LLC | 0 | -100.00 | 0 | |||||
| 2025-08-14 | 13F | Royal Bank Of Canada | 675 | -97.49 | 12 | -97.59 | ||||
| 2025-08-14 | 13F | Balyasny Asset Management Llc | 208,715 | 3,803 | ||||||
| 2025-04-24 | NP | USEMX - Emerging Markets Fund Shares | 30,465 | -2.96 | 634 | 0.80 | ||||
| 2025-05-14 | 13F | Orion Portfolio Solutions, LLC | 8,460 | 0.00 | 202 | 0.00 | ||||
| 2025-04-24 | NP | USIFX - International Fund Shares | 97,790 | -11.34 | 2,035 | -7.79 | ||||
| 2025-08-14 | 13F | Polymer Capital Management (HK) LTD | 260,053 | 4,738 | ||||||
| 2025-05-13 | 13F | Ethic Inc. | 0 | -100.00 | 0 |