Mga Batayang Estadistika
| Saham Institusional (Jangka Panjang) | 377,897,053 - 66.16% (ex 13D/G) - change of 13.03MM shares 3.57% MRQ |
| Nilai Institusional (Jangka Panjang) | $ 2,337,179 USD ($1000) |
Kepemilikan Institusional dan Pemegang Saham
NexGen Energy Ltd. (US:NXE) memiliki 310 pemilik institusional dan pemegang saham yang telah mengajukan formulir 13D/G atau 13F kepada Komisi Bursa Efek (Securities Exchange Commission/SEC). Lembaga-lembaga ini memegang total 378,040,453 saham. Pemegang saham terbesar meliputi L1 Capital Pty Ltd, MIRAE ASSET GLOBAL ETFS HOLDINGS Ltd., URA - Global X Uranium ETF, Vanguard Group Inc, Van Eck Associates Corp, Alps Advisors Inc, Segra Capital Management, LLC, Sprott Funds Trust - Sprott Uranium Miners Etf, NLR - VanEck Vectors Uranium+Nuclear Energy ETF, and Grantham, Mayo, Van Otterloo & Co. LLC .
Struktur kepemilikan institusional NexGen Energy Ltd. (NYSE:NXE) menunjukkan posisi terkini di perusahaan oleh institusi dan dana, serta perubahan terbaru dalam ukuran posisi. Pemegang saham utama dapat mencakup investor individu, reksa dana, dana lindung nilai, atau institusi. Jadwal 13D menunjukkan bahwa investor memegang (atau pernah memegang) lebih dari 5% saham perusahaan dan bermaksud (atau pernah bermaksud) untuk secara aktif mengejar perubahan strategi bisnis. Jadwal 13G menunjukkan investasi pasif lebih dari 5%.
The share price as of September 5, 2025 is 7.80 / share. Previously, on September 9, 2024, the share price was 5.32 / share. This represents an increase of 46.62% over that period.

Skor Sentimen Dana
Skor Sentimen Dana (sebelumnya dikenal sebagai Skor Akumulasi Kepemilikan) menemukan saham-saham yang paling banyak dibeli oleh dana. Ini adalah hasil dari model kuantitatif multi-faktor yang canggih yang mengidentifikasi perusahaan dengan tingkat akumulasi institusional tertinggi. Model penilaian menggunakan kombinasi dari total peningkatan pemilik yang diungkapkan, perubahan dalam alokasi portofolio pada pemilik tersebut, dan metrik lainnya. Angka berkisar dari 0 hingga 100, dengan angka yang lebih tinggi menunjukkan tingkat akumulasi yang lebih tinggi dibandingkan dengan perusahaan sejenisnya, dan 50 adalah rata-ratanya.
Frekuensi Pembaruan: Setiap Hari
Lihat Ownership Explorer, yang menyediakan daftar perusahaan dengan peringkat tertinggi.
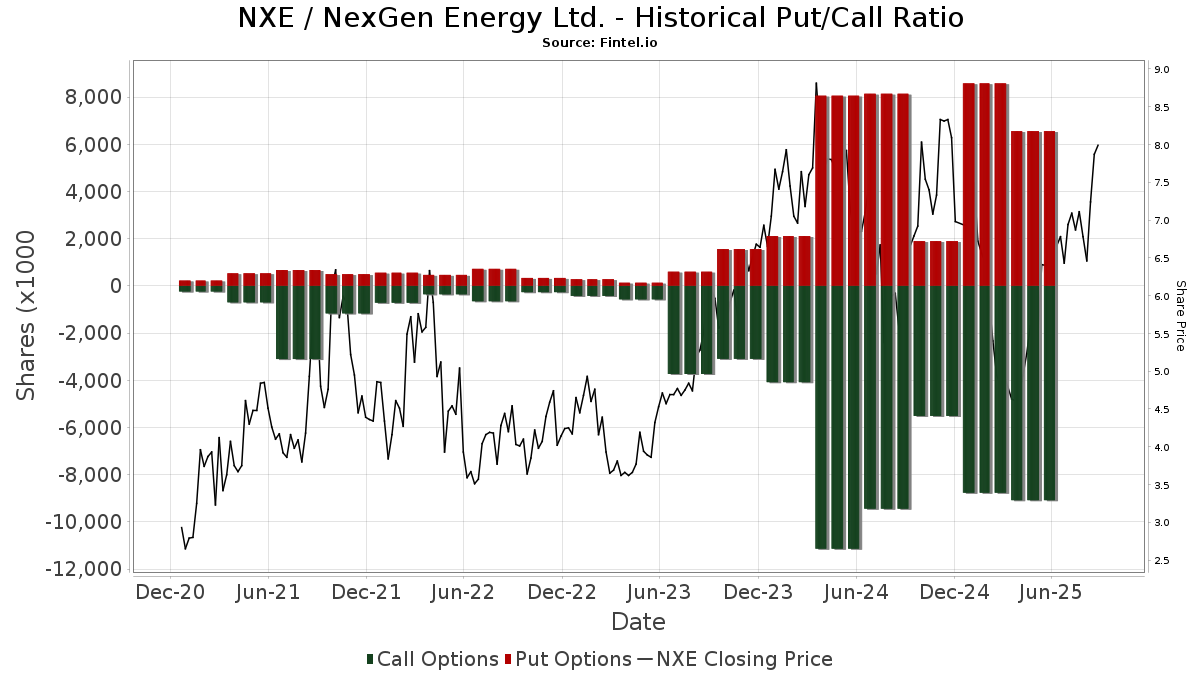
Rasio Put/Call Institusional
Selain melaporkan isu ekuitas dan utang standar, institusi dengan aset di bawah manajemen lebih dari 100 juta dolar AS juga harus mengungkapkan kepemilikan opsi put dan call mereka. Karena opsi put umumnya menunjukkan sentimen negatif, dan opsi call menunjukkan sentimen positif, kita dapat mengetahui sentimen institusional secara keseluruhan dengan memplot rasio put terhadap call. Grafik di sebelah kanan memplot rasio put/call historis untuk instrumen ini.
Menggunakan Rasio Put/Call sebagai indikator sentimen investor mengatasi salah satu kekurangan utama dari penggunaan total kepemilikan institusional, yaitu sejumlah besar aset yang dikelola diinvestasikan secara pasif untuk melacak indeks. Dana yang dikelola secara pasif biasanya tidak membeli opsi, sehingga indikator rasio put/call lebih akurat dalam melacak sentimen dana yang dikelola secara aktif.
Pengajuan 13D/G
Kami menyajikan pengajuan 13D/G secara terpisah dari pengajuan 13F karena perlakuan yang berbeda oleh SEC. Pengajuan 13D/G dapat diajukan oleh kelompok investor (dengan satu pemimpin), sedangkan pengajuan 13F tidak bisa. Hal ini mengakibatkan situasi di mana seorang investor dapat mengajukan 13D/G yang melaporkan satu nilai untuk total saham (mewakili semua saham yang dimiliki oleh kelompok investor), tetapi kemudian mengajukan 13F yang melaporkan nilai yang berbeda untuk total saham (mewakili kepemilikan mereka sendiri). Ini berarti bahwa kepemilikan saham dari pengajuan 13D/G dan pengajuan 13F seringkali tidak dapat dibandingkan secara langsung, sehingga kami menyajikannya secara terpisah.
Catatan: Mulai 16 Mei 2021, kami tidak lagi menampilkan pemilik yang belum mengajukan 13D/G dalam setahun terakhir. Sebelumnya, kami menampilkan riwayat lengkap pengajuan 13D/G. Secara umum, entitas yang diwajibkan untuk mengajukan pengajuan 13D/G harus mengajukan setidaknya setiap tahun sebelum mengirimkan pengajuan penutupan. Namun, terkadang dana keluar dari posisi tanpa mengirimkan pengajuan penutupan (misalnya, mereka menghentikan operasi), sehingga menampilkan riwayat lengkap terkadang menyebabkan kebingungan tentang kepemilikan saat ini. Untuk mencegah kebingungan, kami sekarang hanya menampilkan pemilik 'saat ini' - yaitu - pemilik yang telah mengajukan dalam setahun terakhir.
Upgrade to unlock premium data.
| Tanggal File | Formulir | Investor | Sebelumnya Saham |
Terbaru Saham |
Δ Saham (Persen) |
Kepemilikan (Persen) |
Δ Pagmamay-ari (Persen) |
|
|---|---|---|---|---|---|---|---|---|
| 2024-11-14 | Global X Management CO LLC | 34,648,600 | 6.14 |
Pengajuan 13F dan NPORT
Detail pada pengajuan 13F tersedia gratis. Detail pada pengajuan NP memerlukan keanggotaan premium. Baris berwarna hijau menunjukkan posisi baru. Baris berwarna merah menunjukkan posisi yang sudah ditutup. Klik tautan ini ikon untuk melihat riwayat transaksi selengkapnya.
Tingkatkan
untuk membuka data premium dan mengekspor ke Excel ![]() .
.
| Tanggal File | Sumber | Investor | Ketik | Presyo ng Avg (Silangan) |
Saham | Δ Saham (%) |
Dilaporkan Nilai ($1000) |
Nilai Δ (%) |
Alokasi Port (%) |
|
|---|---|---|---|---|---|---|---|---|---|---|
| 2025-04-08 | 13F | Rothschild Investment Llc | 0 | -100.00 | 0 | |||||
| 2025-05-14 | 13F | CIBC World Markets Inc. | Call | 0 | -100.00 | 0 | -100.00 | |||
| 2025-07-25 | 13F | JustInvest LLC | 36,833 | 139.36 | 256 | 269.57 | ||||
| 2025-08-13 | 13F | Russell Investments Group, Ltd. | 1,034,729 | 336.85 | 7,176 | 576.34 | ||||
| 2025-08-14 | 13F | Mariner, LLC | 16,304 | -6.14 | 113 | 44.87 | ||||
| 2025-07-24 | 13F | Financial Security Advisor, Inc. | 10,164 | 0.00 | 71 | 55.56 | ||||
| 2025-05-15 | 13F | Options Solutions, Llc | 0 | -100.00 | 0 | |||||
| 2025-08-07 | 13F | Tacita Capital Inc | 1,409 | 0.00 | 10 | 50.00 | ||||
| 2025-05-14 | 13F | OMERS ADMINISTRATION Corp | 0 | -100.00 | 0 | |||||
| 2025-08-14 | 13F | J. Goldman & Co LP | Call | 0 | -100.00 | 0 | ||||
| 2025-08-13 | 13F | Grantham, Mayo, Van Otterloo & Co. LLC | 9,219,454 | 18.01 | 63,918 | 82.56 | ||||
| 2025-08-14 | 13F | J. Goldman & Co LP | 0 | -100.00 | 0 | |||||
| 2025-08-25 | NP | MVALX - MERIDIAN CONTRARIAN FUND Legacy Class | 536,655 | 10.96 | 3,724 | 71.53 | ||||
| 2025-05-15 | 13F | Centiva Capital, LP | 0 | -100.00 | 0 | -100.00 | ||||
| 2025-08-07 | 13F | Compass Rose Asset Management, LP | 100,000 | 694 | ||||||
| 2025-08-13 | 13F | Marshall Wace, Llp | 6,204,620 | 15.60 | 43,060 | 78.68 | ||||
| 2025-08-26 | NP | DSMDX - Driehaus Small/Mid Cap Growth Fund | 82,553 | 48.15 | 573 | 128.80 | ||||
| 2025-08-14 | 13F | Susquehanna International Group, Llp | 1,484,462 | 17.88 | 10,302 | 82.21 | ||||
| 2025-08-14 | 13F | Susquehanna International Group, Llp | Call | 959,800 | -72.91 | 6,661 | -58.13 | |||
| 2025-08-14 | 13F | Susquehanna International Group, Llp | Put | 835,100 | -68.93 | 5,796 | -51.98 | |||
| 2025-08-14 | 13F | GeoSphere Capital Management | 300,000 | 2,082 | ||||||
| 2025-07-17 | 13F | Ausbil Investment Management Ltd | 107,000 | 72.58 | 743 | 166.91 | ||||
| 2025-08-14 | 13F | Qube Research & Technologies Ltd | 0 | -100.00 | 0 | |||||
| 2025-07-25 | NP | FILL - iShares MSCI Global Energy Producers ETF | 16,537 | -5.62 | 102 | 9.78 | ||||
| 2025-07-31 | 13F | Cambridge Investment Research Advisors, Inc. | 23,560 | -40.69 | 0 | |||||
| 2025-05-14 | 13F | Peak6 Llc | 0 | -100.00 | 0 | -100.00 | ||||
| 2025-08-13 | 13F | ExodusPoint Capital Management, LP | 500,654 | 3 | ||||||
| 2025-08-14 | 13F | MIRAE ASSET GLOBAL ETFS HOLDINGS Ltd. | 29,419,345 | -13.45 | 203,963 | 33.89 | ||||
| 2025-07-23 | 13F | Vontobel Holding Ltd. | 50,183 | -1.35 | 349 | 52.63 | ||||
| 2025-08-14 | 13F | Turim 21 Investimentos Ltda. | 123,215 | 0.00 | 855 | 54.61 | ||||
| 2025-08-05 | 13F | Bank Of Montreal /can/ | 2,001,209 | -2.03 | 13,911 | 51.92 | ||||
| 2025-08-13 | 13F | 1832 Asset Management L.P. | 2,382,176 | -10.15 | 16,532 | 38.88 | ||||
| 2025-08-14 | 13F | Balyasny Asset Management Llc | 438,447 | -22.28 | 3,043 | 20.09 | ||||
| 2025-05-09 | 13F | CenterBook Partners LP | 0 | -100.00 | 0 | |||||
| 2025-08-14 | 13F | Group One Trading, L.p. | Put | 142,200 | -2.34 | 987 | 51.00 | |||
| 2025-03-21 | NP | PASIX - PACE Alternative Strategies Investments Class A | Short | -15,600 | -102 | |||||
| 2025-05-15 | 13F | Oxford Asset Management Llp | 23,718 | -21.88 | 106 | -47.00 | ||||
| 2025-06-26 | NP | KGGAX - KOPERNIK GLOBAL ALL-CAP FUND CLASS A SHARES | 2,419,938 | 140.09 | 12,656 | 108.06 | ||||
| 2025-06-25 | NP | CDAZX - Multi-Manager Directional Alternative Strategies Fund Institutional Class | 0 | -100.00 | 0 | -100.00 | ||||
| 2025-07-30 | NP | TGFRX - TANAKA Growth Fund Class R | 190,889 | -29.01 | 1,174 | -17.63 | ||||
| 2025-08-14 | 13F | Alliancebernstein L.p. | 2,836,189 | -8.40 | 19,683 | 41.59 | ||||
| 2025-08-14 | 13F | Driehaus Capital Management Llc | 3,360,064 | 48.73 | 23,319 | 129.89 | ||||
| 2025-06-18 | NP | RMYAX - Multi-Strategy Income Fund Class A | 10,417 | 54 | ||||||
| 2025-08-14 | 13F | Masters Capital Management Llc | 2,000,000 | 0.00 | 13,880 | 54.57 | ||||
| 2025-08-13 | 13F | Lido Advisors, LLC | 10,100 | -1.57 | 70 | 52.17 | ||||
| 2025-08-12 | 13F | Deutsche Bank Ag\ | 30,968 | 0.00 | 215 | 53.96 | ||||
| 2025-08-12 | 13F | Winnow Wealth Llc | 143,635 | 997 | ||||||
| 2025-06-26 | NP | AMTAX - AB All Market Real Return Portfolio Class A | 66,540 | 348 | ||||||
| 2025-06-26 | NP | TIOIX - TIAA-CREF International Opportunities Fund Institutional Class | 0 | -100.00 | 0 | -100.00 | ||||
| 2025-08-11 | 13F | Persistent Asset Partners Ltd | 278,082 | 7.52 | 1,931 | 66.38 | ||||
| 2025-08-13 | 13F | Northwest & Ethical Investments L.P. | 102,831 | 23.27 | 707 | 88.77 | ||||
| 2025-08-12 | 13F | Franklin Resources Inc | 31,248 | -5.37 | 217 | 46.62 | ||||
| 2025-08-11 | 13F | Citigroup Inc | 442,128 | 1,963.51 | 3,065 | 3,092.71 | ||||
| 2025-08-14 | 13F | Anson Funds Management LP | 0 | -100.00 | 0 | |||||
| 2025-05-15 | 13F | Scopus Asset Management, L.p. | 0 | -100.00 | 0 | |||||
| 2025-08-27 | NP | TIFF INVESTMENT PROGRAM - TIFF Multi-Asset Fund | 140,419 | 93.68 | 975 | 199.69 | ||||
| 2025-07-22 | NP | DSMFX - Destinations Small-Mid Cap Equity Fund Class I | 221,760 | 11.21 | 1,370 | 29.98 | ||||
| 2025-08-14 | 13F | Kingdon Capital Management, L.l.c. | 1,977,837 | 5.33 | 13,726 | 62.80 | ||||
| 2025-08-14 | 13F | Hood River Capital Management LLC | 0 | -100.00 | 0 | |||||
| 2025-08-14 | 13F | Citadel Advisors Llc | 685,673 | -90.57 | 4,759 | -85.42 | ||||
| 2025-08-14 | 13F | Citadel Advisors Llc | Call | 2,727,800 | 2,353.06 | 18,931 | 3,693.59 | |||
| 2025-08-14 | 13F | Citadel Advisors Llc | Put | 4,217,400 | 0.09 | 29,269 | 54.70 | |||
| 2025-08-12 | 13F | Aviso Financial Inc. | 2,476 | 0.00 | 17 | 54.55 | ||||
| 2025-05-12 | 13F | Aigen Investment Management, Lp | 0 | -100.00 | 0 | |||||
| 2025-08-11 | 13F | Sprott Inc. | 419,240 | 3.55 | 2,917 | 60.54 | ||||
| 2025-08-14 | 13F | SummitTX Capital, L.P. | 265,111 | 1,840 | ||||||
| 2025-08-12 | 13F | Dynamic Technology Lab Private Ltd | 52,519 | 364 | ||||||
| 2025-08-14 | 13F | Lloyd Harbor Capital Management, LLC | Call | 0 | -100.00 | 0 | -100.00 | |||
| 2025-07-29 | 13F | Violich Capital Management, Inc. | 45,400 | -50.16 | 315 | |||||
| 2025-08-01 | 13F | Jennison Associates Llc | 379,576 | -4.53 | 2,639 | 48.04 | ||||
| 2025-08-14 | 13F | PenderFund Capital Management Ltd. | 11,600 | 0.00 | 81 | -87.90 | ||||
| 2025-06-27 | NP | MGNR - American Beacon GLG Natural Resources ETF | 233,980 | 47.58 | 1,224 | 17.60 | ||||
| 2025-08-06 | 13F | Stone House Investment Management, LLC | 0 | -100.00 | 0 | -100.00 | ||||
| 2025-08-14 | 13F | CIBC World Markets Inc. | 80,334 | -39.95 | 559 | -6.84 | ||||
| 2025-08-13 | 13F | Bank Of Nova Scotia | 0 | -100.00 | 0 | -100.00 | ||||
| 2025-08-07 | 13F | Zurcher Kantonalbank (Zurich Cantonalbank) | 222,927 | 20.23 | 1,546 | 86.14 | ||||
| 2025-08-13 | 13F | Falcon Edge Capital, LP | 753,195 | 56.23 | 5,227 | 141.54 | ||||
| 2025-05-07 | 13F | Fiera Capital Corp | 0 | -100.00 | 0 | |||||
| 2025-05-28 | NP | QCGLRX - Global Equities Account Class R1 | 0 | -100.00 | 0 | -100.00 | ||||
| 2025-08-12 | 13F | Goehring & Rozencwajg Associates, LLC | 1,445,108 | -1.89 | 10,029 | 35.11 | ||||
| 2025-08-12 | 13F | CIBC Private Wealth Group, LLC | 2,400 | 0.00 | 17 | 77.78 | ||||
| 2025-08-06 | 13F | Pekin Hardy Strauss, Inc. | 169,200 | 5.62 | 1,174 | 63.28 | ||||
| 2025-08-14 | 13F | Voya Investment Management Llc | 675,717 | -23.16 | 4,689 | 18.77 | ||||
| 2025-08-12 | 13F | Proequities, Inc. | Put | 0 | 0 | |||||
| 2025-05-14 | 13F | PineBridge Investments, L.P. | 0 | -100.00 | 0 | |||||
| 2025-08-12 | 13F | Proequities, Inc. | 0 | 0 | ||||||
| 2025-08-14 | 13F | Raymond James Financial Inc | Put | 6,900 | 41 | |||||
| 2025-06-26 | NP | KGIIX - KOPERNIK INTERNATIONAL FUND CLASS I SHARES | 1,248,830 | 6,531 | ||||||
| 2025-08-14 | 13F | BRITISH COLUMBIA INVESTMENT MANAGEMENT Corp | 345,664 | 7.87 | 2,403 | 67.27 | ||||
| 2025-08-14 | 13F | ArrowMark Colorado Holdings LLC | 536,655 | 10.96 | 3,724 | 71.53 | ||||
| 2025-08-14 | 13F | Raymond James Financial Inc | 839,080 | 31.29 | 5,823 | 102.96 | ||||
| 2025-08-14 | 13F | Tudor Investment Corp Et Al | 39,690 | 275 | ||||||
| 2025-08-13 | 13F | Tejara Capital Ltd | 385,469 | -19.45 | 2,675 | 24.53 | ||||
| 2025-08-13 | 13F | Quantbot Technologies LP | 150,216 | -81.34 | 1,042 | -71.18 | ||||
| 2025-08-25 | NP | AMERICAN FUNDS INSURANCE SERIES - Global Small Capitalization Fund Class 1 This fund is a listed as child fund of Capital World Investors and if that institution has disclosed ownership in this security, then these positions will not be double counted when calculating total shares and total value | 380,341 | 38.01 | 2,640 | 113.34 | ||||
| 2025-08-14 | 13F | Cinctive Capital Management LP | 831,675 | 5,772 | ||||||
| 2025-07-14 | 13F | Legacy Capital Group California, Inc. | 76,530 | 47.76 | 531 | 128.88 | ||||
| 2025-07-24 | 13F | Us Bancorp \de\ | 14,430 | 0.00 | 100 | 56.25 | ||||
| 2025-08-14 | 13F | Caption Management, LLC | 176,187 | 1,882.97 | 1,223 | 3,033.33 | ||||
| 2025-07-14 | 13F | Pacifica Partners Inc. | 21,000 | 0.00 | 143 | 52.13 | ||||
| 2025-08-14 | 13F | Nokomis Capital, L.L.C. | 1,564,848 | 8.67 | 10,860 | 67.98 | ||||
| 2025-07-24 | 13F | U S Global Investors Inc | 0 | -100.00 | 0 | -100.00 | ||||
| 2025-08-12 | 13F | Fulcrum Asset Management LLP | 12,556 | 87 | ||||||
| 2025-08-19 | 13F/A | L1 Capital Pty Ltd | 33,816,063 | 10.35 | 234,683 | 70.84 | ||||
| 2025-05-14 | 13F/A | Norges Bank | 144,496 | 1,124 | ||||||
| 2025-08-13 | 13F | Flow Traders U.s. Llc | 10,903 | 0 | ||||||
| 2025-08-14 | 13F | Peak6 Llc | Put | 425,100 | 2,950 | |||||
| 2025-08-14 | 13F | Peak6 Llc | Call | 3,019,000 | 174.23 | 20,952 | 323.85 | |||
| 2025-08-13 | 13F | Walleye Capital LLC | 45,443 | 315 | ||||||
| 2025-08-13 | 13F | Walleye Capital LLC | Call | 84,700 | -39.11 | 588 | -5.93 | |||
| 2025-08-13 | 13F | Walleye Capital LLC | Put | 87,900 | 24.15 | 610 | 92.43 | |||
| 2025-07-21 | 13F | Azarias Capital Management, L.P. | 1,414,414 | -20.92 | 9,816 | 22.23 | ||||
| 2025-07-25 | NP | WSML - iShares MSCI World Small-Cap ETF | 31,031 | 191 | ||||||
| 2025-08-27 | NP | TPDAX - Timothy Plan Defensive Strategies Fund Class A | 7,557 | 0.00 | 52 | 57.58 | ||||
| 2025-07-31 | 13F | Anthracite Investment Company, Inc. | 1,314,887 | 0.00 | 9,125 | 54.58 | ||||
| 2025-08-14 | 13F | Macquarie Group Ltd | 95,209 | 13.21 | 661 | 75.07 | ||||
| 2025-08-12 | 13F | Virtu Financial LLC | 128,096 | 1 | ||||||
| 2025-07-14 | 13F | AdvisorNet Financial, Inc | 3,343 | 47.53 | 23 | 130.00 | ||||
| 2025-08-08 | 13F | Alberta Investment Management Corp | 0 | -100.00 | 0 | -100.00 | ||||
| 2025-08-14 | 13F | CoreCommodity Management, LLC | 114,498 | -65.29 | 795 | -46.39 | ||||
| 2025-08-14 | 13F | Bnp Paribas | 0 | -100.00 | 0 | -100.00 | ||||
| 2025-05-15 | 13F | BW Gestao de Investimentos Ltda. | Put | 0 | -100.00 | 0 | -100.00 | |||
| 2025-08-29 | NP | FTWO - Strive FAANG 2.0 ETF | 24,001 | 24.29 | 167 | 93.02 | ||||
| 2025-08-07 | 13F | Rathbone Brothers plc | 33,131 | 0.00 | 230 | 54.73 | ||||
| 2025-08-14 | 13F | Millennium Management Llc | 5,122,491 | 24.89 | 35,563 | 93.21 | ||||
| 2025-08-14 | 13F | Schonfeld Strategic Advisors LLC | 42,622 | 139.45 | 296 | 273.42 | ||||
| 2025-08-14 | 13F | Mountaineer Partners Management, LLC | 564,507 | 0.00 | 3,918 | 54.58 | ||||
| 2025-05-14 | 13F | Group One Trading, L.p. | 0 | -100.00 | 0 | -100.00 | ||||
| 2025-08-19 | 13F | Advisory Services Network, LLC | 16,650 | -33.40 | 112 | -0.89 | ||||
| 2025-08-14 | 13F | Jane Street Group, Llc | 1,053,129 | 579.20 | 7,309 | 950.00 | ||||
| 2025-08-25 | NP | SMCWX - SMALLCAP WORLD FUND INC Class A | 2,783,977 | 28.75 | 19,321 | 99.01 | ||||
| 2025-08-12 | 13F | Accordant Advisory Group Inc | 143,635 | 3.18 | 997 | 59.36 | ||||
| 2025-04-30 | 13F | Silphium Asset Management Ltd | 0 | -100.00 | 0 | |||||
| 2025-07-23 | 13F | Rye Brook Capital LLC | 767,900 | 6.27 | 5 | 66.67 | ||||
| 2025-08-14 | 13F | Freshford Capital Management, LLC | 1,117,852 | 7,758 | ||||||
| 2025-08-27 | 13F/A | Squarepoint Ops LLC | Put | 0 | -100.00 | 0 | -100.00 | |||
| 2025-08-13 | 13F | Beacon Pointe Advisors, LLC | 37,000 | 117.65 | 257 | 236.84 | ||||
| 2025-08-14 | 13F | Cibc World Markets Corp | 104,500 | -59.81 | 725 | -37.87 | ||||
| 2025-05-12 | 13F | Telemark Asset Management, LLC | 0 | -100.00 | 0 | |||||
| 2025-06-25 | NP | CCNR - ALPS | CoreCommodity Natural Resources ETF | 368,679 | 1,850.99 | 1,928 | 1,867.35 | ||||
| 2025-08-08 | 13F | Garnet Equity Capital Holdings, Inc. | 400,000 | -20.00 | 2,776 | 23.65 | ||||
| 2025-04-17 | 13F | Janney Montgomery Scott LLC | 0 | -100.00 | 0 | |||||
| 2025-08-01 | 13F | Vision Financial Markets Llc | 40 | 0.00 | 0 | |||||
| 2025-05-15 | 13F | Engineers Gate Manager LP | 0 | -100.00 | 0 | |||||
| 2025-08-14 | 13F | CoreCap Advisors, LLC | 8,748 | 0.10 | 61 | 53.85 | ||||
| 2025-07-14 | 13F | Kapitalo Investimentos Ltda | 1,608,804 | 54.83 | 11,165 | 139.34 | ||||
| 2025-08-14 | 13F | Ubs Asset Management Americas Inc | 677,541 | -3.90 | 4,702 | 48.56 | ||||
| 2025-08-14 | 13F | Bnp Paribas Arbitrage, Sa | 928,237 | 1,674.39 | 6,442 | 2,652.56 | ||||
| 2025-08-08 | 13F | Pnc Financial Services Group, Inc. | 0 | -100.00 | 0 | -100.00 | ||||
| 2025-07-30 | 13F | FNY Investment Advisers, LLC | Call | 0 | -100.00 | 0 | ||||
| 2025-08-13 | 13F | BCJ Capital Management, LLC | 0 | -100.00 | 0 | -100.00 | ||||
| 2025-05-15 | 13F | Polar Asset Management Partners Inc. | 0 | -100.00 | 0 | -100.00 | ||||
| 2025-08-13 | 13F | Jones Financial Companies Lllp | 8,311 | 26.98 | 57 | 93.10 | ||||
| 2025-07-11 | 13F | Farther Finance Advisors, LLC | 58 | 0.00 | 0 | |||||
| 2025-08-18 | 13F | Wolverine Trading, Llc | 114,194 | 549.12 | 777 | 870.00 | ||||
| 2025-04-22 | 13F | Madison Wealth Partners, Inc | 0 | -100.00 | 0 | -100.00 | ||||
| 2025-08-14 | 13F | Sig Brokerage, Lp | 13,769 | -15.88 | 96 | 30.14 | ||||
| 2025-08-11 | 13F | Vanguard Group Inc | 20,923,707 | -0.16 | 145,357 | 54.75 | ||||
| 2025-08-13 | 13F | Invesco Ltd. | 26,153 | -2.02 | 182 | 52.10 | ||||
| 2025-08-18 | 13F | Wolverine Trading, Llc | Call | 278,200 | 42.74 | 1,892 | 113.43 | |||
| 2025-08-18 | 13F | Wolverine Trading, Llc | Put | 91,700 | -26.11 | 624 | 10.46 | |||
| 2025-08-12 | 13F | Catalyst Funds Management Pty Ltd | 223,300 | 1,550 | ||||||
| 2025-07-30 | 13F | FNY Investment Advisers, LLC | 14,606 | 0 | ||||||
| 2025-07-16 | 13F | St Germain D J Co Inc | 1,000 | 0.00 | 7 | 50.00 | ||||
| 2025-08-15 | 13F | Ion Asset Management Ltd. | 67,000 | 465 | ||||||
| 2025-08-14 | 13F | Mpwm Advisory Solutions, Llc | 1,400 | 0.00 | 10 | 50.00 | ||||
| 2025-08-13 | 13F | Renaissance Technologies Llc | 2,958,800 | -31.72 | 20,534 | 5.54 | ||||
| 2025-05-13 | 13F | EverSource Wealth Advisors, LLC | 0 | -100.00 | 0 | |||||
| 2025-08-11 | 13F | Banque Cantonale Vaudoise | 67,454 | 0 | ||||||
| 2025-08-05 | 13F | Ninepoint Partners LP | 380,000 | 0.00 | 2,637 | 54.57 | ||||
| 2025-08-14 | 13F | Bank Of America Corp /de/ | 411,039 | -81.91 | 2,853 | -72.04 | ||||
| 2025-08-14 | 13F | Nebula Research & Development LLC | 113,708 | 22.69 | 789 | 89.66 | ||||
| 2025-08-18 | 13F/A | National Bank Of Canada /fi/ | 534,523 | 42.37 | 3,693 | 120.68 | ||||
| 2025-07-25 | NP | SCHC - Schwab International Small-Cap Equity ETF This fund is a listed as child fund of Charles Schwab Investment Management Inc and if that institution has disclosed ownership in this security, then these positions will not be double counted when calculating total shares and total value | 981,353 | -1.00 | 6,038 | 15.01 | ||||
| 2025-08-15 | 13F | Kestra Advisory Services, LLC | 12,065 | -41.68 | 84 | -9.78 | ||||
| 2025-05-15 | 13F | Millennium Management Llc | Call | 0 | -100.00 | 0 | -100.00 | |||
| 2025-09-04 | 13F/A | Advisor Group Holdings, Inc. | 35,057 | 5.74 | 243 | 64.19 | ||||
| 2025-04-18 | 13F | PKO Investment Management Joint-Stock Co | 0 | -100.00 | 0 | |||||
| 2025-08-13 | 13F | Scotia Capital Inc. | 132,377 | 367.35 | 909 | 626.40 | ||||
| 2025-08-28 | NP | QCSTRX - Stock Account Class R1 | 424,986 | -8.85 | 2,952 | 41.31 | ||||
| 2025-08-12 | 13F | Charles Schwab Investment Management Inc | 949,367 | -3.52 | 6,582 | 49.26 | ||||
| 2025-07-24 | 13F | Blair William & Co/il | 13,921 | 0.00 | 97 | 54.84 | ||||
| 2025-08-14 | 13F | Jane Street Group, Llc | Put | 52,800 | 98.50 | 366 | 207.56 | |||
| 2025-08-14 | 13F | Jane Street Group, Llc | Call | 394,500 | -71.43 | 2,738 | -55.84 | |||
| 2025-08-14 | 13F | Goldman Sachs Group Inc | 4,504,768 | 50.81 | 31,263 | 133.11 | ||||
| 2025-08-14 | 13F | Lombard Odier Asset Management (USA) Corp | 221,504 | 1,537 | ||||||
| 2025-05-15 | 13F | Aquatic Capital Management LLC | 0 | -100.00 | 0 | |||||
| 2025-05-15 | 13F | Cubist Systematic Strategies, LLC | 0 | -100.00 | 0 | |||||
| 2025-07-14 | 13F | Southland Equity Partners LLC | 13,747 | 0.00 | 95 | 55.74 | ||||
| 2025-07-31 | 13F | Fielder Capital Group LLC | 323,375 | -1.83 | 2,244 | 51.72 | ||||
| 2025-08-13 | 13F | StoneX Group Inc. | 0 | -100.00 | 0 | -100.00 | ||||
| 2025-08-01 | 13F | Y-Intercept (Hong Kong) Ltd | 581,789 | 4,038 | ||||||
| 2025-08-14 | 13F | Graham Capital Management, L.P. | 0 | -100.00 | 0 | |||||
| 2025-08-25 | 13F/A | NewGen Asset Management Ltd | 1,200,000 | 8,328 | ||||||
| 2025-09-04 | 13F | SevenBridge Financial Group, LLC | 12,250 | 0.00 | 85 | 21.74 | ||||
| 2025-07-22 | 13F | Silver Lake Advisory, LLC | 11,000 | 0.00 | 76 | 55.10 | ||||
| 2025-08-11 | 13F | TD Waterhouse Canada Inc. | 122,933 | -14.17 | 826 | 27.27 | ||||
| 2025-08-11 | 13F | NewGen Equity Long/Short Fund | 1,200,000 | 8,328 | ||||||
| 2025-08-12 | 13F | Trexquant Investment LP | 374,836 | 302.00 | 2,601 | 522.25 | ||||
| 2025-05-15 | 13F | Verition Fund Management LLC | 0 | -100.00 | 0 | -100.00 | ||||
| 2025-07-29 | NP | GMOYX - GMO Resource Transition Fund Class VI | 469,000 | 76.98 | 2,891 | 106.94 | ||||
| 2025-08-04 | 13F | Muzinich & Co., Inc. | Call | 35,000 | 243 | |||||
| 2025-08-12 | 13F | Swiss National Bank | 1,040,200 | -0.59 | 7,198 | 53.38 | ||||
| 2025-05-15 | 13F | Philadelphia Financial Management of San Francisco, LLC | 0 | -100.00 | 0 | |||||
| 2025-08-14 | 13F | Black Maple Capital Management LP | 91,200 | 0.00 | 633 | 54.52 | ||||
| 2025-08-08 | 13F | Old West Investment Management, LLC | 2,534,801 | 29.74 | 17,604 | 100.68 | ||||
| 2025-08-12 | 13F | Steward Partners Investment Advisory, Llc | 15,336 | -39.71 | 106 | -7.02 | ||||
| 2025-08-08 | 13F | SBI Securities Co., Ltd. | 902 | 27.40 | 6 | 100.00 | ||||
| 2025-07-01 | 13F | Confluence Investment Management Llc | 69,649 | 483 | ||||||
| 2025-08-15 | 13F | Tower Research Capital LLC (TRC) | 10,036 | -88.69 | 70 | -82.66 | ||||
| 2025-07-23 | 13F | Tcfg Wealth Management, Llc | 62,500 | -0.79 | 434 | 53.55 | ||||
| 2025-05-12 | 13F | Operose Advisors LLC | 0 | -100.00 | 0 | |||||
| 2025-08-12 | 13F | XTX Topco Ltd | 89,291 | 620 | ||||||
| 2025-06-26 | NP | IDEV - iShares Core MSCI International Developed Markets ETF | 429,796 | 9.40 | 2,251 | -12.28 | ||||
| 2025-05-15 | 13F | Tanaka Capital Management Inc | 569,675 | -0.83 | 3 | -33.33 | ||||
| 2025-07-14 | 13F | UMA Financial Services, Inc. | 35 | 0.00 | 0 | |||||
| 2025-08-08 | 13F | Abc Arbitrage Sa | 43,359 | 9.72 | 301 | 69.49 | ||||
| 2025-07-29 | 13F | CapWealth Advisors, LLC | 14,000 | -33.33 | 97 | 3.19 | ||||
| 2025-08-14 | 13F | Cantor Fitzgerald, L. P. | 90,109 | 99.00 | 625 | 207.88 | ||||
| 2025-06-25 | NP | PGNAX - PGIM Jennison Natural Resources Fund Class A | 384,513 | 5.63 | 2,014 | -15.28 | ||||
| 2025-08-14 | 13F | Vident Advisory, LLC | 2,761,974 | 35.07 | 19,168 | 108.78 | ||||
| 2025-08-01 | 13F | Envestnet Asset Management Inc | 328,048 | 61.64 | 2,277 | 149.84 | ||||
| 2025-08-12 | 13F | Eisler Capital Management Ltd. | 33,873 | 235 | ||||||
| 2025-05-15 | 13F | Numerai GP LLC | 0 | -100.00 | 0 | |||||
| 2025-08-14 | 13F | Toronto Dominion Bank | 38,573 | 11.06 | 268 | 72.90 | ||||
| 2025-08-14 | 13F | Encompass Capital Advisors LLC | 3,651,140 | -12.09 | 25,353 | 36.06 | ||||
| 2025-05-15 | 13F | Mirabella Financial Services Llp | 0 | -100.00 | 0 | -100.00 | ||||
| 2025-07-29 | 13F | Stanley-Laman Group, Ltd. | 451,054 | -8.52 | 3,130 | 41.44 | ||||
| 2025-03-27 | NP | ASGCX - Allspring Global Long/Short Equity Fund Class C | Short | -127,800 | -834 | |||||
| 2025-08-04 | 13F | Beirne Wealth Consulting Services, LLC | 25,000 | 0.00 | 174 | 54.46 | ||||
| 2025-07-16 | 13F | ORG Partners LLC | 1,610 | -19.90 | 11 | 11.11 | ||||
| 2025-08-04 | 13F | Spire Wealth Management | 3,919 | -54.53 | 27 | -28.95 | ||||
| 2025-08-13 | 13F | Natixis Advisors, L.p. | 121,034 | 40.24 | 1 | |||||
| 2025-08-08 | 13F | Larson Financial Group LLC | 10,775 | 1.89 | 75 | 57.45 | ||||
| 2025-08-14 | 13F | Banque Transatlantique SA | 0 | -100.00 | 0 | |||||
| 2025-07-28 | 13F | Harbour Investments, Inc. | 0 | -100.00 | 0 | |||||
| 2025-08-14 | 13F | Banco BTG Pactual S.A. | 0 | -100.00 | 0 | |||||
| 2025-07-22 | 13F | IMC-Chicago, LLC | 230,357 | -23.07 | 1,599 | 18.90 | ||||
| 2025-08-14 | 13F | Parallax Volatility Advisers, L.P. | Call | 5,600 | -77.60 | 39 | -66.07 | |||
| 2025-07-22 | 13F | IMC-Chicago, LLC | Put | 232,400 | -17.71 | 1,613 | 27.23 | |||
| 2025-08-14 | 13F | Parallax Volatility Advisers, L.P. | 90,313 | 627 | ||||||
| 2025-08-14 | 13F | Parallax Volatility Advisers, L.P. | Put | 100,000 | 694 | |||||
| 2025-08-14 | 13F | GWM Advisors LLC | 142,691 | -5.77 | 990 | 45.80 | ||||
| 2025-08-14 | 13F | Optiver Holding B.V. | 35 | -65.69 | 0 | |||||
| 2025-08-08 | 13F | Gts Securities Llc | 39,182 | 272 | ||||||
| 2025-07-23 | 13F | Shell Asset Management Co | 29,602 | 2.21 | 0 | |||||
| 2025-04-22 | 13F | Packer & Co Ltd | 3,024,793 | 14 | ||||||
| 2025-08-14 | 13F/A | Barclays Plc | 143,039 | -0.73 | 1 | |||||
| 2025-08-05 | 13F | Simplex Trading, Llc | Put | 105,400 | -69.63 | 1 | -100.00 | |||
| 2025-08-05 | 13F | Simplex Trading, Llc | 280,171 | -9.61 | 2 | 0.00 | ||||
| 2025-08-14 | 13F | Wells Fargo & Company/mn | 413,531 | 12.04 | 2,870 | 73.35 | ||||
| 2025-07-31 | 13F | City State Bank | 0 | -100.00 | 0 | -100.00 | ||||
| 2025-08-14 | 13F | Van Eck Associates Corp | 18,327,861 | 6.22 | 127 | 64.94 | ||||
| 2025-08-14 | 13F | Ardsley Advisory Partners Lp | 50,000 | 347 | ||||||
| 2025-08-14 | 13F | Investment Management Corp of Ontario | 34,570 | -4.95 | 240 | 46.63 | ||||
| 2025-06-26 | NP | IXUS - iShares Core MSCI Total International Stock ETF | 699,713 | 0.83 | 3,665 | -19.13 | ||||
| 2025-04-23 | 13F | Harbour Capital Advisors, LLC | 0 | -100.00 | 0 | |||||
| 2025-08-28 | NP | SPDW - SPDR(R) Portfolio Developed World ex-US ETF | 416,465 | 2.77 | 2,887 | 58.98 | ||||
| 2025-08-08 | 13F | Geode Capital Management, Llc | 294,658 | 6.01 | 2,057 | 63.51 | ||||
| 2025-08-14 | 13F | Great Valley Advisor Group, Inc. | 11,016 | -7.35 | 76 | 43.40 | ||||
| 2025-07-29 | NP | GIMFX - GMO Implementation Fund | 192,000 | 77.29 | 1,184 | 107.18 | ||||
| 2025-06-24 | NP | TLTD - FlexShares Morningstar Developed Markets ex-US Factor Tilt Index Fund | 10,602 | 0.00 | 55 | -20.29 | ||||
| 2025-05-27 | NP | HRITX - Hood River International Opportunity Fund Retirement Shares | 151,291 | 66.77 | 679 | 13.55 | ||||
| 2025-07-22 | 13F | Kercheville Advisors, LLC | 10,000 | 69 | ||||||
| 2025-08-05 | 13F | Bank of New York Mellon Corp | 1,999,769 | -1.07 | 13,878 | 52.93 | ||||
| 2025-08-14 | 13F | CIBC Asset Management Inc | 656,798 | -19.68 | 4,561 | 24.41 | ||||
| 2025-05-27 | NP | HRNOX - Hood River New Opportunities Fund Institutional Shares | 154,249 | 34.47 | 693 | -8.59 | ||||
| 2025-07-09 | 13F | Dudley & Shanley, Inc. | 1,237,000 | 0.04 | 8,585 | 54.64 | ||||
| 2025-06-30 | NP | VFSNX - Vanguard FTSE All-World ex-US Small-Cap Index Fund Institutional Shares | 1,719,474 | -6.94 | 9,005 | -25.36 | ||||
| 2025-08-12 | 13F | Kimelman & Baird, LLC | 131 | 0.00 | 1 | |||||
| 2025-06-26 | NP | CCSO - Carbon Collective Climate Solutions U.S. Equity ETF | 28,015 | 3.38 | 147 | -17.51 | ||||
| 2025-08-27 | NP | URAN - Themes Uranium & Nuclear ETF | 51,444 | 41.77 | 357 | 120.37 | ||||
| 2025-08-14 | 13F | Arosa Capital Management LP | Call | 1,250,000 | 8,675 | |||||
| 2025-08-06 | 13F | First Horizon Advisors, Inc. | 2,000 | 0.00 | 14 | 62.50 | ||||
| 2025-08-14 | 13F | Atomi Financial Group, Inc. | 10,150 | -0.75 | 70 | 55.56 | ||||
| 2025-08-14 | 13F | Kopernik Global Investors, LLC | 1,760,522 | 12,218 | ||||||
| 2025-08-14 | 13F | Hancock Prospecting Pty Ltd | 5,750,000 | 39,975 | ||||||
| 2025-08-13 | 13F | De Lisle Partners LLP | 1,208,732 | 0.00 | 8,389 | 54.56 | ||||
| 2025-08-13 | 13F | Northwestern Mutual Wealth Management Co | 13 | 0 | ||||||
| 2025-08-14 | 13F | Arosa Capital Management LP | 714,200 | 5.32 | 4,957 | 62.81 | ||||
| 2025-08-13 | 13F | Pictet Asset Management Holding SA | 99,362 | 1.44 | 688 | 56.72 | ||||
| 2025-08-12 | 13F | Fulcrum Asset Management LLP | Put | 0 | -100.00 | 0 | -100.00 | |||
| 2025-07-07 | 13F | Versant Capital Management, Inc | 1 | 0 | ||||||
| 2025-07-21 | 13F | Matauro, Llc | 12,858 | 1.57 | 89 | 58.93 | ||||
| 2025-05-12 | 13F | Fiduciary Family Office, Llc | 0 | -100.00 | 0 | -100.00 | ||||
| 2025-05-12 | 13F | Fiduciary Family Office, Llc | Put | 0 | -100.00 | 0 | -100.00 | |||
| 2025-05-05 | 13F | Archer Investment Corp | 0 | -100.00 | 0 | |||||
| 2025-07-22 | NP | GRHIX - Goehring & Rozencwajg Resources Fund Institutional Class Shares | 778,616 | 0.00 | 4,812 | 16.83 | ||||
| 2025-07-16 | 13F | Eagle Global Advisors Llc | 55,000 | 0.00 | 382 | 54.88 | ||||
| 2025-08-13 | 13F | Bridgewater Associates, LP | 1,289,750 | -47.02 | 8,951 | -18.11 | ||||
| 2025-06-26 | NP | PDAVX - PineBridge Dynamic Asset Allocation Fund Investor Servicing Shares | 0 | -100.00 | 0 | -100.00 | ||||
| 2025-08-28 | NP | NANR - SPDR S&P North American Natural Resources ETF | 80,459 | -8.33 | 558 | 41.73 | ||||
| 2025-08-11 | 13F | HighTower Advisors, LLC | 19,555 | -11.28 | 136 | -12.34 | ||||
| 2025-08-13 | 13F | Capital Research Global Investors | 3,164,318 | 29.80 | 21,960 | 100.64 | ||||
| 2025-08-12 | 13F | Legal & General Group Plc | 674,866 | 8.24 | 4,679 | 67.47 | ||||
| 2025-08-14 | 13F | Moore Capital Management, Lp | 632,651 | -22.21 | 4,393 | 20.39 | ||||
| 2025-08-06 | 13F | MMCAP International Inc. SPC | 2,006,125 | 91.06 | 13,923 | 195.33 | ||||
| 2025-05-14 | 13F | Ameriprise Financial Inc | 0 | -100.00 | 0 | |||||
| 2025-06-18 | NP | RTXAX - Tax-Managed Real Assets Fund Class A | 445,636 | 54.23 | 2,334 | 23.70 | ||||
| 2025-08-27 | NP | VTMGX - Vanguard Developed Markets Index Fund Admiral Shares | 4,731,607 | -0.53 | 32,870 | 54.17 | ||||
| 2025-08-07 | 13F | Allworth Financial LP | 1,629 | 11 | ||||||
| 2025-08-12 | 13F | Picton Mahoney Asset Management | 1,010,456 | 7 | ||||||
| 2025-08-25 | NP | SPROTT FUNDS TRUST - Sprott Junior Uranium Miners ETF | 5,068,284 | 13.34 | 35,174 | 75.19 | ||||
| 2025-08-13 | 13F | Hsbc Holdings Plc | 0 | -100.00 | 0 | |||||
| 2025-08-14 | 13F | Segra Capital Management, LLC | 14,107,844 | 2.69 | 97,908 | 58.72 | ||||
| 2025-08-25 | NP | SETM - Sprott Energy Transition Materials ETF | 171,295 | 10.39 | 1,189 | 70.69 | ||||
| 2025-08-14 | 13F | Sunbelt Securities, Inc. | 400 | 0.00 | 3 | 100.00 | ||||
| 2025-08-12 | 13F | MAI Capital Management | 0 | -100.00 | 0 | |||||
| 2025-05-15 | 13F | Oxbow Capital Management (HK) Ltd | 0 | -100.00 | 0 | |||||
| 2025-08-14 | 13F | Janus Henderson Group Plc | 788,276 | -9.75 | 5,444 | 35.43 | ||||
| 2025-08-14 | 13F | Royal Bank Of Canada | Call | 15,400 | -96.58 | 107 | -94.71 | |||
| 2025-08-14 | 13F | Royal Bank Of Canada | 7,008,199 | 24.87 | 48,637 | 93.00 | ||||
| 2025-08-25 | 13F/A | Neuberger Berman Group LLC | 28,800 | 6.67 | 200 | 64.46 | ||||
| 2025-08-14 | 13F | Evergreen Capital Management Llc | 53,935 | 4.05 | 374 | 61.21 | ||||
| 2025-08-12 | 13F | BlackRock, Inc. | 128,642 | -2.50 | 893 | 50.68 | ||||
| 2025-05-14 | 13F | Caitlin John, LLC | 0 | -100.00 | 0 | |||||
| 2025-08-14 | 13F | Appian Way Asset Management LP | 0 | -100.00 | 0 | -100.00 | ||||
| 2025-08-14 | 13F | BW Gestao de Investimentos Ltda. | 388,200 | 2,694 | ||||||
| 2025-05-27 | NP | PSPFX - Global Resources Fund | 25,000 | 0.00 | 112 | -32.12 | ||||
| 2025-07-17 | 13F | Refined Wealth Management | 11,000 | 0.00 | 76 | 55.10 | ||||
| 2025-08-13 | 13F | Natixis | 86,906 | 6.23 | 599 | 66.39 | ||||
| 2025-05-15 | 13F | CAPROCK Group, Inc. | 70,000 | 0.00 | 314 | -32.03 | ||||
| 2025-08-06 | 13F | Titan Global Capital Management Usa Llc | 520,871 | 27.66 | 3,615 | 97.38 | ||||
| 2025-08-15 | 13F | Morgan Stanley | 1,611,126 | -7.18 | 11,181 | 43.47 | ||||
| 2025-08-14 | 13F | Two Sigma Securities, Llc | 0 | -100.00 | 0 | |||||
| 2025-05-15 | 13F | Mountain Lake Investment Management LLC | 0 | -100.00 | 0 | |||||
| 2025-08-12 | 13F | Pathstone Holdings, LLC | 0 | -100.00 | 0 | -100.00 | ||||
| 2025-06-26 | NP | FTIHX - Fidelity Total International Index Fund This fund is a listed as child fund of Fmr Llc and if that institution has disclosed ownership in this security, then these positions will not be double counted when calculating total shares and total value | 246,283 | 5.33 | 1,290 | -15.53 | ||||
| 2025-08-06 | 13F | Decker Retirement Planning Inc. | 0 | -100.00 | 0 | -100.00 | ||||
| 2025-08-12 | 13F | Rhumbline Advisers | 1 | 0.00 | 0 | |||||
| 2025-07-28 | 13F | Td Asset Management Inc | 3,298,902 | 30.06 | 22,871 | 101.21 | ||||
| 2025-08-12 | 13F | Nuveen, LLC | 406,142 | -12.89 | 2,816 | 34.75 | ||||
| 2025-08-15 | 13F | Caxton Associates Llp | 18,411 | -50.00 | 128 | -23.03 | ||||
| 2025-08-27 | 13F/A | Squarepoint Ops LLC | 138,762 | 0.00 | 963 | 54.57 | ||||
| 2025-07-30 | 13F | Cullen/frost Bankers, Inc. | 0 | -100.00 | 0 | -100.00 | ||||
| 2025-08-14 | 13F | Toroso Investments, LLC | 28,015 | 6.94 | 194 | 65.81 | ||||
| 2025-08-28 | NP | SMSAX - SIMT Multi-Strategy Alternative Fund Class F | 129,471 | 0.00 | 899 | 54.56 | ||||
| 2025-08-12 | 13F | Global Retirement Partners, LLC | 0 | -100.00 | 0 | |||||
| 2025-08-08 | 13F | Cetera Investment Advisers | 128,690 | 1.40 | 893 | 56.94 | ||||
| 2025-08-14 | 13F | Sei Investments Co | 51,611 | -80.73 | 358 | -70.22 | ||||
| 2025-08-13 | 13F | New Harbor Financial Group, LLC | 23,500 | -6.00 | 163 | 45.54 | ||||
| 2025-05-14 | 13F | Hartree Partners, LP | 0 | -100.00 | 0 | -100.00 | ||||
| 2025-08-05 | 13F | VGI Partners Ltd | 45,000 | -84.38 | 312 | -75.87 | ||||
| 2025-08-29 | NP | JOHN HANCOCK INVESTMENT TRUST - John Hancock Diversified Real Assets Fund Class NAV | 308,455 | -1.77 | 2,143 | 52.24 | ||||
| 2025-08-11 | 13F | Waratah Capital Advisors Ltd. | 3,539,978 | -5.93 | 24,567 | 45.39 | ||||
| 2025-08-28 | NP | IGE - iShares North American Natural Resources ETF | 128,638 | -2.50 | 893 | 50.68 | ||||
| 2025-06-27 | NP | URA - Global X Uranium ETF This fund is a listed as child fund of Mirae Asset Global Investments Co., Ltd. and if that institution has disclosed ownership in this security, then these positions will not be double counted when calculating total shares and total value | 28,921,688 | -12.89 | 151,173 | -30.51 | ||||
| 2025-08-14 | 13F | Lloyd Harbor Capital Management, LLC | 2,512,817 | -40.35 | 17,439 | -7.81 | ||||
| 2025-07-25 | NP | SCAVX - AB Small Cap Value Portfolio Class A | 754,110 | 0.00 | 4,660 | 16.82 | ||||
| 2025-07-29 | NP | GOFIX - GMO Resources Fund Class III | 3,688,339 | 61.44 | 22,737 | 88.72 | ||||
| 2025-08-07 | 13F | Campbell & CO Investment Adviser LLC | 54,858 | 91.84 | 381 | 196.88 | ||||
| 2025-08-11 | 13F | Private Advisor Group, LLC | 0 | -100.00 | 0 | -100.00 | ||||
| 2025-08-28 | NP | SSGVX - State Street Global Equity ex-U.S. Index Portfolio State Street Global All Cap Equity ex-U.S. Index Portfolio This fund is a listed as child fund of State Street Corp and if that institution has disclosed ownership in this security, then these positions will not be double counted when calculating total shares and total value | 141,500 | 0.00 | 981 | 54.73 | ||||
| 2025-06-18 | NP | RAZAX - Multi-Asset Growth Strategy Fund Class A | 24,361 | 127 | ||||||
| 2025-08-07 | 13F | Connor, Clark & Lunn Investment Management Ltd. | 1,728,160 | 97.82 | 12,013 | 206.77 | ||||
| 2025-08-12 | 13F | Jpmorgan Chase & Co | 5,007,555 | -8.67 | 34,752 | 41.17 | ||||
| 2025-08-15 | 13F | Raffles Associates Lp | 290,000 | -4.92 | 2,013 | 46.97 | ||||
| 2025-08-13 | 13F | Mackenzie Financial Corp | 250,763 | 7.41 | 1,743 | 66.63 | ||||
| 2025-08-14 | 13F | Altshuler Shaham Ltd | 36,490 | 28.99 | 253 | 99.21 | ||||
| 2025-08-28 | NP | SPGM - SPDR(R) Portfolio MSCI Global Stock Market ETF | 43,643 | 2.96 | 303 | 59.79 | ||||
| 2025-08-13 | 13F | Drummond Knight Asset Management Pty Ltd | 937,511 | 6,506 | ||||||
| 2025-08-14 | 13F | Polar Asset Management Partners Inc. | Call | 0 | -100.00 | 0 | ||||
| 2025-08-14 | 13F | Black Maple Capital Management LP | Call | 0 | -100.00 | 0 | ||||
| 2025-08-14 | 13F | D. E. Shaw & Co., Inc. | 197,002 | 701.37 | 1,367 | 1,142.73 | ||||
| 2025-08-08 | 13F | Keebeck Alpha, LP | 10,505 | 73 | ||||||
| 2025-07-15 | 13F | Public Employees Retirement System Of Ohio | 125,770 | -3.10 | 872 | 50.09 | ||||
| 2025-08-04 | 13F | Canton Hathaway, LLC | 8,200 | 0 | ||||||
| 2025-07-31 | 13F | Ground Swell Capital, LLC | 0 | -100.00 | 0 | -100.00 | ||||
| 2025-08-07 | 13F | PCJ Investment Counsel Ltd. | 746,400 | 131.70 | 5,186 | 259.07 | ||||
| 2025-08-11 | 13F | Alps Advisors Inc | 17,259,319 | 1.25 | 119,780 | 56.50 | ||||
| 2025-08-14 | 13F | Wexford Capital Lp | 28,040 | -28.27 | 195 | 10.86 | ||||
| 2025-08-14 | 13F | Headlands Technologies LLC | 12,165 | -73.49 | 84 | -59.22 | ||||
| 2025-08-14 | 13F | Federation des caisses Desjardins du Quebec | 367,784 | 14.05 | 2,525 | 75.96 | ||||
| 2025-08-11 | 13F | Aptus Capital Advisors, LLC | 12,281 | 0.00 | 85 | 54.55 | ||||
| 2025-08-15 | 13F | Great West Life Assurance Co /can/ | 253,311 | -45.35 | 2 | -50.00 | ||||
| 2025-08-14 | 13F | SIH Partners, LLLP | 0 | -100.00 | 0 | -100.00 | ||||
| 2025-08-14 | 13F | Fmr Llc | 39 | 0.00 | 0 | |||||
| 2025-08-14 | 13F | Man Group plc | 266,594 | 20.60 | 1,850 | 86.49 | ||||
| 2025-08-14 | 13F | Kerrisdale Advisers, LLC | 50,883 | 0.00 | 354 | 54.82 | ||||
| 2025-08-13 | 13F | Walleye Trading LLC | Call | 31,100 | 216 | |||||
| 2025-08-14 | 13F | Wiley Bros.-aintree Capital, Llc | 17,842 | 122 | ||||||
| 2025-08-13 | 13F | Walleye Trading LLC | Put | 13,900 | 96 | |||||
| 2025-07-31 | 13F | Caitong International Asset Management Co., Ltd | 1,716 | 485.67 | 12 | 1,000.00 | ||||
| 2025-08-25 | NP | MMYAX - MassMutual Select Small Company Value Fund Class A | 39,180 | -29.41 | 272 | 8.84 | ||||
| 2025-08-15 | 13F | Sender Co & Partners, Inc. | 25,989 | 180 | ||||||
| 2025-05-14 | 13F | New Harbor Financial Group, LLC | Put | 0 | -100.00 | 0 | -100.00 | |||
| 2025-08-13 | 13F | Walleye Trading LLC | 195,466 | 1,357 | ||||||
| 2025-08-18 | 13F/A | Nomura Holdings Inc | 30,543 | 120.27 | 212 | 240.32 | ||||
| 2025-07-22 | 13F | Sava Infond d.o.o. | 16,000 | 14.29 | 111 | 79.03 | ||||
| 2025-08-14 | 13F | Capstone Investment Advisors, Llc | 80,403 | 558 | ||||||
| 2025-08-21 | NP | NLR - VanEck Vectors Uranium+Nuclear Energy ETF | 10,586,553 | 10.62 | 73,471 | 70.98 | ||||
| 2025-08-05 | 13F | Huntington National Bank | 0 | -100.00 | 0 | -100.00 | ||||
| 2025-08-04 | 13F | Assetmark, Inc | 60 | 0.00 | 0 | |||||
| 2025-06-30 | NP | VGTSX - Vanguard Total International Stock Index Fund Investor Shares | 7,656,282 | 3.20 | 40,097 | -17.23 | ||||
| 2025-05-15 | 13F | Mercer Global Advisors Inc /adv | 0 | -100.00 | 0 | |||||
| 2025-08-14 | 13F | Royal Bank Of Canada | Put | 0 | -100.00 | 0 | -100.00 | |||
| 2025-06-30 | NP | VT - Vanguard Total World Stock Index Fund ETF Shares | 355,632 | 10.03 | 1,863 | -11.75 | ||||
| 2025-08-14 | 13F | Stifel Financial Corp | 84,614 | 587 | ||||||
| 2025-05-15 | 13F | Point72 Asset Management, L.P. | 0 | -100.00 | 0 | |||||
| 2025-08-14 | 13F | Empyrean Capital Partners, LP | 2,051,600 | 14,238 | ||||||
| 2025-05-14 | 13F | State of Wyoming | 0 | -100.00 | 0 | |||||
| 2025-05-27 | NP | VARIABLE INSURANCE PRODUCTS FUND - Stock Selector All Cap Portfolio Investor Class | 0 | -100.00 | 0 | -100.00 | ||||
| 2025-08-12 | 13F | LPL Financial LLC | 178,827 | 98.07 | 1,241 | 206.42 | ||||
| 2025-08-14 | 13F | Prelude Capital Management, Llc | 24,404 | 10.23 | 169 | 70.71 | ||||
| 2025-08-13 | 13F | Cooper Creek Partners Management Llc | 5,978,466 | 41 | ||||||
| 2025-08-14 | 13F | Hrt Financial Lp | 0 | -100.00 | 0 | |||||
| 2025-08-13 | 13F | Amundi | 817,740 | 633,806.98 | 5,544 | |||||
| 2025-08-14 | 13F | UBS Group AG | 1,951,170 | 154.32 | 13,541 | 293.18 | ||||
| 2025-08-14 | 13F | UBS Group AG | Put | 94,000 | 652 | |||||
| 2025-05-27 | NP | Fidelity Central Investment Portfolios LLC - Fidelity U.S. Equity Central Fund This fund is a listed as child fund of Fmr Llc and if that institution has disclosed ownership in this security, then these positions will not be double counted when calculating total shares and total value | 0 | -100.00 | 0 | -100.00 | ||||
| 2025-04-25 | NP | FSUTX - Utilities Portfolio This fund is a listed as child fund of Fmr Llc and if that institution has disclosed ownership in this security, then these positions will not be double counted when calculating total shares and total value | 0 | -100.00 | 0 | -100.00 | ||||
| 2025-08-11 | 13F | Bell Investment Advisors, Inc | 112 | 1 | ||||||
| 2025-08-14 | 13F | SIG North Trading, ULC | Call | 279,600 | 210.32 | 1,940 | 380.20 | |||
| 2025-08-14 | 13F | Manufacturers Life Insurance Company, The | 6,619,233 | -8.33 | 45,673 | 41.33 | ||||
| 2025-07-24 | 13F | Verde Servicos Internacionais S.A. | 125,000 | 1 | ||||||
| 2025-08-27 | NP | BBGSX - Bridge Builder Small/Mid Cap Growth Fund | 2,531,804 | 40.39 | 17,571 | 116.99 | ||||
| 2025-07-30 | 13F | DekaBank Deutsche Girozentrale | 11,651 | 318.35 | 0 | |||||
| 2025-08-25 | NP | Sprott Funds Trust - Sprott Uranium Miners Etf | 12,019,740 | -3.21 | 83,417 | 49.60 | ||||
| 2025-08-14 | 13F | SIG North Trading, ULC | Put | 159,300 | -12.95 | 1,106 | 34.59 | |||
| 2025-07-29 | NP | GCCHX - GMO Climate Change Fund Class III | 1,072,000 | 17.09 | 6,608 | 36.87 | ||||
| 2025-08-14 | 13F | SIG North Trading, ULC | 248,621 | 88.85 | 1,725 | 191.88 |