Mga Batayang Estadistika
| Saham Institusional (Jangka Panjang) | 174,308,174 - 31.43% (ex 13D/G) - change of -2.84MM shares -1.60% MRQ |
| Nilai Institusional (Jangka Panjang) | $ 5,359,349 USD ($1000) |
Kepemilikan Institusional dan Pemegang Saham
Amer Sports, Inc. (US:AS) memiliki 372 pemilik institusional dan pemegang saham yang telah mengajukan formulir 13D/G atau 13F kepada Komisi Bursa Efek (Securities Exchange Commission/SEC). Lembaga-lembaga ini memegang total 174,964,488 saham. Pemegang saham terbesar meliputi FountainVest China Capital Partners GP3 Ltd., Fmr Llc, D. E. Shaw & Co., Inc., Qube Research & Technologies Ltd, Viking Global Investors Lp, Brown Advisory Inc, Marshall Wace, Llp, BlackRock, Inc., Avala Global LP, and Arrowstreet Capital, Limited Partnership .
Struktur kepemilikan institusional Amer Sports, Inc. (NYSE:AS) menunjukkan posisi terkini di perusahaan oleh institusi dan dana, serta perubahan terbaru dalam ukuran posisi. Pemegang saham utama dapat mencakup investor individu, reksa dana, dana lindung nilai, atau institusi. Jadwal 13D menunjukkan bahwa investor memegang (atau pernah memegang) lebih dari 5% saham perusahaan dan bermaksud (atau pernah bermaksud) untuk secara aktif mengejar perubahan strategi bisnis. Jadwal 13G menunjukkan investasi pasif lebih dari 5%.
The share price as of September 5, 2025 is 36.56 / share. Previously, on September 9, 2024, the share price was 14.40 / share. This represents an increase of 153.89% over that period.

Skor Sentimen Dana
Skor Sentimen Dana (sebelumnya dikenal sebagai Skor Akumulasi Kepemilikan) menemukan saham-saham yang paling banyak dibeli oleh dana. Ini adalah hasil dari model kuantitatif multi-faktor yang canggih yang mengidentifikasi perusahaan dengan tingkat akumulasi institusional tertinggi. Model penilaian menggunakan kombinasi dari total peningkatan pemilik yang diungkapkan, perubahan dalam alokasi portofolio pada pemilik tersebut, dan metrik lainnya. Angka berkisar dari 0 hingga 100, dengan angka yang lebih tinggi menunjukkan tingkat akumulasi yang lebih tinggi dibandingkan dengan perusahaan sejenisnya, dan 50 adalah rata-ratanya.
Frekuensi Pembaruan: Setiap Hari
Lihat Ownership Explorer, yang menyediakan daftar perusahaan dengan peringkat tertinggi.
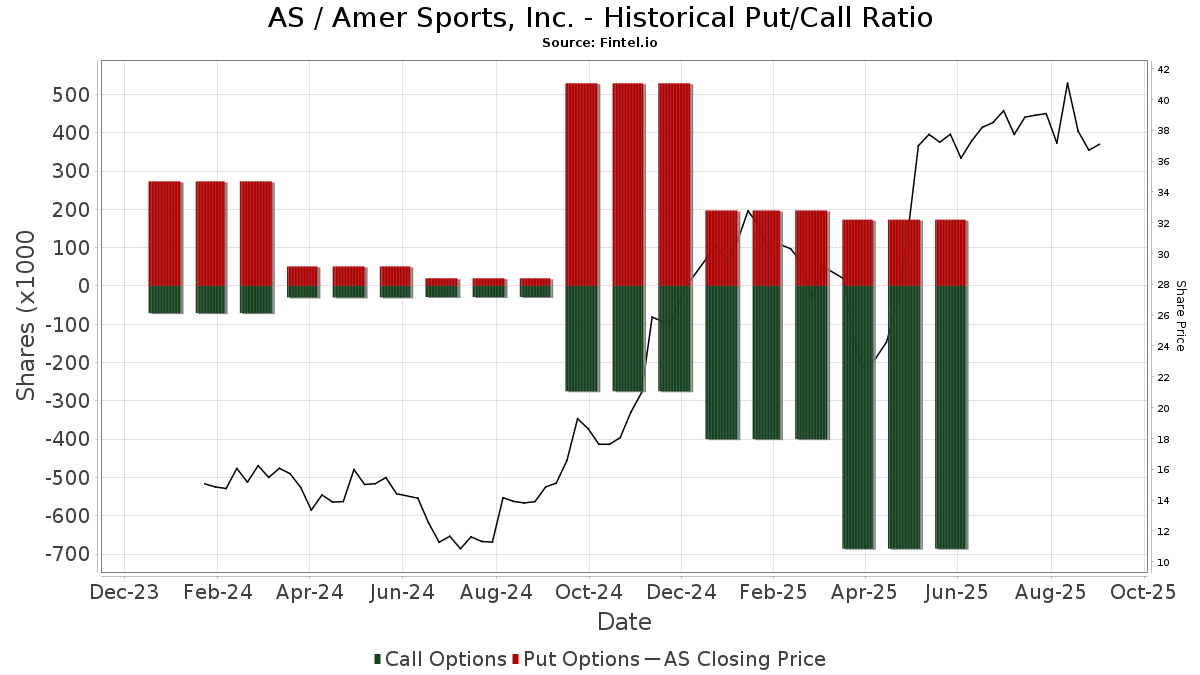
Rasio Put/Call Institusional
Selain melaporkan isu ekuitas dan utang standar, institusi dengan aset di bawah manajemen lebih dari 100 juta dolar AS juga harus mengungkapkan kepemilikan opsi put dan call mereka. Karena opsi put umumnya menunjukkan sentimen negatif, dan opsi call menunjukkan sentimen positif, kita dapat mengetahui sentimen institusional secara keseluruhan dengan memplot rasio put terhadap call. Grafik di sebelah kanan memplot rasio put/call historis untuk instrumen ini.
Menggunakan Rasio Put/Call sebagai indikator sentimen investor mengatasi salah satu kekurangan utama dari penggunaan total kepemilikan institusional, yaitu sejumlah besar aset yang dikelola diinvestasikan secara pasif untuk melacak indeks. Dana yang dikelola secara pasif biasanya tidak membeli opsi, sehingga indikator rasio put/call lebih akurat dalam melacak sentimen dana yang dikelola secara aktif.
Pengajuan 13D/G
Kami menyajikan pengajuan 13D/G secara terpisah dari pengajuan 13F karena perlakuan yang berbeda oleh SEC. Pengajuan 13D/G dapat diajukan oleh kelompok investor (dengan satu pemimpin), sedangkan pengajuan 13F tidak bisa. Hal ini mengakibatkan situasi di mana seorang investor dapat mengajukan 13D/G yang melaporkan satu nilai untuk total saham (mewakili semua saham yang dimiliki oleh kelompok investor), tetapi kemudian mengajukan 13F yang melaporkan nilai yang berbeda untuk total saham (mewakili kepemilikan mereka sendiri). Ini berarti bahwa kepemilikan saham dari pengajuan 13D/G dan pengajuan 13F seringkali tidak dapat dibandingkan secara langsung, sehingga kami menyajikannya secara terpisah.
Catatan: Mulai 16 Mei 2021, kami tidak lagi menampilkan pemilik yang belum mengajukan 13D/G dalam setahun terakhir. Sebelumnya, kami menampilkan riwayat lengkap pengajuan 13D/G. Secara umum, entitas yang diwajibkan untuk mengajukan pengajuan 13D/G harus mengajukan setidaknya setiap tahun sebelum mengirimkan pengajuan penutupan. Namun, terkadang dana keluar dari posisi tanpa mengirimkan pengajuan penutupan (misalnya, mereka menghentikan operasi), sehingga menampilkan riwayat lengkap terkadang menyebabkan kebingungan tentang kepemilikan saat ini. Untuk mencegah kebingungan, kami sekarang hanya menampilkan pemilik 'saat ini' - yaitu - pemilik yang telah mengajukan dalam setahun terakhir.
Upgrade to unlock premium data.
| Tanggal File | Formulir | Investor | Sebelumnya Saham |
Terbaru Saham |
Δ Saham (Persen) |
Kepemilikan (Persen) |
Δ Pagmamay-ari (Persen) |
|
|---|---|---|---|---|---|---|---|---|
| 2025-08-26 | Wilson Dennis J. | 104,017,032 | 99,962,978 | -3.90 | 18.00 | -4.26 | ||
| 2025-06-02 | Baseball Investment Limited | 69,099,348 | 34,099,348 | -50.65 | 6.10 | -51.59 | ||
| 2025-05-14 | HSBC HOLDINGS PLC | 235,108,143 | 232,365,782 | -1.17 | 42.00 | -2.33 | ||
| 2024-12-10 | ANLLIAN Sports Products Ltd | 232,328,780 | 232,328,780 | 0.00 | 42.50 | -7.61 |
Pengajuan 13F dan NPORT
Detail pada pengajuan 13F tersedia gratis. Detail pada pengajuan NP memerlukan keanggotaan premium. Baris berwarna hijau menunjukkan posisi baru. Baris berwarna merah menunjukkan posisi yang sudah ditutup. Klik tautan ini ikon untuk melihat riwayat transaksi selengkapnya.
Tingkatkan
untuk membuka data premium dan mengekspor ke Excel ![]() .
.
| Tanggal File | Sumber | Investor | Ketik | Presyo ng Avg (Silangan) |
Saham | Δ Saham (%) |
Dilaporkan Nilai ($1000) |
Nilai Δ (%) |
Alokasi Port (%) |
|
|---|---|---|---|---|---|---|---|---|---|---|
| 2025-08-07 | 13F | Acadian Asset Management Llc | 50,048 | 2 | ||||||
| 2025-08-14 | 13F | Peak6 Llc | Call | 0 | -100.00 | 0 | ||||
| 2025-08-04 | 13F | GAM Holding AG | 349,700 | -22.80 | 13,554 | 11.94 | ||||
| 2025-07-29 | NP | ESGV - Vanguard ESG U.S. Stock ETF ETF Shares | 18,436 | 52.65 | 671 | 86.11 | ||||
| 2025-08-14 | 13F | GWM Advisors LLC | 19,777 | 767 | ||||||
| 2025-07-24 | 13F | IFP Advisors, Inc | 0 | -100.00 | 6 | |||||
| 2025-08-14 | 13F | Voya Investment Management Llc | 16,667 | 112.16 | 646 | 209.09 | ||||
| 2025-05-15 | 13F | Quantessence Capital LLC | 0 | -100.00 | 0 | |||||
| 2025-08-14 | 13F | Treasurer of the State of North Carolina | 69,687 | 142.05 | 3 | |||||
| 2025-08-14 | 13F | Utah Retirement Systems | 7,886 | 306 | ||||||
| 2025-08-12 | 13F | Eisler Capital Management Ltd. | 45,691 | 1,771 | ||||||
| 2025-08-05 | 13F | Bank Of Montreal /can/ | 240,305 | -1.08 | 9,314 | 43.45 | ||||
| 2025-08-08 | 13F | Mv Capital Management, Inc. | 44 | 7.32 | 2 | 0.00 | ||||
| 2025-08-14 | 13F | D. E. Shaw & Co., Inc. | Call | 0 | -100.00 | 0 | ||||
| 2025-08-08 | 13F | Geode Capital Management, Llc | 747,218 | 136.08 | 28,962 | 242.34 | ||||
| 2025-08-15 | 13F | Morgan Stanley | 2,734,505 | 18.05 | 105,989 | 71.18 | ||||
| 2025-08-14 | 13F | California State Teachers Retirement System | 9,410 | 135.07 | 365 | 240.19 | ||||
| 2025-06-27 | NP | BIVIX - Invenomic Fund Institutional Class shares | Short | -528,295 | 54.97 | -12,811 | 17.55 | |||
| 2025-06-26 | NP | JHMM - John Hancock Multifactor Mid Cap ETF | 20,432 | 495 | ||||||
| 2025-06-23 | NP | PMPRX - MidCap Value Fund I R-3 | 2,008 | 6.30 | 49 | -20.00 | ||||
| 2025-08-12 | 13F | EAM Investors, LLC | 91,471 | -18.07 | 3,545 | 18.80 | ||||
| 2025-08-14 | 13F | Fortress Investment Group LLC | 248,562 | 9,634 | ||||||
| 2025-08-21 | NP | LIONX - Issachar Fund Class N Shares | 7,300 | 283 | ||||||
| 2025-08-06 | 13F | Ing Groep Nv | 1,279,700 | 1,566.28 | 49,601 | 2,317.20 | ||||
| 2025-07-16 | 13F | Arlington Capital Management, Inc. | 78,808 | 3,055 | ||||||
| 2025-08-14 | 13F | UBS Group AG | 1,046,911 | -46.06 | 40,578 | -21.78 | ||||
| 2025-08-12 | 13F | Dynamic Technology Lab Private Ltd | 50,992 | 1,976 | ||||||
| 2025-07-25 | 13F | Stonehage Fleming Financial Services Holdings Ltd | 34,022 | 0.00 | 1,319 | 44.99 | ||||
| 2025-08-14 | 13F | Sei Investments Co | 78,630 | 29.12 | 3,048 | 87.28 | ||||
| 2025-08-13 | 13F | Norges Bank | 1,570,059 | 60,855 | ||||||
| 2025-08-14 | 13F | Jane Street Group, Llc | Call | 12,400 | 481 | |||||
| 2025-08-14 | 13F | Jane Street Group, Llc | 351,296 | 152.70 | 13,616 | 266.51 | ||||
| 2025-08-14 | 13F | CIBC World Markets Inc. | 15,410 | -2.10 | 597 | 42.14 | ||||
| 2025-09-05 | 13F | FountainVest China Capital Partners GP3 Ltd. | 34,099,348 | -50.65 | 1,322 | -29.51 | ||||
| 2025-08-06 | 13F | Golden State Wealth Management, LLC | 0 | -100.00 | 0 | |||||
| 2025-04-25 | 13F | Kieckhefer Group Llc | 0 | -100.00 | 0 | |||||
| 2025-08-14 | 13F | Tudor Investment Corp Et Al | Call | 6,200 | 240 | |||||
| 2025-06-23 | NP | IYC - iShares U.S. Consumer Services ETF | 14,268 | -10.93 | 346 | -32.62 | ||||
| 2025-08-14 | 13F | Tudor Investment Corp Et Al | 861,758 | 763.25 | 33,402 | 1,151.91 | ||||
| 2025-08-14 | 13F | Algert Global Llc | 14,822 | 1 | ||||||
| 2025-08-14 | 13F | Ubs Oconnor Llc | 80,000 | 0.00 | 3,101 | 45.00 | ||||
| 2025-08-14 | 13F | Banque Transatlantique SA | 0 | -100.00 | 0 | |||||
| 2025-08-14 | 13F | Verition Fund Management LLC | 418,112 | -27.65 | 16,206 | 4.92 | ||||
| 2025-08-14 | 13F | Dymon Asia Capital (singapore) Pte. Ltd. | 6,000 | 233 | ||||||
| 2025-08-05 | 13F | Bank of New York Mellon Corp | 364,156 | 60.16 | 14,115 | 132.25 | ||||
| 2025-08-13 | 13F | Brown Advisory Inc | 3,803,764 | -8.20 | 147,434 | 33.12 | ||||
| 2025-08-18 | 13F | Wolverine Trading, Llc | Call | 26,800 | 41.80 | 1,055 | 110.38 | |||
| 2025-08-18 | 13F | Wolverine Trading, Llc | Put | 12,700 | -56.80 | 500 | -36.03 | |||
| 2025-08-13 | 13F | Colonial Trust Advisors | 17,461 | 401.03 | 677 | 626.88 | ||||
| 2025-08-18 | 13F | Wolverine Trading, Llc | 11,359 | 447 | ||||||
| 2025-08-14 | 13F | Avala Global LP | 3,197,049 | -8.16 | 123,918 | 33.17 | ||||
| 2025-05-13 | 13F | Element Capital Management Llc | 0 | -100.00 | 0 | |||||
| 2025-08-05 | 13F | Corton Capital Inc. | 5,282 | 205 | ||||||
| 2025-08-08 | 13F | SG Americas Securities, LLC | 6,793 | -99.52 | 0 | -100.00 | ||||
| 2025-08-27 | NP | VQNPX - Vanguard Growth and Income Fund Investor Shares This fund is a listed as child fund of Vanguard Group Inc and if that institution has disclosed ownership in this security, then these positions will not be double counted when calculating total shares and total value | 85,100 | 3,298 | ||||||
| 2025-08-07 | 13F | Allworth Financial LP | 76 | 16.92 | 3 | 100.00 | ||||
| 2025-08-14 | 13F | Wellington Management Group Llp | 164,112 | 200.87 | 6,361 | 336.21 | ||||
| 2025-08-14 | 13F | Junto Capital Management LP | 2,499,571 | 31.24 | 96,883 | 90.30 | ||||
| 2025-08-08 | 13F | Hartland & Co., LLC | 0 | -100.00 | 0 | |||||
| 2025-08-12 | 13F | Magnetar Financial LLC | 27,324 | 1,059 | ||||||
| 2025-07-11 | 13F | Annex Advisory Services, LLC | 380,989 | 19.94 | 14,767 | 73.93 | ||||
| 2025-08-14 | 13F | Jain Global LLC | 324,840 | 1,443.26 | 12,591 | 2,140.21 | ||||
| 2025-08-12 | 13F | Aigen Investment Management, Lp | 8,962 | 347 | ||||||
| 2025-08-27 | NP | OHIO NATIONAL FUND INC - ON Janus Henderson Enterprise Portfolio | 1,990 | 0.00 | 77 | 45.28 | ||||
| 2025-08-13 | 13F | Healthcare Of Ontario Pension Plan Trust Fund | 55,600 | 2,155 | ||||||
| 2025-08-26 | NP | DSMDX - Driehaus Small/Mid Cap Growth Fund | 7,912 | 307 | ||||||
| 2025-08-26 | NP | GVIZX - Value Equity Index Fund Investor | 684 | 605.15 | 27 | 1,200.00 | ||||
| 2025-05-15 | 13F | Caption Management, LLC | Put | 0 | -100.00 | 0 | -100.00 | |||
| 2025-08-27 | NP | BBVSX - Bridge Builder Small/Mid Cap Value Fund | 4,155 | 137.70 | 161 | 250.00 | ||||
| 2025-08-13 | 13F | Jackson Creek Investment Advisors LLC | 33,690 | 1 | ||||||
| 2025-08-06 | 13F | SOUTH STATE Corp | 0 | -100.00 | 0 | |||||
| 2025-08-11 | 13F | BRILLIANCE ASSET MANAGEMENT Ltd | 805,842 | -77.32 | 31,234 | -67.12 | ||||
| 2025-08-14 | 13F | Tiger Pacific Capital LP | 787,495 | 153.12 | 30,523 | 267.08 | ||||
| 2025-06-26 | NP | TIEIX - TIAA-CREF Equity Index Fund Institutional Class | 54,314 | 0.00 | 1,317 | -24.14 | ||||
| 2025-08-14 | 13F | Perseverance Asset Management International | 615,197 | 549.33 | 23,845 | 841.75 | ||||
| 2025-07-29 | NP | VRTTX - Vanguard Russell 3000 Index Fund Institutional Shares | 6,360 | 34.95 | 231 | 65.00 | ||||
| 2025-08-26 | NP | TLSTX - Stock Index Fund | 2,031 | 853.52 | 79 | 1,460.00 | ||||
| 2025-08-14 | 13F | Farringdon Capital, Ltd. | 6,211 | 241 | ||||||
| 2025-08-28 | NP | SPWIX - Simt Small Cap Growth Fund Class I | 11,304 | -29.38 | 438 | 2.58 | ||||
| 2025-08-04 | 13F | Pinnacle Associates Ltd | 37,180 | -33.48 | 1,441 | -3.55 | ||||
| 2025-08-14 | 13F | Point72 Hong Kong Ltd | 1,564,283 | 60,632 | ||||||
| 2025-07-29 | NP | VFMO - Vanguard U.S. Momentum Factor ETF ETF Shares | 70,481 | 0.00 | 2,564 | 21.75 | ||||
| 2025-07-28 | 13F | BRYN MAWR TRUST Co | 3,180 | 123 | ||||||
| 2025-08-04 | 13F | Strs Ohio | 31,551 | -14.03 | 1,223 | 24.69 | ||||
| 2025-08-11 | 13F | Monashee Investment Management LLC | 0 | -100.00 | 0 | |||||
| 2025-08-08 | 13F | Pnc Financial Services Group, Inc. | 351 | 23.16 | 14 | 85.71 | ||||
| 2025-08-14 | 13F | Cubist Systematic Strategies, LLC | 624,772 | 24,216 | ||||||
| 2025-08-14 | 13F | Fred Alger Management, Llc | 0 | -100.00 | 0 | |||||
| 2025-07-25 | 13F | Cwm, Llc | 4,935 | -16.11 | 0 | |||||
| 2025-07-10 | 13F | Exchange Traded Concepts, Llc | 155,633 | 6,032 | ||||||
| 2025-08-13 | 13F | Jump Financial, LLC | 335,120 | 12,989 | ||||||
| 2025-08-04 | 13F | Amalgamated Bank | 7,651 | 135.34 | 0 | |||||
| 2025-08-13 | 13F | State Board Of Administration Of Florida Retirement System | 52,802 | 2,047 | ||||||
| 2025-08-14 | 13F | Interval Partners, LP | 1,087,599 | 463.10 | 42,155 | 716.64 | ||||
| 2025-04-23 | 13F | Sabal Trust CO | 62,708 | -19.68 | 1,676 | -23.19 | ||||
| 2025-08-13 | 13F | Northern Trust Corp | 291,073 | 145.36 | 11,282 | 255.87 | ||||
| 2025-07-28 | 13F | Harbour Investments, Inc. | 25 | 1 | ||||||
| 2025-08-14 | 13F | Aqr Capital Management Llc | 48,329 | 128.78 | 1,873 | 232.09 | ||||
| 2025-08-14 | 13F | Polymer Capital Management (HK) LTD | 934,324 | 217.81 | 36,214 | 360.86 | ||||
| 2025-06-26 | NP | TSMOX - TIAA-CREF Quant Small/Mid-Cap Equity Fund Retirement Class | 108,810 | 5.03 | 2,639 | -20.35 | ||||
| 2025-07-28 | NP | AVUS - Avantis U.S. Equity ETF This fund is a listed as child fund of American Century Companies Inc and if that institution has disclosed ownership in this security, then these positions will not be double counted when calculating total shares and total value | 6,157 | 0.00 | 224 | 21.20 | ||||
| 2025-08-14 | 13F | Point72 Asset Management, L.P. | 2,361,582 | 91,535 | ||||||
| 2025-08-13 | 13F | Kayne Anderson Rudnick Investment Management Llc | 71 | 3 | ||||||
| 2025-08-05 | 13F | GPS Wealth Strategies Group, LLC | 6 | 500.00 | 0 | |||||
| 2025-08-14 | 13F | Wells Fargo & Company/mn | 2,717 | 290.37 | 105 | 483.33 | ||||
| 2025-08-27 | NP | ALLIANZ VARIABLE INSURANCE PRODUCTS TRUST - AZL Russell 1000 Value Index Fund Class 2 | 3,331 | 112.44 | 129 | 214.63 | ||||
| 2025-08-01 | 13F | Oversea-Chinese Banking CORP Ltd | 270,948 | 12.69 | 10,497 | 63.44 | ||||
| 2025-08-05 | 13F | Sigma Planning Corp | 20,000 | 0.00 | 775 | 45.13 | ||||
| 2025-05-14 | 13F | Susquehanna International Group, Llp | 0 | -100.00 | 0 | -100.00 | ||||
| 2025-08-04 | 13F | Hantz Financial Services, Inc. | 28 | -42.86 | 0 | |||||
| 2025-08-12 | 13F | Trexquant Investment LP | 204,143 | -74.48 | 7,913 | -63.00 | ||||
| 2025-08-07 | 13F | Illinois Municipal Retirement Fund | 58,104 | 139.45 | 2,252 | 247.53 | ||||
| 2025-08-12 | 13F | Global Retirement Partners, LLC | 28 | 40.00 | 1 | |||||
| 2025-08-06 | 13F | Penserra Capital Management LLC | 7,601 | 63,241.67 | 0 | |||||
| 2025-07-28 | 13F | Copia Wealth Management | 50 | 0.00 | 2 | 0.00 | ||||
| 2025-08-14 | 13F | Balyasny Asset Management Llc | 2,251,982 | 87,287 | ||||||
| 2025-08-27 | NP | BBVLX - Bridge Builder Large Cap Value Fund | 4,880 | 84.22 | 189 | 170.00 | ||||
| 2025-08-27 | 13F/A | Squarepoint Ops LLC | 15,026 | -36.38 | 582 | -7.77 | ||||
| 2025-08-14 | 13F | Manufacturers Life Insurance Company, The | 52,925 | -40.18 | 2,051 | -13.24 | ||||
| 2025-08-11 | 13F | EntryPoint Capital, LLC | 0 | -100.00 | 0 | |||||
| 2025-08-15 | 13F/A | Rakuten Securities, Inc. | 3,128 | 3,375.56 | 121 | 5,950.00 | ||||
| 2025-08-12 | 13F | Proequities, Inc. | 0 | 0 | ||||||
| 2025-08-12 | 13F | Entropy Technologies, LP | 25,218 | -32.28 | 977 | -1.81 | ||||
| 2025-08-01 | 13F | Y-Intercept (Hong Kong) Ltd | 117,585 | 4,558 | ||||||
| 2025-08-14 | 13F | Ieq Capital, Llc | 5,200 | 202 | ||||||
| 2025-08-14 | 13F | Sherbrooke Park Advisers Llc | 24,502 | 46.01 | 950 | 111.83 | ||||
| 2025-08-01 | 13F | Bessemer Group Inc | 0 | -100.00 | 0 | |||||
| 2025-08-14 | 13F | Boston Private Wealth Llc | 0 | -100.00 | 0 | |||||
| 2025-08-14 | 13F | Temasek Holdings (Private) Ltd | 0 | -100.00 | 0 | |||||
| 2025-07-21 | 13F | WT Asset Management Ltd | 1,088,201 | -54.98 | 42,179 | -34.71 | ||||
| 2025-08-13 | 13F | Jones Financial Companies Lllp | 988 | 223.93 | 39 | 375.00 | ||||
| 2025-07-23 | 13F | Vontobel Holding Ltd. | 9,148 | 0.00 | 355 | 45.08 | ||||
| 2025-05-28 | NP | QCEQRX - Equity Index Account Class R1 | 13,448 | 0.00 | 359 | -4.52 | ||||
| 2025-08-05 | 13F | Eleva Capital SAS | 101,694 | 3,942 | ||||||
| 2025-06-26 | NP | TILVX - TIAA-CREF Large-Cap Value Index Fund Institutional Class | 25,233 | 0.00 | 612 | -24.19 | ||||
| 2025-08-11 | 13F | Hexagon Capital Partners LLC | 0 | -100.00 | 0 | |||||
| 2025-08-26 | NP | WCFOX - WCM Focused International Opportunities Fund Investor Class Shares | 17,540 | -25.36 | 680 | 8.12 | ||||
| 2025-05-15 | 13F | Symmetry Investments LP | 0 | -100.00 | 0 | |||||
| 2025-04-23 | 13F | E Fund Management (Hong Kong) Co., Ltd. | 0 | -100.00 | 0 | |||||
| 2025-07-30 | 13F | Ethic Inc. | 6,837 | 269 | ||||||
| 2025-08-14 | 13F | Hook Mill Capital Partners, LP | 887,153 | -23.29 | 34,386 | 11.23 | ||||
| 2025-07-24 | 13F | Us Bancorp \de\ | 2,031 | 17.06 | 79 | 69.57 | ||||
| 2025-08-11 | 13F | Rothschild Investment Llc | 60 | 0.00 | 2 | 100.00 | ||||
| 2025-08-14 | 13F | Price T Rowe Associates Inc /md/ | 56,720 | 137.93 | 2 | |||||
| 2025-07-07 | 13F | Versant Capital Management, Inc | 349 | 14 | ||||||
| 2025-08-05 | 13F | NewSquare Capital LLC | 49 | 96.00 | 2 | |||||
| 2025-08-08 | 13F | Pinnbrook Capital Management Lp | 232,743 | 9,021 | ||||||
| 2025-08-14 | 13F | FIL Ltd | 1,355,000 | -33.90 | 52,520 | -4.16 | ||||
| 2025-08-22 | NP | Columbia Funds Variable Series Trust II - Columbia Variable Portfolio - Emerging Markets Fund Class 3 | 90,886 | 3,523 | ||||||
| 2025-08-12 | 13F | Rhumbline Advisers | 123,568 | 150.86 | 4,789 | 263.91 | ||||
| 2025-08-14 | 13F | Monolith Management Ltd | 0 | -100.00 | 0 | |||||
| 2025-08-14 | 13F | Canada Pension Plan Investment Board | 738,038 | 218.86 | 28,606 | 362.43 | ||||
| 2025-08-14 | 13F | Occudo Quantitative Strategies Lp | 124,062 | 433.42 | 4,809 | 679.25 | ||||
| 2025-08-14 | 13F | Point72 (DIFC) Ltd | 44,744 | 1,734 | ||||||
| 2025-08-28 | NP | SLGFX - SIMT Large Cap Index Fund Class F | 2,945 | 157.21 | 114 | 280.00 | ||||
| 2025-08-18 | 13F/A | National Bank Of Canada /fi/ | 76,139 | 52,409.66 | 2,951 | 98,266.67 | ||||
| 2025-07-28 | NP | AVLC - Avantis U.S. Large Cap Equity ETF | 1,231 | 52.54 | 45 | 83.33 | ||||
| 2025-08-14 | 13F | Bridgefront Capital, LLC | 8,531 | 331 | ||||||
| 2025-08-13 | 13F | ExodusPoint Capital Management, LP | 0 | -100.00 | 0 | |||||
| 2025-08-14 | 13F | Samlyn Capital, Llc | 1,549,346 | -5.21 | 60,053 | 37.46 | ||||
| 2025-07-22 | 13F | Net Worth Advisory Group | 8,385 | 325 | ||||||
| 2025-08-27 | NP | VMNFX - Vanguard Market Neutral Fund Investor Shares This fund is a listed as child fund of Vanguard Group Inc and if that institution has disclosed ownership in this security, then these positions will not be double counted when calculating total shares and total value | Short | -16,750 | -27.18 | -649 | 5.70 | |||
| 2025-05-14 | 13F | Greenwoods Asset Management Hong Kong Ltd. | 0 | -100.00 | 0 | -100.00 | ||||
| 2025-08-14 | 13F | Seldon Capital Lp | 274,156 | 10,626 | ||||||
| 2025-08-13 | 13F | BCJ Capital Management, LLC | 98,573 | 3,821 | ||||||
| 2025-07-29 | NP | CAVAX - Catholic Values Equity Fund Class F, effective 1-31-2017 (formerly Class A) | 3,653 | 0.00 | 133 | 21.10 | ||||
| 2025-07-16 | 13F | ORG Partners LLC | 40 | 2 | ||||||
| 2025-08-14 | 13F | Sandia Investment Management LP | 10,000 | 300.00 | 388 | 486.36 | ||||
| 2025-08-29 | 13F | Infini Capital Management Ltd | 135,000 | 5,233 | ||||||
| 2025-07-31 | 13F | Nisa Investment Advisors, Llc | 37,025 | -11.48 | 1,435 | 28.35 | ||||
| 2025-08-13 | 13F | EverSource Wealth Advisors, LLC | 492 | 57.19 | 19 | 137.50 | ||||
| 2025-08-14 | 13F | Macquarie Group Ltd | 3,000 | 116 | ||||||
| 2025-08-14 | 13F | Jane Street Group, Llc | Put | 0 | -100.00 | 0 | -100.00 | |||
| 2025-07-29 | 13F | Wcm Investment Management, Llc | 140,555 | -24.24 | 5,532 | 12.32 | ||||
| 2025-05-15 | 13F | Davidson Kempner Capital Management Lp | 0 | -100.00 | 0 | -100.00 | ||||
| 2025-08-14 | 13F | Caption Management, LLC | 25,000 | 969 | ||||||
| 2025-08-14 | 13F | Hudson Bay Capital Management LP | 0 | -100.00 | 0 | |||||
| 2025-08-14 | 13F | Qube Research & Technologies Ltd | 3,887,480 | 139.91 | 150,679 | 247.88 | ||||
| 2025-08-14 | 13F | Toroso Investments, LLC | 8,479 | 329 | ||||||
| 2025-08-11 | 13F | Citigroup Inc | 99,098 | -77.56 | 3,841 | -67.46 | ||||
| 2025-08-13 | 13F | Renaissance Technologies Llc | 1,027,700 | 62.45 | 39,834 | 135.56 | ||||
| 2025-08-13 | 13F | Colonial Trust Co / SC | 7,070 | 283.82 | 274 | 459.18 | ||||
| 2025-04-24 | NP | NGCAX - Columbia Greater China Fund Class A | 6,936 | -43.66 | 207 | -36.11 | ||||
| 2025-07-29 | NP | SLPAX - Siit Small Cap Fund - Class A | 4,223 | -58.67 | 154 | -49.84 | ||||
| 2025-05-30 | NP | SLLAX - SIMT Small Cap Fund Class F | 11,138 | -33.79 | 298 | -36.81 | ||||
| 2025-08-14 | 13F | Bayesian Capital Management, LP | 36,863 | 1,429 | ||||||
| 2025-08-14 | 13F | Voloridge Investment Management, Llc | 2,017,660 | 84.69 | 78,205 | 167.81 | ||||
| 2025-08-14 | 13F | Oxbow Capital Management (HK) Ltd | 1,456,902 | -1.82 | 56,470 | 42.36 | ||||
| 2025-08-13 | 13F | Pinpoint Asset Management (Singapore) Pte. Ltd. | 489,240 | 18,963 | ||||||
| 2025-07-08 | 13F | Parallel Advisors, LLC | 2,118 | -14.18 | 82 | 26.15 | ||||
| 2025-08-14 | 13F | Armistice Capital, Llc | 101,309 | -7.05 | 3,927 | 34.78 | ||||
| 2025-08-27 | NP | HCIGX - The Institutional Growth Equity Portfolio HC Strategic Shares | 758 | 68.44 | 29 | 141.67 | ||||
| 2025-06-30 | NP | VT - Vanguard Total World Stock Index Fund ETF Shares | 42,639 | 21.21 | 1,034 | -8.10 | ||||
| 2025-08-07 | 13F | Los Angeles Capital Management Llc | 47,260 | 1,832 | ||||||
| 2025-08-14 | 13F | Hancock Whitney Corp | 62,159 | 2,409 | ||||||
| 2025-08-14 | 13F | Engineers Gate Manager LP | 445,824 | 278.08 | 17,280 | 448.40 | ||||
| 2025-08-12 | 13F | EAM Global Investors LLC | 157,766 | -0.04 | 6,115 | 44.97 | ||||
| 2025-08-13 | 13F | Federated Hermes, Inc. | 9,295 | 1,399.19 | 360 | 2,150.00 | ||||
| 2025-07-18 | 13F | Renaissance Capital LLC | 123,958 | -1.08 | 4,805 | 43.45 | ||||
| 2025-08-01 | 13F | Envestnet Asset Management Inc | 22,301 | -10.96 | 864 | 29.15 | ||||
| 2025-07-18 | 13F | CHURCHILL MANAGEMENT Corp | 16,698 | 647 | ||||||
| 2025-05-12 | 13F | Pinpoint Asset Management Ltd | 114,940 | -74.84 | 3,072 | -75.95 | ||||
| 2025-07-15 | 13F | Mather Group, Llc. | 0 | -100.00 | 0 | |||||
| 2025-08-14 | 13F | Man Group plc | 1,334,310 | 12.81 | 51,718 | 63.58 | ||||
| 2025-08-14 | 13F | Nicholas Investment Partners, LP | 19,852 | 769 | ||||||
| 2025-07-29 | NP | SMXAX - SIIT Extended Market Index Fund - Class A | 9,100 | 0.00 | 331 | 22.14 | ||||
| 2025-08-13 | 13F | Blueshift Asset Management, LLC | 15,137 | 587 | ||||||
| 2025-08-13 | 13F | New York State Common Retirement Fund | 66,700 | 134.86 | 3 | |||||
| 2025-07-09 | 13F | Bruce G. Allen Investments, LLC | 112 | 0.00 | 4 | 100.00 | ||||
| 2025-07-09 | 13F | Massmutual Trust Co Fsb/adv | 57 | -73.49 | 2 | -60.00 | ||||
| 2025-07-24 | 13F | Ronald Blue Trust, Inc. | 43 | 2 | ||||||
| 2025-08-12 | 13F | Axq Capital, Lp | 21,808 | -31.95 | 845 | -1.29 | ||||
| 2025-08-13 | 13F | Marshall Wace, Llp | 3,747,775 | 32.46 | 145,264 | 92.07 | ||||
| 2025-07-14 | 13F | Pacifica Partners Inc. | 100 | 0.00 | 4 | 50.00 | ||||
| 2025-07-15 | 13F | Public Employees Retirement System Of Ohio | 46,315 | 139.06 | 1,795 | 247.20 | ||||
| 2025-07-30 | 13F | Cookson Peirce & Co Inc | 53,625 | 2,079 | ||||||
| 2025-08-08 | 13F | Compass Financial Services Inc | 97 | 0.00 | 4 | 50.00 | ||||
| 2025-08-11 | 13F | WPG Advisers, LLC | 172 | 7 | ||||||
| 2025-08-08 | 13F | Police & Firemen's Retirement System of New Jersey | 56,877 | 148.91 | 2,205 | 261.31 | ||||
| 2025-08-15 | 13F | Tower Research Capital LLC (TRC) | 1,436 | -76.06 | 56 | -65.62 | ||||
| 2025-07-29 | 13F | Activest Wealth Management | 0 | -100.00 | 0 | |||||
| 2025-08-12 | 13F | Charles Schwab Investment Management Inc | 30,938 | 149.78 | 1,199 | 262.24 | ||||
| 2025-06-26 | NP | JHML - John Hancock Multifactor Large Cap ETF | 642 | 16 | ||||||
| 2025-08-11 | 13F | Qsemble Capital Management, LP | 39,020 | 1,512 | ||||||
| 2025-08-13 | 13F | Arrowstreet Capital, Limited Partnership | 3,121,218 | -9.36 | 120,978 | 31.43 | ||||
| 2025-08-12 | 13F | Handelsbanken Fonder AB | 34,600 | 27.68 | 1 | |||||
| 2025-07-28 | NP | MSSM - Morgan Stanley Pathway Small-Mid Cap Equity ETF | 2,788 | 26.55 | 101 | 55.38 | ||||
| 2025-05-15 | 13F | Oasis Management Co Ltd. | 0 | -100.00 | 0 | |||||
| 2025-08-14 | 13F | Soros Fund Management Llc | 625,890 | 13.74 | 24,259 | 64.94 | ||||
| 2025-05-13 | 13F | Clear Street Markets Llc | 0 | -100.00 | 0 | -100.00 | ||||
| 2025-07-22 | 13F | Gsa Capital Partners Llp | 41,216 | 348.19 | 2 | |||||
| 2025-08-12 | 13F | DnB Asset Management AS | 17,405 | 0.00 | 674 | 44.95 | ||||
| 2025-08-14 | 13F | Prelude Capital Management, Llc | 0 | -100.00 | 0 | |||||
| 2025-08-15 | 13F | Keel Point, LLC | 6,651 | 258 | ||||||
| 2025-05-15 | 13F | Rakuten Investment Management, Inc. | 1,100 | 29 | ||||||
| 2025-08-12 | 13F | Nuveen, LLC | 481,694 | 40.42 | 18,670 | 103.62 | ||||
| 2025-08-13 | 13F | Quadrature Capital Ltd | 67,360 | 70.44 | 2,610 | 147.39 | ||||
| 2025-08-01 | 13F | Jennison Associates Llc | 0 | -100.00 | 0 | -100.00 | ||||
| 2025-07-16 | 13F | Signaturefd, Llc | 4,455 | -9.54 | 173 | 31.30 | ||||
| 2025-08-14 | 13F | Lord, Abbett & Co. Llc | 137,622 | 5 | ||||||
| 2025-07-29 | NP | SLCAX - Siit Large Cap Fund - Class A | 2,245 | -75.26 | 82 | -70.11 | ||||
| 2025-08-14 | 13F | Hrt Financial Lp | 177,833 | 229.60 | 7 | 500.00 | ||||
| 2025-08-13 | 13F | PharVision Advisers, LLC | 6,443 | 250 | ||||||
| 2025-08-14 | 13F | LMR Partners LLP | 18,430 | -25.54 | 714 | 8.02 | ||||
| 2025-08-28 | NP | SEMCX - Simt Mid Cap Fund Class F | 3,810 | 148 | ||||||
| 2025-08-11 | 13F | Artemis Investment Management LLP | 18,603 | -13.39 | 721 | 25.61 | ||||
| 2025-08-12 | 13F | BlackRock, Inc. | 3,216,077 | 122.03 | 124,655 | 221.96 | ||||
| 2025-08-13 | 13F | MetLife Investment Management, LLC | 2,485 | 119.72 | 96 | 220.00 | ||||
| 2025-08-14 | 13F | Two Sigma Advisers, Lp | 847,400 | 127.00 | 32,845 | 229.17 | ||||
| 2025-08-14 | 13F | Graham Capital Management, L.P. | 110,948 | 4,300 | ||||||
| 2025-05-14 | 13F | Dnca Finance | 0 | -100.00 | 0 | |||||
| 2025-08-13 | 13F | Hsbc Holdings Plc | 37,560 | 1,482 | ||||||
| 2025-08-14 | 13F | Candlestick Capital Management LP | 2,866,290 | -14.64 | 111,097 | 23.78 | ||||
| 2025-03-31 | NP | DAACX - Diversified Equity Fund | 708 | 0.00 | 23 | 83.33 | ||||
| 2025-07-15 | 13F | Mainstream Capital Management LLC | 16,850 | 0.00 | 653 | 45.11 | ||||
| 2025-08-14 | 13F | Woodline Partners LP | 0 | -100.00 | 0 | -100.00 | ||||
| 2025-08-28 | 13F | China Universal Asset Management Co., Ltd. | 84,140 | -25.08 | 3,261 | 8.66 | ||||
| 2025-07-28 | 13F | Virtus Wealth Solutions LLC | 375,391 | 14,550 | ||||||
| 2025-08-13 | 13F | Northwestern Mutual Wealth Management Co | 3,364 | 276.29 | 130 | 465.22 | ||||
| 2025-08-14 | 13F | Numerai GP LLC | 32,217 | -34.31 | 1,249 | -4.73 | ||||
| 2025-08-13 | 13F | First Trust Advisors Lp | 65,915 | 63.31 | 2,555 | 136.92 | ||||
| 2025-08-13 | 13F | Northwest & Ethical Investments L.P. | 31,053 | 1,204 | ||||||
| 2025-07-29 | NP | VRVIX - Vanguard Russell 1000 Value Index Fund Institutional Shares | 45,823 | 59.42 | 1,667 | 94.06 | ||||
| 2025-08-14 | 13F | Citadel Advisors Llc | Put | 102,400 | 70.10 | 3,969 | 146.67 | |||
| 2025-05-06 | 13F | Proficio Capital Partners LLC | 0 | -100.00 | 0 | -100.00 | ||||
| 2025-08-14 | 13F | Ameriprise Financial Inc | 1,387,213 | 15,325.48 | 53,768 | 22,303.33 | ||||
| 2025-08-14 | 13F | Anomaly Capital Management, LP | 2,221,607 | 19.79 | 86,109 | 73.70 | ||||
| 2025-08-14 | 13F | Citadel Advisors Llc | Call | 32,600 | 191.07 | 1,264 | 322.41 | |||
| 2025-08-14 | 13F | Petrus Trust Company, LTA | 10,330 | -23.42 | 400 | 11.11 | ||||
| 2025-08-14 | 13F | Citadel Advisors Llc | 645,170 | 1,964.54 | 25,007 | 2,894.73 | ||||
| 2025-08-14 | 13F | Driehaus Capital Management Llc | 319,969 | 12,402 | ||||||
| 2025-08-12 | 13F | Corebridge Financial, Inc. | 0 | -100.00 | 0 | |||||
| 2025-08-14 | 13F | Bank Of America Corp /de/ | 1,546,319 | 9.21 | 59,935 | 58.36 | ||||
| 2025-08-14 | 13F | Hood River Capital Management LLC | 227,850 | -17.98 | 8,831 | 18.94 | ||||
| 2025-08-12 | 13F | Dimensional Fund Advisors Lp | 22,244 | 1.87 | 862 | 47.86 | ||||
| 2025-08-05 | 13F | Simplex Trading, Llc | 7,474 | 0 | ||||||
| 2025-07-29 | NP | VRNIX - Vanguard Russell 1000 Index Fund Institutional Shares | 12,873 | 43.50 | 468 | 74.63 | ||||
| 2025-08-13 | 13F | OPTIMAS CAPITAL Ltd | 55,000 | 2,132 | ||||||
| 2025-08-14 | 13F | SummitTX Capital, L.P. | 13,322 | -44.66 | 516 | -19.75 | ||||
| 2025-08-19 | 13F | State of Wyoming | 10,336 | -0.91 | 401 | 43.88 | ||||
| 2025-08-11 | 13F | Covestor Ltd | 4,331 | 813.71 | 0 | |||||
| 2025-08-13 | 13F | Centiva Capital, LP | 385,122 | 2,253.61 | 14,927 | 3,315.79 | ||||
| 2025-08-13 | 13F | Walleye Capital LLC | Call | 13,400 | -82.18 | 519 | -74.18 | |||
| 2025-08-13 | 13F | Walleye Capital LLC | 736,740 | 212.27 | 28,556 | 352.84 | ||||
| 2025-08-13 | 13F | Walleye Capital LLC | Put | 5,400 | 54.29 | 209 | 124.73 | |||
| 2025-07-16 | 13F | Highline Wealth Partners Llc | 6 | 0.00 | 0 | |||||
| 2025-08-14 | 13F | Mane Global Capital Management Lp | 1,480,433 | 13,826.93 | 57,382 | 20,104.58 | ||||
| 2025-08-14 | 13F | State Street Corp | 1,297,491 | 112.68 | 50,291 | 208.41 | ||||
| 2025-08-11 | 13F | Keystone Investors Pte Ltd | 433,170 | 220.64 | 16,790 | 364.94 | ||||
| 2025-08-28 | NP | TIAA SEPARATE ACCOUNT VA 1 - Stock Index Account Teachers Personal Annuity Individual Deferred Variable Annuity | 3,260 | 522.14 | 126 | 800.00 | ||||
| 2025-08-14 | 13F | PDT Partners, LLC | 193,531 | 34.86 | 7,501 | 95.59 | ||||
| 2025-04-29 | NP | SEIAX - SIIT Multi-Asset Real Return Fund - Class A | 0 | -100.00 | 0 | -100.00 | ||||
| 2025-08-12 | 13F | Tairen Capital Ltd | 551,630 | 26.52 | 21,381 | 83.46 | ||||
| 2025-08-12 | 13F | LPL Financial LLC | 22,963 | 36.02 | 890 | 97.34 | ||||
| 2025-07-21 | 13F | Platinum Investment Management Ltd | 190,000 | -5.00 | 7,364 | 37.75 | ||||
| 2025-08-06 | 13F | Trivest Advisors Ltd | 2,070,000 | -1.94 | 80,233 | 42.19 | ||||
| 2025-08-11 | 13F | Principal Securities, Inc. | 732 | 11.25 | 28 | 55.56 | ||||
| 2025-08-18 | 13F | Hollencrest Capital Management | 2,635 | 102 | ||||||
| 2025-08-14 | 13F | Burkehill Global Management, LP | 400,000 | 15,504 | ||||||
| 2025-08-13 | 13F | 1832 Asset Management L.P. | 84,300 | 3,267 | ||||||
| 2025-08-14 | 13F | Weiss Asset Management LP | 35,950 | 1,393 | ||||||
| 2025-07-11 | 13F | Farther Finance Advisors, LLC | 114 | 0.00 | 4 | 33.33 | ||||
| 2025-08-12 | 13F | Jpmorgan Chase & Co | 626,433 | 11,946.79 | 24,281 | 17,494.20 | ||||
| 2025-08-12 | 13F | Ci Investments Inc. | 167 | -5.11 | 0 | |||||
| 2025-08-14 | 13F | Gotham Asset Management, LLC | 915,306 | 24.45 | 35,477 | 80.46 | ||||
| 2025-08-14 | 13F | Smartleaf Asset Management LLC | 1,591 | 174.31 | 63 | 313.33 | ||||
| 2025-08-27 | NP | BBGSX - Bridge Builder Small/Mid Cap Growth Fund | 243,002 | 9,419 | ||||||
| 2025-08-13 | 13F | Natixis Advisors, L.p. | 11,800 | 0 | ||||||
| 2025-07-14 | 13F | GAMMA Investing LLC | 2,614 | 17.38 | 101 | 71.19 | ||||
| 2025-07-22 | 13F | Capricorn Fund Managers Ltd | 134,602 | 22.37 | 5,217 | 77.45 | ||||
| 2025-08-13 | 13F | Rsm Us Wealth Management Llc | 9,854 | 21.44 | 382 | 76.39 | ||||
| 2025-07-15 | 13F | Fifth Third Bancorp | 92 | 4 | ||||||
| 2025-08-13 | 13F | Mount Yale Investment Advisors, LLC | 130 | 5 | ||||||
| 2025-07-23 | 13F | Friedenthal Financial | 0 | -100.00 | 0 | |||||
| 2025-08-06 | 13F | Fox Run Management, L.l.c. | 41,842 | 299.52 | 1,622 | 481.00 | ||||
| 2025-06-26 | NP | KCEVX - Knights of Columbus Long/Short Equity Fund Investor Shares | Short | -94,019 | -2,280 | |||||
| 2025-08-14 | 13F | Royal Bank Of Canada | 1,636,283 | 8,823.88 | 63,422 | 12,843.27 | ||||
| 2025-07-16 | 13F | Dakota Wealth Management | 0 | -100.00 | 0 | |||||
| 2025-08-14 | 13F | DZ BANK AG Deutsche Zentral Genossenschafts Bank, Frankfurt am Main | 206,175 | -37.53 | 7,991 | -9.42 | ||||
| 2025-08-27 | NP | VTCLX - Vanguard Tax-Managed Capital Appreciation Fund Admiral Shares This fund is a listed as child fund of Vanguard Group Inc and if that institution has disclosed ownership in this security, then these positions will not be double counted when calculating total shares and total value | 24,274 | 34.95 | 941 | 95.83 | ||||
| 2025-07-29 | 13F | Private Wealth Management Group, LLC | 187 | 0.00 | 7 | 75.00 | ||||
| 2025-08-13 | 13F | Quantbot Technologies LP | 386,867 | 77.56 | 14,995 | 157.50 | ||||
| 2025-08-14 | 13F/A | Skopos Labs, Inc. | 153 | 206.00 | 6 | 400.00 | ||||
| 2025-07-28 | NP | EQAL - Invesco Russell 1000 Equal Weight ETF This fund is a listed as child fund of Invesco Ltd. and if that institution has disclosed ownership in this security, then these positions will not be double counted when calculating total shares and total value | 12,436 | -5.41 | 452 | 15.31 | ||||
| 2025-08-08 | 13F | SBI Securities Co., Ltd. | 897 | 146.43 | 35 | 277.78 | ||||
| 2025-08-12 | 13F | American Century Companies Inc | 12,188 | 472 | ||||||
| 2025-07-28 | NP | MSLC - Morgan Stanley Pathway Large Cap Equity ETF | 1,897 | 0.00 | 69 | 23.21 | ||||
| 2025-05-30 | NP | SIFAX - SIMT MULTI-ASSET INFLATION MANAGED FUND Class F | 0 | -100.00 | 0 | -100.00 | ||||
| 2025-08-05 | 13F | Huntington National Bank | 428 | 0.00 | 17 | 45.45 | ||||
| 2025-08-14 | 13F | Fmr Llc | 22,646,048 | -13.56 | 877,761 | 25.35 | ||||
| 2025-08-14 | 13F | Headlands Technologies LLC | 55,078 | 9,512.22 | 2,135 | 14,126.67 | ||||
| 2025-08-13 | 13F | Mackenzie Financial Corp | 48,205 | 0.00 | 1,868 | 45.03 | ||||
| 2025-07-23 | 13F | GGM Financials LLC | 375,391 | 14,550 | ||||||
| 2025-08-14 | 13F | Susquehanna International Group, Llp | Put | 28,200 | -5.05 | 1,093 | 37.83 | |||
| 2025-08-12 | 13F | Legal & General Group Plc | 16,404 | 103.17 | 636 | 195.35 | ||||
| 2025-08-14 | 13F | Susquehanna International Group, Llp | Call | 196,000 | 713.28 | 7,597 | 1,079.50 | |||
| 2025-08-13 | 13F | Seven Grand Managers, Llc | 300,000 | 0.00 | 11,628 | 45.01 | ||||
| 2025-08-27 | NP | BBTSX - Bridge Builder Tax Managed Small/Mid Cap Fund | 131,862 | 0.00 | 5,111 | 45.01 | ||||
| 2025-08-14 | 13F | Woodson Capital Management, LP | 842,100 | -14.34 | 32,640 | 24.21 | ||||
| 2025-08-14 | 13F | Group One Trading, L.p. | 3,961 | -57.22 | 154 | -38.06 | ||||
| 2025-05-16 | 13F | Sciencast Management LP | 0 | -100.00 | 0 | |||||
| 2025-08-14 | 13F | Freestone Grove Partners LP | 96,839 | 3,753 | ||||||
| 2025-08-13 | 13F | Thornburg Investment Management Inc | 66,478 | -77.03 | 2,577 | -96.67 | ||||
| 2025-08-14 | 13F | Millennium Management Llc | 658,317 | 319.49 | 25,516 | 508.39 | ||||
| 2025-08-14 | 13F | Mariner, LLC | 6,453 | 250 | ||||||
| 2025-05-05 | 13F | Lindbrook Capital, Llc | 643 | 2.55 | 17 | 0.00 | ||||
| 2025-08-13 | 13F | Russell Investments Group, Ltd. | 29,750 | -92.53 | 1,153 | -89.18 | ||||
| 2025-08-12 | 13F | Jefferies Financial Group Inc. | 140,522 | 5,447 | ||||||
| 2025-07-23 | 13F | Maryland State Retirement & Pension System | 7,250 | 281 | ||||||
| 2025-08-14 | 13F | Hudson Bay Capital Management LP | Put | 0 | -100.00 | 0 | ||||
| 2025-07-31 | 13F | West Michigan Advisors, Llc | 6,911 | -59.05 | 268 | -40.80 | ||||
| 2025-08-14 | 13F | Two Sigma Investments, Lp | 505,418 | 61.42 | 19,590 | 134.08 | ||||
| 2025-08-26 | NP | IWB - iShares Russell 1000 ETF | 107,744 | 156.43 | 4,176 | 271.86 | ||||
| 2025-08-13 | 13F | Walleye Trading LLC | Call | 99,300 | 333.62 | 3,849 | 528.76 | |||
| 2025-08-14 | 13F | Goldman Sachs Group Inc | 1,233,736 | 5.12 | 47,820 | 52.43 | ||||
| 2025-07-21 | 13F | 111 Capital | 7,044 | 273 | ||||||
| 2025-08-13 | 13F | Walleye Trading LLC | Put | 25,100 | 50.30 | 973 | 117.94 | |||
| 2025-08-14 | 13F | Shellback Capital, LP | 787,000 | -9.54 | 30,504 | 31.17 | ||||
| 2025-06-30 | NP | IDMO - Invesco S&P International Developed Momentum ETF This fund is a listed as child fund of Invesco Ltd. and if that institution has disclosed ownership in this security, then these positions will not be double counted when calculating total shares and total value | 12,511 | 303 | ||||||
| 2025-07-25 | 13F | JustInvest LLC | 10,232 | 397 | ||||||
| 2025-07-17 | 13F | Halbert Hargrove Global Advisors, Llc | 0 | -100.00 | 0 | |||||
| 2025-07-30 | 13F | FNY Investment Advisers, LLC | 42,030 | 2 | ||||||
| 2025-08-11 | 13F | TD Waterhouse Canada Inc. | 12,119 | 474.91 | 456 | 714.29 | ||||
| 2025-08-14 | 13F | Schonfeld Strategic Advisors LLC | 347,028 | 385.76 | 13,451 | 604.56 | ||||
| 2025-08-07 | 13F | Parkside Financial Bank & Trust | 473 | 0.00 | 18 | 50.00 | ||||
| 2025-08-14 | 13F | Twinbeech Capital Lp | 74,566 | -84.90 | 2,890 | -78.11 | ||||
| 2025-08-14 | 13F | Lazard Asset Management Llc | 142,876 | 9.90 | 6 | 66.67 | ||||
| 2025-08-14 | 13F | Ghisallo Capital Management LLC | 1,000,000 | 2.56 | 38,760 | 48.73 | ||||
| 2025-08-12 | 13F | MAI Capital Management | 198 | 382.93 | 8 | 600.00 | ||||
| 2025-06-23 | NP | PPSFX - LargeCap Value Fund III R-3 | 1,307 | 0.00 | 32 | -24.39 | ||||
| 2025-08-14 | 13F | Ubs Asset Management Americas Inc | 66,635 | 2,583 | ||||||
| 2025-08-13 | 13F | Walleye Trading LLC | 0 | -100.00 | 0 | -100.00 | ||||
| 2025-09-04 | 13F/A | Advisor Group Holdings, Inc. | 74,793 | 2,898 | ||||||
| 2025-05-09 | 13F | Pamalican Asset Management Ltd | 0 | -100.00 | 0 | |||||
| 2025-08-29 | NP | BAFE - Brown Advisory Flexible Equity ETF | 712,911 | 14.19 | 27,632 | 65.59 | ||||
| 2025-08-14 | 13F | Aster Capital Management (DIFC) Ltd | 986 | -98.13 | 38 | -97.59 | ||||
| 2025-08-14 | 13F | Alliancebernstein L.p. | 84,696 | -62.95 | 3,283 | -46.28 | ||||
| 2025-05-07 | 13F | MRP Capital Investments, LLC | 0 | -100.00 | 0 | |||||
| 2025-08-14 | 13F | Boothbay Fund Management, Llc | 228,845 | -12.57 | 8,870 | 26.79 | ||||
| 2025-07-25 | 13F | Mitchell Capital Management Co | 59,389 | 2,285 | ||||||
| 2025-08-13 | 13F | Invesco Ltd. | 121,623 | 102.11 | 4,714 | 193.16 | ||||
| 2025-07-31 | 13F | Caitong International Asset Management Co., Ltd | 145 | 752.94 | 6 | |||||
| 2025-08-11 | 13F | Bell Investment Advisors, Inc | 126 | 250.00 | 5 | |||||
| 2025-08-06 | 13F | Tabor Asset Management, LP | 132,365 | 21.27 | 5,130 | 75.87 | ||||
| 2025-08-08 | 13F | Larson Financial Group LLC | 22 | 1 | ||||||
| 2025-08-01 | 13F | First Command Advisory Services, Inc. | 18 | 0.00 | 1 | |||||
| 2025-08-06 | 13F | True Wealth Design, LLC | 48 | 1,500.00 | 2 | |||||
| 2025-08-11 | 13F | Traub Capital Management LLC | 69 | 3 | ||||||
| 2025-08-12 | 13F | WealthTrak Capital Management LLC | 35 | -12.50 | 1 | 0.00 | ||||
| 2025-08-26 | NP | IWD - iShares Russell 1000 Value ETF | 331,711 | 129.92 | 12,857 | 233.43 | ||||
| 2025-08-14 | 13F | D. E. Shaw & Co., Inc. | 7,602,695 | 96.23 | 294,680 | 184.54 | ||||
| 2025-08-14 | 13F | Divisadero Street Capital Management, LP | 300,000 | 11,628 | ||||||
| 2025-08-14 | 13F | Nebula Research & Development LLC | 29,373 | 1,138 | ||||||
| 2025-07-21 | 13F | Lecap Asset Management Ltd | 0 | -100.00 | 0 | -100.00 | ||||
| 2025-08-12 | 13F | Coldstream Capital Management Inc | 0 | -100.00 | 0 | |||||
| 2025-08-11 | 13F | O'Neil Global Advisors, Inc. | 662,424 | 26 | ||||||
| 2025-08-14 | 13F | Xponance, Inc. | 7,508 | 291 | ||||||
| 2025-08-12 | 13F | Prudential Financial Inc | 113,780 | 546.66 | 4,410 | 838.30 | ||||
| 2025-08-28 | NP | QCSTRX - Stock Account Class R1 | 154,068 | 10.63 | 5,972 | 60.42 | ||||
| 2025-08-14 | 13F | Longaeva Partners L.P. | 540,000 | 20,930 | ||||||
| 2025-08-13 | 13F | Panagora Asset Management Inc | 0 | -100.00 | 0 | |||||
| 2025-07-22 | NP | DSMFX - Destinations Small-Mid Cap Equity Fund Class I | 473 | 0.00 | 17 | 21.43 | ||||
| 2025-05-14 | 13F | OMERS ADMINISTRATION Corp | 0 | -100.00 | 0 | |||||
| 2025-05-15 | 13F | Crestline Management, LP | 0 | -100.00 | 0 | |||||
| 2025-08-14 | 13F | Bnp Paribas Arbitrage, Sa | 2,533,612 | 244.50 | 98,203 | 399.55 | ||||
| 2025-08-14 | 13F/A | Barclays Plc | Call | 300,000 | 12 | |||||
| 2025-08-14 | 13F/A | Barclays Plc | 199,885 | 984.09 | 8 | |||||
| 2025-08-14 | 13F | Raymond James Financial Inc | 6,615 | 256 | ||||||
| 2025-08-12 | 13F | Deutsche Bank Ag\ | 1,438,386 | 23.95 | 55,752 | 79.73 | ||||
| 2025-05-15 | 13F | Polymer Capital Management (HK) LTD | Put | 0 | -100.00 | 0 | -100.00 | |||
| 2025-07-16 | 13F | West Branch Capital LLC | 1,007 | 0.00 | 39 | 50.00 | ||||
| 2025-08-13 | 13F | Scotia Capital Inc. | 50,440 | -0.79 | 1,955 | 43.96 | ||||
| 2025-08-13 | 13F | Twin Peaks Wealth Advisors, LLC | 3 | 0 | ||||||
| 2025-08-15 | 13F | Harvest Fund Management Co., Ltd | 2,818 | -77.01 | 0 | |||||
| 2025-08-11 | 13F | Vanguard Group Inc | 393,062 | 87.16 | 15,235 | 171.42 | ||||
| 2025-07-15 | 13F | Td Private Client Wealth Llc | 56 | -28.21 | 2 | 0.00 | ||||
| 2025-05-15 | 13F | Federation des caisses Desjardins du Quebec | 0 | -100.00 | 0 | |||||
| 2025-08-12 | 13F | Picton Mahoney Asset Management | 20,728 | 1 | ||||||
| 2025-08-18 | 13F | Geneos Wealth Management Inc. | 48 | -4.00 | 2 | 0.00 | ||||
| 2025-08-08 | 13F | Principal Financial Group Inc | 6,227 | 241 | ||||||
| 2025-08-14 | 13F | Quarry LP | 2,128 | 65.35 | 82 | 141.18 | ||||
| 2025-08-14 | 13F | Fosun International Ltd | 15,500 | 601 | ||||||
| 2025-08-08 | 13F/A | Sterling Capital Management LLC | 9,930 | 178.46 | 385 | 304.21 | ||||
| 2025-07-29 | NP | SECAX - SIIT Small Cap II Fund - Class A | 6,909 | -60.72 | 251 | -52.19 | ||||
| 2025-08-14 | 13F | Lighthouse Investment Partners, LLC | 61,002 | 2,364 | ||||||
| 2025-07-21 | 13F | Mirae Asset Global Investments Co., Ltd. | 4,864 | 189 | ||||||
| 2025-08-14 | 13F | KADENSA CAPITAL Ltd | 0 | -100.00 | 0 | |||||
| 2025-08-14 | 13F | Vident Advisory, LLC | 713,740 | 14.02 | 27,665 | 65.35 | ||||
| 2025-08-14 | 13F | Quantinno Capital Management LP | 29,496 | 64.02 | 1,143 | 138.13 | ||||
| 2025-08-13 | 13F | Quadrant Capital Group Llc | 0 | -100.00 | 0 | |||||
| 2025-08-14 | 13F | Viking Global Investors Lp | 3,880,649 | 64.83 | 150,414 | 139.01 | ||||
| 2025-08-06 | 13F | Agf Management Ltd | 176,030 | 141.25 | 6,823 | 249.85 | ||||
| 2025-08-08 | 13F | Creative Planning | 74,782 | 45.68 | 2,899 | 111.22 | ||||
| 2025-06-26 | NP | SMNCX - Steward Equity Market Neutral Fund Class C | Short | -34,000 | -0.00 | -824 | -24.13 | |||
| 2025-08-05 | 13F | Machina Capital S.a.s. | 68,403 | 386.23 | 2,651 | 605.05 | ||||
| 2025-08-13 | 13F | Amundi | 1,099,377 | 1,284.50 | 41,985 | 2,051.97 |
Other Listings
| DE:483 |