Mga Batayang Estadistika
| Pemilik Institusional | 181 total, 175 long only, 0 short only, 6 long/short - change of 8.38% MRQ |
| Alokasi Portofolio Rata-rata | 0.1433 % - change of -5.55% MRQ |
| Saham Institusional (Jangka Panjang) | 29,152,457 (ex 13D/G) - change of 3.68MM shares 14.45% MRQ |
| Nilai Institusional (Jangka Panjang) | $ 251,669 USD ($1000) |
Kepemilikan Institusional dan Pemegang Saham
Ecopetrol S.A. - Depositary Receipt (Common Stock) (US:EC) memiliki 181 pemilik institusional dan pemegang saham yang telah mengajukan formulir 13D/G atau 13F kepada Komisi Bursa Efek (Securities Exchange Commission/SEC). Lembaga-lembaga ini memegang total 29,152,457 saham. Pemegang saham terbesar meliputi Oaktree Capital Management Lp, Vanguard Group Inc, Russell Investments Group, Ltd., BlackRock, Inc., MIRAE ASSET GLOBAL ETFS HOLDINGS Ltd., Charles Schwab Investment Management Inc, FNDE - Schwab Fundamental Emerging Markets Large Company Index ETF, VEIEX - Vanguard Emerging Markets Stock Index Fund Investor Shares, ILF - iShares Latin America 40 ETF, and Candriam Luxembourg S.C.A. .
Struktur kepemilikan institusional Ecopetrol S.A. - Depositary Receipt (Common Stock) (NYSE:EC) menunjukkan posisi terkini di perusahaan oleh institusi dan dana, serta perubahan terbaru dalam ukuran posisi. Pemegang saham utama dapat mencakup investor individu, reksa dana, dana lindung nilai, atau institusi. Jadwal 13D menunjukkan bahwa investor memegang (atau pernah memegang) lebih dari 5% saham perusahaan dan bermaksud (atau pernah bermaksud) untuk secara aktif mengejar perubahan strategi bisnis. Jadwal 13G menunjukkan investasi pasif lebih dari 5%.
The share price as of September 5, 2025 is 9.08 / share. Previously, on September 6, 2024, the share price was 9.19 / share. This represents a decline of 1.20% over that period.

Skor Sentimen Dana
Skor Sentimen Dana (sebelumnya dikenal sebagai Skor Akumulasi Kepemilikan) menemukan saham-saham yang paling banyak dibeli oleh dana. Ini adalah hasil dari model kuantitatif multi-faktor yang canggih yang mengidentifikasi perusahaan dengan tingkat akumulasi institusional tertinggi. Model penilaian menggunakan kombinasi dari total peningkatan pemilik yang diungkapkan, perubahan dalam alokasi portofolio pada pemilik tersebut, dan metrik lainnya. Angka berkisar dari 0 hingga 100, dengan angka yang lebih tinggi menunjukkan tingkat akumulasi yang lebih tinggi dibandingkan dengan perusahaan sejenisnya, dan 50 adalah rata-ratanya.
Frekuensi Pembaruan: Setiap Hari
Lihat Ownership Explorer, yang menyediakan daftar perusahaan dengan peringkat tertinggi.
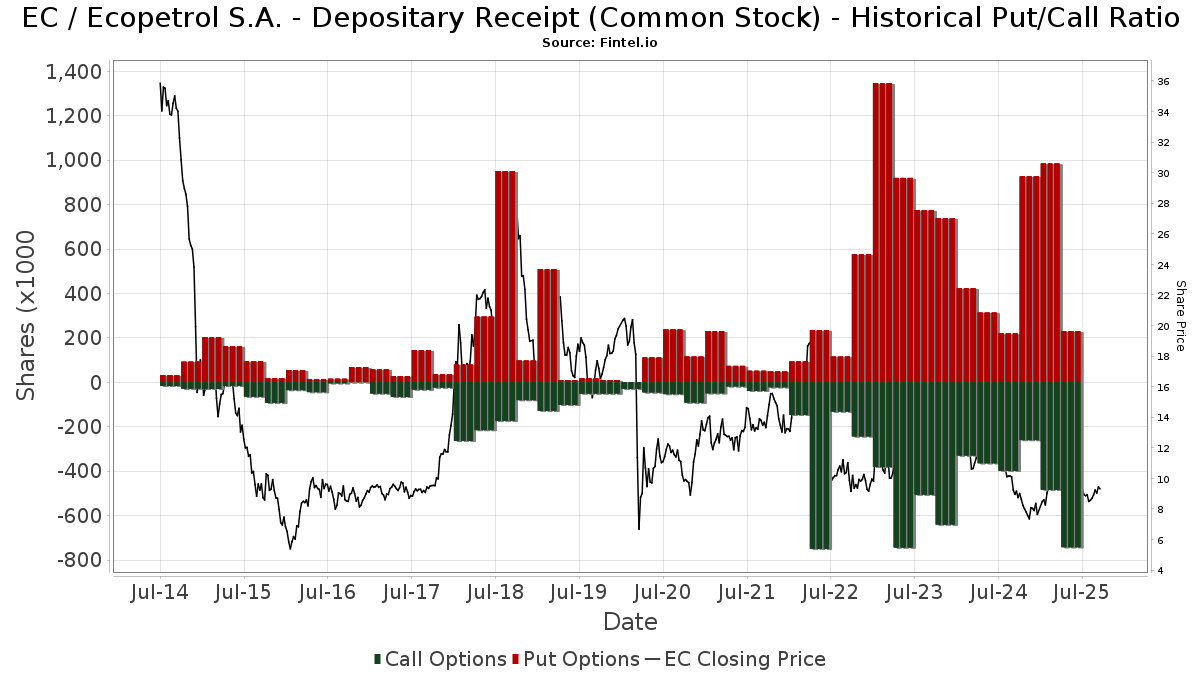
Rasio Put/Call Institusional
Selain melaporkan isu ekuitas dan utang standar, institusi dengan aset di bawah manajemen lebih dari 100 juta dolar AS juga harus mengungkapkan kepemilikan opsi put dan call mereka. Karena opsi put umumnya menunjukkan sentimen negatif, dan opsi call menunjukkan sentimen positif, kita dapat mengetahui sentimen institusional secara keseluruhan dengan memplot rasio put terhadap call. Grafik di sebelah kanan memplot rasio put/call historis untuk instrumen ini.
Menggunakan Rasio Put/Call sebagai indikator sentimen investor mengatasi salah satu kekurangan utama dari penggunaan total kepemilikan institusional, yaitu sejumlah besar aset yang dikelola diinvestasikan secara pasif untuk melacak indeks. Dana yang dikelola secara pasif biasanya tidak membeli opsi, sehingga indikator rasio put/call lebih akurat dalam melacak sentimen dana yang dikelola secara aktif.
Pengajuan 13F dan NPORT
Detail pada pengajuan 13F tersedia gratis. Detail pada pengajuan NP memerlukan keanggotaan premium. Baris berwarna hijau menunjukkan posisi baru. Baris berwarna merah menunjukkan posisi yang sudah ditutup. Klik tautan ini ikon untuk melihat riwayat transaksi selengkapnya.
Tingkatkan
untuk membuka data premium dan mengekspor ke Excel ![]() .
.
| Tanggal File | Sumber | Investor | Ketik | Presyo ng Avg (Silangan) |
Saham | Δ Saham (%) |
Dilaporkan Nilai ($1000) |
Nilai Δ (%) |
Alokasi Port (%) |
|
|---|---|---|---|---|---|---|---|---|---|---|
| 2025-08-26 | NP | RPAR - RPAR Risk Parity ETF | 27,176 | -6.27 | 241 | -20.53 | ||||
| 2025-05-15 | 13F | Bayesian Capital Management, LP | 0 | -100.00 | 0 | |||||
| 2025-08-14 | 13F | Hrt Financial Lp | 40,610 | 0 | ||||||
| 2025-08-08 | 13F | Candriam Luxembourg S.C.A. | 841,000 | 7,443 | ||||||
| 2025-08-07 | 13F | Rathbone Brothers plc | 17,575 | -2.23 | 156 | -17.11 | ||||
| 2025-04-23 | 13F | Legacy Advisors, LLC | 0 | -100.00 | 0 | |||||
| 2025-07-14 | 13F | Sowell Financial Services LLC | 11,468 | 3.29 | 101 | -12.17 | ||||
| 2025-08-13 | 13F | Walleye Trading LLC | Call | 228,400 | 2,021 | |||||
| 2025-08-18 | 13F/A | National Bank Of Canada /fi/ | 145 | -99.25 | 1 | -99.50 | ||||
| 2025-08-13 | 13F | Walleye Trading LLC | Put | 20,900 | -83.50 | 185 | -86.08 | |||
| 2025-08-05 | 13F | Simplex Trading, Llc | Put | 47,700 | -51.67 | 0 | -100.00 | |||
| 2025-08-05 | 13F | Simplex Trading, Llc | Call | 97,900 | 21.46 | 1 | ||||
| 2025-08-12 | 13F | O'shaughnessy Asset Management, Llc | 50,363 | 397.90 | 446 | 323.81 | ||||
| 2025-08-29 | NP | LIVR - Intelligent Livermore ETF | 18,077 | 160 | ||||||
| 2025-08-14 | 13F | D. E. Shaw & Co., Inc. | 208,080 | 1,842 | ||||||
| 2025-08-13 | 13F | Walleye Trading LLC | 0 | -100.00 | 0 | -100.00 | ||||
| 2025-08-13 | 13F | Virtus Investment Advisers, Inc. | 17,435 | -11.14 | 154 | -24.51 | ||||
| 2025-08-11 | 13F | Truffle Hound Capital, LLC | 550,000 | 83.33 | 4,868 | 55.40 | ||||
| 2025-07-30 | 13F | DekaBank Deutsche Girozentrale | 20,000 | 0.00 | 0 | |||||
| 2025-08-14 | 13F | Militia Capital Partners, LP | 556,200 | 16.07 | 4,922 | -1.60 | ||||
| 2025-05-09 | 13F | R Squared Ltd | 0 | -100.00 | 0 | |||||
| 2025-08-14 | 13F | Susquehanna International Group, Llp | 34,063 | -85.16 | 301 | -87.44 | ||||
| 2025-08-14 | 13F | Susquehanna International Group, Llp | Call | 163,900 | -16.63 | 1,451 | -29.34 | |||
| 2025-08-14 | 13F | Susquehanna International Group, Llp | Put | 51,700 | -91.38 | 458 | -92.70 | |||
| 2025-07-28 | NP | AVEEX - Avantis Emerging Markets Equity Fund Institutional Class This fund is a listed as child fund of American Century Companies Inc and if that institution has disclosed ownership in this security, then these positions will not be double counted when calculating total shares and total value | 3,730 | 0.00 | 32 | -13.89 | ||||
| 2025-08-11 | 13F | Empirical Finance, LLC | 300,866 | 73.90 | 2,663 | 47.40 | ||||
| 2025-08-13 | 13F | Manning & Napier Advisors Llc | 213,858 | 34.97 | 1,893 | 14.39 | ||||
| 2025-08-14 | 13F | Group One Trading, L.p. | 52,176 | 25.29 | 462 | 6.22 | ||||
| 2025-08-14 | 13F | Group One Trading, L.p. | Put | 58,500 | 5.60 | 518 | -10.55 | |||
| 2025-08-12 | 13F | Legal & General Group Plc | 149,470 | 0.00 | 1,322 | -15.36 | ||||
| 2025-08-14 | 13F | Group One Trading, L.p. | Call | 102,300 | 80.11 | 905 | 52.87 | |||
| 2025-03-17 | NP | ABLD - Donoghue Forlines Yield Enhanced Real Asset ETF | 11,031 | -49.51 | 102 | -39.29 | ||||
| 2025-08-14 | 13F | Gotham Asset Management, LLC | 10,000 | 0.00 | 88 | -15.38 | ||||
| 2025-05-06 | 13F | Cetera Investment Advisers | 0 | -100.00 | 0 | |||||
| 2025-08-13 | 13F | Russell Investments Group, Ltd. | 1,903,377 | -6.86 | 16,845 | -21.05 | ||||
| 2025-08-12 | 13F | CIBC Private Wealth Group, LLC | 251 | 2 | ||||||
| 2025-08-28 | NP | Principal Diversified Select Real Asset Fund | 389 | 0.00 | 3 | -25.00 | ||||
| 2025-06-18 | NP | RAZAX - Multi-Asset Growth Strategy Fund Class A | 13,826 | 0.00 | 112 | -12.50 | ||||
| 2025-06-18 | NP | RMYAX - Multi-Strategy Income Fund Class A | 4,238 | 0.00 | 34 | -12.82 | ||||
| 2025-08-06 | 13F | Metis Global Partners, LLC | 11,773 | 104 | ||||||
| 2025-08-26 | NP | GLBIX - Leuthold Global Fund Institutional Class | 6,745 | 60 | ||||||
| 2025-07-21 | 13F | Ping Capital Management, Inc. | 39,000 | 8.33 | 345 | -8.00 | ||||
| 2025-08-25 | NP | MAINSTAY VP FUNDS TRUST - MainStay VP Emerging Markets Equity Portfolio Initial Class | 120,000 | 42.86 | 1,062 | 16.45 | ||||
| 2025-08-26 | NP | EQ ADVISORS TRUST - EQ/International Core Managed Volatility Portfolio Class IB | 60,372 | -9.14 | 534 | -22.94 | ||||
| 2025-08-13 | 13F | First Trust Advisors Lp | 0 | -100.00 | 0 | |||||
| 2025-08-15 | 13F | Earnest Partners Llc | 443,848 | -3.13 | 3,928 | -17.88 | ||||
| 2025-08-14 | 13F | Balyasny Asset Management Llc | 0 | -100.00 | 0 | |||||
| 2025-09-04 | 13F/A | Advisor Group Holdings, Inc. | 146,072 | 24.36 | 1,293 | 5.38 | ||||
| 2025-08-06 | 13F | Pekin Hardy Strauss, Inc. | 124,573 | 3.75 | 1,102 | -12.05 | ||||
| 2025-08-01 | 13F | Y-Intercept (Hong Kong) Ltd | 252,697 | 2,236 | ||||||
| 2025-08-14 | 13F | Axa S.a. | 30,620 | 271 | ||||||
| 2025-08-11 | 13F | Principal Securities, Inc. | 0 | -100.00 | 0 | |||||
| 2025-08-14 | 13F | Wetherby Asset Management Inc | 12,769 | -12.08 | 113 | -1.74 | ||||
| 2025-08-14 | 13F | Ameriprise Financial Inc | 0 | -100.00 | 0 | |||||
| 2025-08-15 | 13F | Tower Research Capital LLC (TRC) | 2,933 | -45.89 | 26 | -55.36 | ||||
| 2025-08-14 | 13F | Citadel Advisors Llc | 173,200 | -37.57 | 1,533 | -47.10 | ||||
| 2025-06-20 | NP | ABLG - TrimTabs All Cap International Free-Cash-Flow ETF | 0 | -100.00 | 0 | -100.00 | ||||
| 2025-08-14 | 13F | Citadel Advisors Llc | Put | 23,400 | -29.52 | 207 | -40.17 | |||
| 2025-08-14 | 13F | Stifel Financial Corp | 29,586 | 0.33 | 262 | -14.98 | ||||
| 2025-08-26 | NP | ILF - iShares Latin America 40 ETF | 864,786 | 9.35 | 7,653 | -7.30 | ||||
| 2025-08-14 | 13F | Citadel Advisors Llc | Call | 118,600 | 1.37 | 1,050 | -14.09 | |||
| 2025-07-11 | 13F | Farther Finance Advisors, LLC | 1,625 | -5.08 | 14 | -22.22 | ||||
| 2025-08-13 | 13F | Leuthold Group, Llc | 26,071 | 231 | ||||||
| 2025-08-13 | 13F | Northwestern Mutual Wealth Management Co | 0 | -100.00 | 0 | |||||
| 2025-07-25 | NP | FNDE - Schwab Fundamental Emerging Markets Large Company Index ETF This fund is a listed as child fund of Charles Schwab Investment Management Inc and if that institution has disclosed ownership in this security, then these positions will not be double counted when calculating total shares and total value | 927,528 | 46.99 | 7,856 | 26.02 | ||||
| 2025-08-13 | 13F | Marshall Wace, Llp | 37,600 | 333 | ||||||
| 2025-04-22 | 13F | Synergy Financial Management, LLC | 0 | -100.00 | 0 | |||||
| 2025-07-14 | 13F | GAMMA Investing LLC | 20,679 | -20.81 | 183 | -32.72 | ||||
| 2025-08-12 | 13F | Global Retirement Partners, LLC | 498 | 12.42 | 4 | 33.33 | ||||
| 2025-08-13 | 13F | EverSource Wealth Advisors, LLC | 1,707 | 1,023.03 | 15 | 1,400.00 | ||||
| 2025-08-08 | 13F | Avantax Advisory Services, Inc. | 37,856 | 273.22 | 335 | 219.05 | ||||
| 2025-08-13 | 13F | Oaktree Capital Management Lp | 3,549,822 | 12.26 | 31,416 | -4.84 | ||||
| 2025-08-04 | 13F | Spire Wealth Management | 2,500 | -69.51 | 22 | -74.12 | ||||
| 2025-08-05 | 13F | GHP Investment Advisors, Inc. | 0 | -100.00 | 0 | |||||
| 2025-08-26 | NP | OEQAX - Oaktree Emerging Markets Equity Fund Class A | 207,885 | 3.48 | 1,840 | -12.30 | ||||
| 2025-07-18 | 13F | Robeco Institutional Asset Management B.V. | 99,796 | 0.00 | 883 | -15.18 | ||||
| 2025-07-21 | 13F | Patriot Financial Group Insurance Agency, LLC | 19,780 | 175 | ||||||
| 2025-08-14 | 13F | Two Sigma Investments, Lp | 222,160 | 26.24 | 1,966 | 7.02 | ||||
| 2025-08-06 | 13F | Stokes Family Office, LLC | 212,808 | 25.19 | 1,883 | 6.14 | ||||
| 2025-07-25 | NP | PRDAX - Diversified Real Asset Fund Class A | 4,662 | 48.42 | 39 | 25.81 | ||||
| 2025-08-14 | 13F | Goldman Sachs Group Inc | 612,058 | -0.41 | 5,417 | -15.59 | ||||
| 2025-05-14 | 13F | Public Employees Retirement System Of Ohio | 0 | -100.00 | 0 | |||||
| 2025-07-07 | 13F | Thurston, Springer, Miller, Herd & Titak, Inc. | 26 | 0 | ||||||
| 2025-07-24 | 13F | Us Bancorp \de\ | 2,069 | 0.00 | 18 | -14.29 | ||||
| 2025-08-14 | 13F | State Street Corp | 281,818 | 0.27 | 2,494 | -15.00 | ||||
| 2025-07-21 | 13F | Qrg Capital Management, Inc. | 0 | -100.00 | 0 | |||||
| 2025-08-12 | 13F | Proequities, Inc. | Put | 0 | 0 | |||||
| 2025-08-12 | 13F | Proequities, Inc. | Call | 0 | 0 | |||||
| 2025-08-12 | 13F | Proequities, Inc. | 0 | 0 | ||||||
| 2025-08-13 | 13F | Northern Trust Corp | 118,193 | -6.16 | 1,046 | -20.40 | ||||
| 2025-05-13 | 13F | Wealthedge Investment Advisors, Llc | 0 | -100.00 | 0 | |||||
| 2025-05-15 | 13F | D. E. Shaw & Co., Inc. | Put | 0 | -100.00 | 0 | -100.00 | |||
| 2025-08-12 | 13F | Advisors Asset Management, Inc. | 83,564 | -7.52 | 740 | -21.63 | ||||
| 2025-08-14 | 13F/A | Skopos Labs, Inc. | 36,136 | 138.76 | 320 | 101.90 | ||||
| 2025-08-11 | 13F | Citigroup Inc | 217,491 | -0.75 | 1,925 | -15.87 | ||||
| 2025-08-12 | 13F | LPL Financial LLC | 112,205 | 9.91 | 993 | -6.76 | ||||
| 2025-05-12 | 13F | Connor, Clark & Lunn Investment Management Ltd. | 0 | -100.00 | 0 | -100.00 | ||||
| 2025-07-15 | 13F | Compagnie Lombard Odier SCmA | 0 | -100.00 | 0 | -100.00 | ||||
| 2025-05-14 | 13F | FORA Capital, LLC | 0 | -100.00 | 0 | |||||
| 2025-07-28 | NP | NSI - National Security Emerging Markets Index ETF | 2,485 | 38.44 | 21 | 23.53 | ||||
| 2025-08-14 | 13F | Vident Advisory, LLC | 49,191 | -2.57 | 435 | -17.46 | ||||
| 2025-04-15 | 13F | TrimTabs Asset Management, LLC | 0 | -100.00 | 0 | |||||
| 2025-07-31 | 13F | Caitong International Asset Management Co., Ltd | 698 | 35.53 | 6 | 20.00 | ||||
| 2025-08-11 | 13F | Empowered Funds, LLC | 318,943 | 2,823 | ||||||
| 2025-07-29 | NP | SSEAX - SIIT Screened World Equity Ex-US Fund - Class A | 6,263 | 53 | ||||||
| 2025-08-20 | NP | REMG - Emerging Markets Equity Active ETF | 6,895 | 61 | ||||||
| 2025-08-13 | 13F | Fisher Asset Management, LLC | 456,819 | 3.15 | 4,043 | -12.57 | ||||
| 2025-07-16 | 13F | ORG Partners LLC | 375 | -28.98 | 3 | -40.00 | ||||
| 2025-08-14 | 13F | Verition Fund Management LLC | 309,922 | 124.49 | 2,743 | 90.28 | ||||
| 2025-08-26 | NP | UPAR - UPAR Ultra Risk Parity ETF | 4,494 | -11.20 | 40 | -25.00 | ||||
| 2025-08-15 | 13F | Great West Life Assurance Co /can/ | 6,874 | 0.00 | 0 | |||||
| 2025-08-12 | 13F | MAI Capital Management | 491 | 4 | ||||||
| 2025-08-07 | 13F | Sierra Ocean, Llc | 125 | 0.00 | 1 | 0.00 | ||||
| 2025-08-14 | 13F | Sona Asset Management (us) Llc | 200,000 | 100.00 | 1,770 | 69.54 | ||||
| 2025-07-15 | 13F | Ballentine Partners, LLC | 12,483 | -22.60 | 110 | -34.52 | ||||
| 2025-05-05 | 13F | Lindbrook Capital, Llc | 4,746 | -0.79 | 50 | 32.43 | ||||
| 2025-08-14 | 13F | UBS Group AG | 760,367 | 62.38 | 6,729 | 37.66 | ||||
| 2025-08-14 | 13F | Massar Capital Management, LP | 40,000 | 0.00 | 354 | -15.11 | ||||
| 2025-08-04 | 13F | Assetmark, Inc | 71 | 1 | ||||||
| 2025-08-14 | 13F | Aquatic Capital Management LLC | 0 | -100.00 | 0 | |||||
| 2025-06-25 | NP | VRAI - Virtus Real Asset Income ETF | 15,324 | -21.04 | 124 | -31.11 | ||||
| 2025-07-08 | 13F | Parallel Advisors, LLC | 5,440 | -3.68 | 48 | -17.24 | ||||
| 2025-08-14 | 13F | Royal Bank Of Canada | 258,225 | 12,753.41 | 2,285 | 10,780.95 | ||||
| 2025-08-14 | 13F | Barometer Capital Management Inc. | 43,400 | 45.15 | 384 | 36.65 | ||||
| 2025-08-26 | NP | IXC - iShares Global Energy ETF | 164,711 | 1.04 | 1,458 | -14.34 | ||||
| 2025-07-21 | 13F | Platinum Investment Management Ltd | 14,711 | 0.00 | 130 | -15.03 | ||||
| 2025-05-12 | 13F | Simplex Trading, Llc | 0 | -100.00 | 0 | |||||
| 2025-08-12 | 13F | Jpmorgan Chase & Co | 82,728 | -90.68 | 732 | -92.10 | ||||
| 2025-07-28 | 13F | Allianz Asset Management GmbH | 451,674 | 3,997 | ||||||
| 2025-08-14 | 13F | Wealth High Governance Capital Ltda | 186,000 | 0.00 | 1,646 | -15.20 | ||||
| 2025-05-09 | 13F | X-Square Capital, LLC | 0 | -100.00 | 0 | |||||
| 2025-08-14 | 13F | Schonfeld Strategic Advisors LLC | 181,551 | 202.85 | 1,607 | 156.96 | ||||
| 2025-08-14 | 13F | Mariner, LLC | 33,356 | -2.79 | 295 | -17.60 | ||||
| 2025-08-01 | 13F | Envestnet Asset Management Inc | 10,458 | 93 | ||||||
| 2025-08-12 | 13F | XTX Topco Ltd | 0 | -100.00 | 0 | |||||
| 2025-08-14 | 13F | Integrated Wealth Concepts LLC | 31,966 | 283 | ||||||
| 2025-08-11 | 13F | EntryPoint Capital, LLC | 17,568 | 7.25 | 155 | -9.36 | ||||
| 2025-08-11 | 13F | Private Advisor Group, LLC | 25,797 | 9.49 | 228 | -6.94 | ||||
| 2025-08-13 | 13F | Capital Fund Management S.a. | 165,697 | 529.64 | 1,466 | 435.04 | ||||
| 2025-07-21 | 13F | Mirae Asset Global Investments Co., Ltd. | 4,794 | 8.27 | 42 | -6.67 | ||||
| 2025-07-30 | 13F | Blume Capital Management, Inc. | 0 | -100.00 | 0 | |||||
| 2025-08-14 | 13F | Two Sigma Securities, Llc | 29,342 | 50.42 | 260 | 27.59 | ||||
| 2025-06-30 | NP | VIHAX - Vanguard International High Dividend Yield Index Fund Admiral Shares | 161,378 | 11.70 | 1,309 | -2.39 | ||||
| 2025-07-16 | 13F | Signaturefd, Llc | 7,452 | -32.96 | 66 | -43.97 | ||||
| 2025-08-14 | 13F | Graham Capital Management, L.P. | 0 | -100.00 | 0 | |||||
| 2025-08-13 | 13F | Oaktree Fund Advisors, LLC | 207,885 | 3.48 | 1,840 | -12.30 | ||||
| 2025-05-29 | NP | Jnl Series Trust - Jnl/jpmorgan Global Allocation Fund (a) | 14,515 | 0.00 | 152 | 32.46 | ||||
| 2025-06-18 | NP | REMSX - Emerging Markets Fund Class S | 90,383 | 48.38 | 733 | 29.73 | ||||
| 2025-06-30 | NP | VT - Vanguard Total World Stock Index Fund ETF Shares | 108,766 | 30.91 | 882 | 14.40 | ||||
| 2025-08-14 | 13F | Smartleaf Asset Management LLC | 2,759 | 25 | ||||||
| 2025-08-12 | 13F | Charles Schwab Investment Management Inc | 1,180,354 | 16.00 | 10,446 | -1.67 | ||||
| 2025-08-14 | 13F | Bnp Paribas Arbitrage, Sa | 47,918 | -16.54 | 424 | -29.22 | ||||
| 2025-08-13 | 13F | Schroder Investment Management Group | 100,294 | 888 | ||||||
| 2025-08-13 | 13F | Jump Financial, LLC | 36,614 | 324 | ||||||
| 2025-08-13 | 13F | Invesco Ltd. | 74,265 | -9.38 | 657 | -23.16 | ||||
| 2025-06-18 | NP | RTNAX - Tax-Managed International Equity Fund Class A | 263,904 | 97.85 | 2,140 | 73.00 | ||||
| 2025-07-29 | 13F | Straight Path Wealth Management | 0 | -100.00 | 0 | |||||
| 2025-07-25 | 13F | JustInvest LLC | 18,628 | 2.61 | 165 | -13.23 | ||||
| 2025-08-12 | 13F | BlackRock, Inc. | 1,316,556 | -0.89 | 11,652 | -15.99 | ||||
| 2025-08-14 | 13F | Millennium Management Llc | 261,079 | 325.96 | 2,311 | 261.50 | ||||
| 2025-08-14 | 13F | BW Gestao de Investimentos Ltda. | 114,000 | 0.00 | 1,009 | -15.29 | ||||
| 2025-07-31 | 13F | MQS Management LLC | 15,401 | 136 | ||||||
| 2025-08-12 | 13F | Aigen Investment Management, Lp | 13,444 | 119 | ||||||
| 2025-07-30 | NP | APIE - ActivePassive International Equity ETF | 91,498 | 775 | ||||||
| 2025-08-19 | 13F | State of Wyoming | 0 | -100.00 | 0 | |||||
| 2025-08-14 | 13F | Bridgefront Capital, LLC | 18,058 | 160 | ||||||
| 2025-05-14 | 13F | Virtus ETF Advisers LLC | 0 | -100.00 | 0 | |||||
| 2025-08-08 | 13F | JBF Capital, Inc. | 20,000 | 0.00 | 177 | -14.90 | ||||
| 2025-08-08 | 13F | Larson Financial Group LLC | 466 | 27.32 | 4 | 33.33 | ||||
| 2025-07-11 | 13F | Kingstone Capital Partners Texas, LLC | 285,360 | 3 | ||||||
| 2025-05-22 | NP | FTRI - First Trust Indxx Global Natural Resources Income ETF This fund is a listed as child fund of First Trust Advisors Lp and if that institution has disclosed ownership in this security, then these positions will not be double counted when calculating total shares and total value | 400,293 | -28.25 | 4,179 | -5.41 | ||||
| 2025-07-14 | 13F | Ridgewood Investments LLC | 2,479 | 0.00 | 22 | -16.00 | ||||
| 2025-08-14 | 13F | Jane Street Group, Llc | Put | 28,000 | -60.89 | 248 | -66.93 | |||
| 2025-08-14 | 13F | Jane Street Group, Llc | Call | 31,600 | -1.86 | 280 | -16.96 | |||
| 2025-08-14 | 13F | Lazard Asset Management Llc | 256,505 | 39.46 | 2 | 100.00 | ||||
| 2025-08-14 | 13F | Jane Street Group, Llc | 200,125 | 465.34 | 1,771 | 379.95 | ||||
| 2025-08-14 | 13F | Brevan Howard Capital Management LP | 150,000 | 1,330 | ||||||
| 2025-08-06 | 13F | Fox Run Management, L.l.c. | 38,157 | 144.36 | 338 | 106.75 | ||||
| 2025-08-08 | 13F | SBI Securities Co., Ltd. | 221,044 | 1.31 | 1,956 | -14.10 | ||||
| 2025-08-13 | 13F | Arrowstreet Capital, Limited Partnership | 0 | -100.00 | 0 | |||||
| 2025-08-12 | 13F | Rhumbline Advisers | 4,385 | 19.00 | 39 | 0.00 | ||||
| 2025-08-07 | 13F | Allworth Financial LP | 1,432 | -11.99 | 13 | -20.00 | ||||
| 2025-08-13 | 13F | Quadrant Capital Group Llc | 0 | -100.00 | 0 | |||||
| 2025-07-01 | 13F | Confluence Investment Management Llc | 12,947 | -8.04 | 115 | -21.92 | ||||
| 2025-08-12 | 13F | Virtu Financial LLC | 27,935 | 0 | ||||||
| 2025-06-24 | NP | SFENX - Schwab Fundamental Emerging Markets Large Company Index Fund Institutional Shares | 133,853 | 104.63 | 1,086 | 78.75 | ||||
| 2025-08-14 | 13F | Engineers Gate Manager LP | 91,266 | -9.45 | 808 | -23.29 | ||||
| 2025-07-28 | NP | AVEM - Avantis Emerging Markets Equity ETF This fund is a listed as child fund of American Century Companies Inc and if that institution has disclosed ownership in this security, then these positions will not be double counted when calculating total shares and total value | 422,044 | 20.98 | 3,575 | 3.71 | ||||
| 2025-08-14 | 13F | Glenorchy Capital Ltd | 59,391 | 6.04 | 526 | -10.10 | ||||
| 2025-07-18 | 13F | B.O.S.S. Retirement Advisors, LLC | 0 | -100.00 | 0 | |||||
| 2025-06-27 | NP | SDIV - Global X SuperDividend ETF This fund is a listed as child fund of Mirae Asset Global Investments Co., Ltd. and if that institution has disclosed ownership in this security, then these positions will not be double counted when calculating total shares and total value | 773,445 | 3.13 | 6,273 | -9.87 | ||||
| 2025-08-28 | NP | GNR - SPDR(R) S&P(R) Global Natural Resources ETF | 170,004 | 1.73 | 1,505 | -13.76 | ||||
| 2025-08-13 | 13F | Quantbot Technologies LP | 44,580 | -68.09 | 395 | -72.98 | ||||
| 2025-07-29 | NP | WEUSX - Siit World Equity Ex-us Fund - Class A | 215,298 | 1,824 | ||||||
| 2025-07-09 | 13F | St. Louis Financial Planners Asset Management, LLC | 17,508 | -3.89 | 155 | -18.95 | ||||
| 2025-08-12 | 13F | American Century Companies Inc | 448,060 | 22.17 | 3,965 | 3.58 | ||||
| 2025-06-30 | NP | VEU - Vanguard FTSE All-World ex-US Index Fund ETF Shares | 216,425 | 11.27 | 1,755 | -2.72 | ||||
| 2025-07-31 | 13F | Nisa Investment Advisors, Llc | 500 | 0.00 | 4 | -20.00 | ||||
| 2025-08-05 | 13F | Strategic Financial Concepts, LLC | 16,400 | 0.00 | 146 | 0.00 | ||||
| 2025-08-11 | 13F | Anfield Capital Management, LLC | 8,988 | 0.00 | 80 | -15.05 | ||||
| 2025-04-15 | 13F | SG Americas Securities, LLC | 0 | -100.00 | 0 | |||||
| 2025-08-08 | 13F | Creative Planning | 41,975 | -29.19 | 371 | -39.97 | ||||
| 2025-07-25 | 13F | LRI Investments, LLC | 64 | 0.00 | 1 | |||||
| 2025-07-31 | 13F | Brinker Capital Investments, LLC | 0 | -100.00 | 0 | -100.00 | ||||
| 2025-08-14 | 13F | Hilltop Holdings Inc. | 51,186 | 0.13 | 453 | -15.20 | ||||
| 2025-08-11 | 13F | Vanguard Group Inc | 3,206,459 | -0.25 | 28,377 | -15.44 | ||||
| 2025-05-15 | 13F | Qube Research & Technologies Ltd | 0 | -100.00 | 0 | |||||
| 2025-05-15 | 13F | Two Sigma Advisers, Lp | 0 | -100.00 | 0 | |||||
| 2025-03-28 | NP | GAOAX - JPMorgan Global Allocation Fund Class A | 45,289 | 70.59 | 420 | 36.36 | ||||
| 2025-08-15 | 13F | Morgan Stanley | 413,805 | 34.87 | 3,662 | 14.33 | ||||
| 2025-07-30 | NP | ORR - Militia Long/Short Equity ETF | 285,146 | 158.92 | 2,415 | 121.97 | ||||
| 2025-06-23 | NP | UBPIX - Ultralatin America Profund Investor Class | 4,897 | -5.19 | 40 | 0.00 | ||||
| 2025-08-14 | 13F | Wells Fargo & Company/mn | 53,742 | 162.71 | 476 | 123.00 | ||||
| 2025-08-07 | 13F | Parkside Financial Bank & Trust | 136 | 1 | ||||||
| 2025-08-27 | 13F/A | Squarepoint Ops LLC | 21,108 | 26.66 | 187 | 7.51 | ||||
| 2025-07-29 | NP | SEPIX - Energy & Basic Materials Portfolio Energy & Basic Materials Class I | 1,516 | -2.13 | 13 | -20.00 | ||||
| 2025-07-22 | 13F | Sage Investment Counsel LLC | 11,500 | 0.00 | 102 | -15.83 | ||||
| 2025-08-08 | 13F | Pnc Financial Services Group, Inc. | 11 | 0.00 | 0 | |||||
| 2025-07-24 | 13F | IFP Advisors, Inc | 0 | -100.00 | 0 | |||||
| 2025-03-28 | NP | EMRSX - JPMorgan Emerging Markets Research Enhanced Equity Fund Class R6 | 208,881 | -0.41 | 1,938 | 20.00 | ||||
| 2025-08-14 | 13F | Raymond James Financial Inc | 2,648 | 23 | ||||||
| 2025-06-30 | NP | VEIEX - Vanguard Emerging Markets Stock Index Fund Investor Shares | 898,446 | 1.85 | 7,286 | -10.99 | ||||
| 2025-08-14 | 13F | Banco BTG Pactual S.A. | 26,740 | 237 | ||||||
| 2025-08-14 | 13F | Bank Of America Corp /de/ | 257,265 | 14.83 | 2,277 | -2.65 | ||||
| 2025-08-04 | 13F | Hantz Financial Services, Inc. | 28,152 | 1,482.46 | 0 | |||||
| 2025-08-14 | 13F | MIRAE ASSET GLOBAL ETFS HOLDINGS Ltd. | 1,190,268 | 9.42 | 10,534 | -7.25 | ||||
| 2025-08-12 | 13F | Atlas Capital Advisors Llc | 12,417 | 477.00 | 110 | 395.45 | ||||
| 2025-07-24 | 13F | Ronald Blue Trust, Inc. | 1,889 | 120.16 | 17 | 100.00 | ||||
| 2025-08-12 | 13F | SRS Capital Advisors, Inc. | 1,500 | 0.00 | 16 | 6.67 | ||||
| 2025-07-28 | NP | AVXC - Avantis Emerging Markets ex-China Equity ETF | 5,164 | 218.18 | 44 | 168.75 | ||||
| 2025-05-09 | 13F | Headlands Technologies LLC | 0 | -100.00 | 0 | |||||
| 2025-08-14 | 13F | Kerrisdale Advisers, LLC | 67,555 | 0.00 | 598 | -15.32 | ||||
| 2025-08-06 | 13F | Prospera Financial Services Inc | 0 | -100.00 | 0 | -100.00 | ||||
| 2025-08-14 | 13F | Toroso Investments, LLC | 31,670 | -7.00 | 280 | -21.13 | ||||
| 2025-08-13 | 13F | Amundi | 0 | -100.00 | 0 |