Mga Batayang Estadistika
| Pemilik Institusional | 239 total, 232 long only, 0 short only, 7 long/short - change of 21.94% MRQ |
| Alokasi Portofolio Rata-rata | 0.3986 % - change of -10.89% MRQ |
| Saham Institusional (Jangka Panjang) | 21,311,696 (ex 13D/G) - change of -0.64MM shares -2.93% MRQ |
| Nilai Institusional (Jangka Panjang) | $ 1,256,389 USD ($1000) |
Kepemilikan Institusional dan Pemegang Saham
iShares, Inc. - iShares MSCI Mexico ETF (US:EWW) memiliki 239 pemilik institusional dan pemegang saham yang telah mengajukan formulir 13D/G atau 13F kepada Komisi Bursa Efek (Securities Exchange Commission/SEC). Lembaga-lembaga ini memegang total 21,311,696 saham. Pemegang saham terbesar meliputi M&G Plc, Goldman Sachs Group Inc, UBS Group AG, Morgan Stanley, Hsbc Holdings Plc, Jpmorgan Chase & Co, LPL Financial LLC, TTIFX - Goldman Sachs Tactical Tilt Overlay Fund Institutional Shares, Jane Street Group, Llc, and Royal Bank Of Canada .
Struktur kepemilikan institusional iShares, Inc. - iShares MSCI Mexico ETF (ARCA:EWW) menunjukkan posisi terkini di perusahaan oleh institusi dan dana, serta perubahan terbaru dalam ukuran posisi. Pemegang saham utama dapat mencakup investor individu, reksa dana, dana lindung nilai, atau institusi. Jadwal 13D menunjukkan bahwa investor memegang (atau pernah memegang) lebih dari 5% saham perusahaan dan bermaksud (atau pernah bermaksud) untuk secara aktif mengejar perubahan strategi bisnis. Jadwal 13G menunjukkan investasi pasif lebih dari 5%.
The share price as of August 29, 2025 is 61.94 / share. Previously, on September 3, 2024, the share price was 52.05 / share. This represents an increase of 19.00% over that period.

Skor Sentimen Dana
Skor Sentimen Dana (sebelumnya dikenal sebagai Skor Akumulasi Kepemilikan) menemukan saham-saham yang paling banyak dibeli oleh dana. Ini adalah hasil dari model kuantitatif multi-faktor yang canggih yang mengidentifikasi perusahaan dengan tingkat akumulasi institusional tertinggi. Model penilaian menggunakan kombinasi dari total peningkatan pemilik yang diungkapkan, perubahan dalam alokasi portofolio pada pemilik tersebut, dan metrik lainnya. Angka berkisar dari 0 hingga 100, dengan angka yang lebih tinggi menunjukkan tingkat akumulasi yang lebih tinggi dibandingkan dengan perusahaan sejenisnya, dan 50 adalah rata-ratanya.
Frekuensi Pembaruan: Setiap Hari
Lihat Ownership Explorer, yang menyediakan daftar perusahaan dengan peringkat tertinggi.
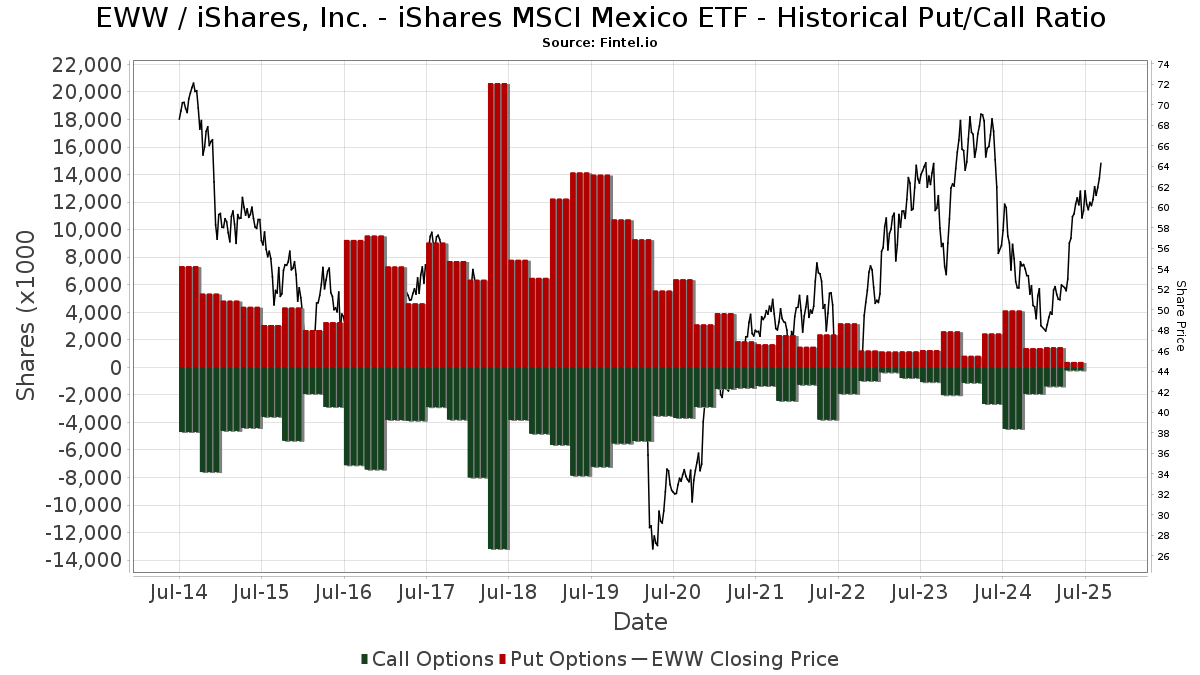
Rasio Put/Call Institusional
Selain melaporkan isu ekuitas dan utang standar, institusi dengan aset di bawah manajemen lebih dari 100 juta dolar AS juga harus mengungkapkan kepemilikan opsi put dan call mereka. Karena opsi put umumnya menunjukkan sentimen negatif, dan opsi call menunjukkan sentimen positif, kita dapat mengetahui sentimen institusional secara keseluruhan dengan memplot rasio put terhadap call. Grafik di sebelah kanan memplot rasio put/call historis untuk instrumen ini.
Menggunakan Rasio Put/Call sebagai indikator sentimen investor mengatasi salah satu kekurangan utama dari penggunaan total kepemilikan institusional, yaitu sejumlah besar aset yang dikelola diinvestasikan secara pasif untuk melacak indeks. Dana yang dikelola secara pasif biasanya tidak membeli opsi, sehingga indikator rasio put/call lebih akurat dalam melacak sentimen dana yang dikelola secara aktif.
Pengajuan 13F dan NPORT
Detail pada pengajuan 13F tersedia gratis. Detail pada pengajuan NP memerlukan keanggotaan premium. Baris berwarna hijau menunjukkan posisi baru. Baris berwarna merah menunjukkan posisi yang sudah ditutup. Klik tautan ini ikon untuk melihat riwayat transaksi selengkapnya.
Tingkatkan
untuk membuka data premium dan mengekspor ke Excel ![]() .
.
| Tanggal File | Sumber | Investor | Ketik | Presyo ng Avg (Silangan) |
Saham | Δ Saham (%) |
Dilaporkan Nilai ($1000) |
Nilai Δ (%) |
Alokasi Port (%) |
|
|---|---|---|---|---|---|---|---|---|---|---|
| 2025-08-12 | 13F | MAI Capital Management | 56 | 9.80 | 3 | 50.00 | ||||
| 2025-08-12 | 13F | Zacks Investment Management | 9,914 | -1.40 | 600 | 17.19 | ||||
| 2025-08-07 | 13F | David R. Rahn & Associates Inc. | 14,535 | 880 | ||||||
| 2025-08-14 | 13F | Millennium Management Llc | 0 | -100.00 | 0 | |||||
| 2025-08-13 | 13F | Custom Index Systems, Llc | 4,325 | 262 | ||||||
| 2025-08-14 | 13F | Private Wealth Advisors, LLC | 72,021 | 1.50 | 4,362 | 20.60 | ||||
| 2025-07-24 | 13F | Us Bancorp \de\ | 1,066 | 0.09 | 65 | 18.52 | ||||
| 2025-08-13 | 13F | Flow Traders U.s. Llc | 20,806 | 1 | ||||||
| 2025-08-14 | 13F | Raymond James Financial Inc | 75,435 | 16.66 | 4,568 | 38.63 | ||||
| 2025-04-23 | 13F | Bessemer Group Inc | 0 | -100.00 | 0 | |||||
| 2025-04-08 | 13F | Pacifica Partners Inc. | 0 | -100.00 | 0 | -100.00 | ||||
| 2025-07-10 | 13F | Wealth Enhancement Advisory Services, Llc | 11,391 | 51.64 | 703 | 83.77 | ||||
| 2025-07-23 | 13F | Viewpoint Capital Management LLC | 500 | 30 | ||||||
| 2025-07-29 | 13F | Tradewinds Capital Management, LLC | 14,406 | -20.75 | 872 | -5.83 | ||||
| 2025-08-11 | 13F | Trium Capital LLP | 133,373 | 8,077 | ||||||
| 2025-08-14 | 13F | Financial Advisory Service, Inc. | 810 | 0.00 | 49 | 19.51 | ||||
| 2025-08-14 | 13F | Graham Capital Management, L.P. | 0 | -100.00 | 0 | |||||
| 2025-08-14 | 13F/A | Barclays Plc | 76,135 | 5.81 | 5 | 33.33 | ||||
| 2025-08-13 | 13F | Northwestern Mutual Wealth Management Co | 24,069 | 7.90 | 1,458 | 28.26 | ||||
| 2025-08-14 | 13F | Old Mission Capital Llc | 0 | -100.00 | 0 | |||||
| 2025-07-23 | 13F | Spectrum Asset Management, Inc. (NB/CA) | 38,536 | 2,334 | ||||||
| 2025-08-14 | 13F | Hilltop Holdings Inc. | 7,968 | 483 | ||||||
| 2025-05-14 | 13F | Rockefeller Capital Management L.P. | 0 | -100.00 | 0 | |||||
| 2025-08-14 | 13F | Schonfeld Strategic Advisors LLC | 4,843 | 10.32 | 293 | 31.39 | ||||
| 2025-08-13 | 13F | VestGen Advisors, LLC | 3,348 | 203 | ||||||
| 2025-07-22 | NP | TIGGX - Goldman Sachs Tax-Advantaged Global Equity Portfolio Institutional | 79,716 | 0.00 | 4,797 | 19.10 | ||||
| 2025-07-10 | 13F | Exchange Traded Concepts, Llc | 1,048 | -56.15 | 63 | -47.93 | ||||
| 2025-07-25 | 13F | Northwest Capital Management Inc | 245 | 2.08 | 15 | 16.67 | ||||
| 2025-08-14 | 13F | Federation des caisses Desjardins du Quebec | 2,756 | -41.21 | 167 | -30.25 | ||||
| 2025-08-11 | 13F | One Capital Management, LLC | 26,892 | 1,629 | ||||||
| 2025-08-29 | NP | CGHIX - Timber Point Global Allocations Fund Institutional Class Shares | 6,000 | 100.00 | 363 | 138.82 | ||||
| 2025-08-14 | 13F | DZ BANK AG Deutsche Zentral Genossenschafts Bank, Frankfurt am Main | 3,242 | 196 | ||||||
| 2025-07-29 | 13F | Creekside Partners | 6,381 | 0.00 | 386 | 18.77 | ||||
| 2025-06-27 | NP | MEXX - Direxion Daily MSCI Mexico Bull 3X Shares | 226,517 | 24.17 | 12,905 | 44.44 | ||||
| 2025-08-14 | 13F | Manufacturers Life Insurance Company, The | 455,829 | 27,605 | ||||||
| 2025-08-01 | 13F | Twin Lakes Capital Management, LLC | 1,834 | 1.89 | 111 | 21.98 | ||||
| 2025-07-10 | 13F | Clare Market Investments LLC | 0 | -100.00 | 0 | |||||
| 2025-07-31 | 13F | Catalyst Capital Advisors LLC | 338,993 | -17.78 | 20,529 | -2.30 | ||||
| 2025-08-14 | 13F | GWM Advisors LLC | 138 | 8 | ||||||
| 2025-07-21 | 13F | Ping Capital Management, Inc. | 71,800 | 205.53 | 4,348 | 263.24 | ||||
| 2025-08-12 | 13F | Waterloo Capital, L.P. | 5,368 | 325 | ||||||
| 2025-08-12 | 13F | Picton Mahoney Asset Management | 38,659 | 49.21 | 2 | 100.00 | ||||
| 2025-08-14 | 13F | Royal Bank Of Canada | 482,209 | 12.62 | 29,203 | 33.84 | ||||
| 2025-08-07 | 13F | Zurcher Kantonalbank (Zurich Cantonalbank) | 7,350 | 0.44 | 444 | 17.20 | ||||
| 2025-08-12 | 13F | LPL Financial LLC | 879,175 | 2,995.58 | 53,243 | 3,579.47 | ||||
| 2025-08-13 | 13F | Provida Pension Fund Administrator | 0 | -100.00 | 0 | -100.00 | ||||
| 2025-08-11 | 13F | HighTower Advisors, LLC | 26,662 | 230.10 | 1,615 | 292.70 | ||||
| 2025-05-15 | 13F | Activest Wealth Management | 0 | -100.00 | 0 | -100.00 | ||||
| 2025-08-13 | 13F | Providence Capital Advisors, LLC | 11,988 | -8.88 | 726 | 8.36 | ||||
| 2025-08-07 | 13F | Guidance Capital, Inc | 6,672 | 8.45 | 398 | 13.43 | ||||
| 2025-08-13 | 13F | Raab & Moskowitz Asset Management LLC | 8,901 | -2.34 | 539 | 16.16 | ||||
| 2025-05-13 | 13F | FineMark National Bank & Trust | 0 | -100.00 | 0 | |||||
| 2025-04-10 | 13F | Bremer Bank National Association | 180,407 | 0.00 | 9,194 | 8.84 | ||||
| 2025-08-07 | 13F/A | Tortoise Investment Management, LLC | Put | 0 | -100.00 | 0 | -100.00 | |||
| 2025-08-13 | 13F | ExodusPoint Capital Management, LP | 0 | -100.00 | 0 | |||||
| 2025-08-11 | 13F | Aptus Capital Advisors, LLC | 10 | 0.00 | 1 | |||||
| 2025-08-11 | 13F | Hexagon Capital Partners LLC | 0 | -100.00 | 0 | |||||
| 2025-08-14 | 13F | Whitebox Advisors Llc | 31,750 | 1,923 | ||||||
| 2025-08-14 | 13F | D. E. Shaw & Co., Inc. | 109,183 | 6,612 | ||||||
| 2025-08-14 | 13F | Sycale Advisors (NY) LLC | 136,500 | 13.28 | 8,266 | 34.63 | ||||
| 2025-08-14 | 13F | Stifel Financial Corp | 64,710 | 1.33 | 3,919 | 20.41 | ||||
| 2025-08-04 | 13F | Carret Asset Management, Llc | 5,329 | 1.37 | 323 | 20.60 | ||||
| 2025-08-19 | NP | GIPIX - Goldman Sachs Balanced Strategy Portfolio Institutional | 2,526 | 0.00 | 153 | 18.75 | ||||
| 2025-08-08 | 13F | Banco Bilbao Vizcaya Argentaria, S.a. | 17,665 | 32.22 | 1,071 | 57.82 | ||||
| 2025-08-14 | 13F | Mpwm Advisory Solutions, Llc | 0 | -100.00 | 0 | |||||
| 2025-08-14 | 13F | Fmr Llc | 41,179 | -22.07 | 2,494 | -7.39 | ||||
| 2025-08-14 | 13F | Balyasny Asset Management Llc | 22,460 | -78.00 | 1,360 | -73.86 | ||||
| 2025-08-08 | 13F | Allianz Se | 2,232 | 0.00 | 135 | 19.47 | ||||
| 2025-07-24 | 13F | Blair William & Co/il | 1,673 | -33.00 | 101 | -20.47 | ||||
| 2025-08-14 | 13F | Ameriprise Financial Inc | 82,376 | 72.15 | 4,989 | 104.59 | ||||
| 2025-08-08 | 13F | SBI Securities Co., Ltd. | 46,433 | 301.50 | 2,812 | 377.25 | ||||
| 2025-07-28 | 13F | Harbour Investments, Inc. | 70 | 0.00 | 4 | 33.33 | ||||
| 2025-08-12 | 13F | Ci Investments Inc. | 0 | -100.00 | 0 | |||||
| 2025-08-14 | 13F | Aspen Grove Capital, LLC | 129,336 | 0.62 | 7,833 | 19.57 | ||||
| 2025-08-14 | 13F | Colony Group, LLC | 3,806 | 230 | ||||||
| 2025-07-16 | 13F | Banque Pictet & Cie Sa | 25,000 | 0.00 | 1,514 | 18.84 | ||||
| 2025-07-28 | 13F | Twin Tree Management, LP | 0 | -100.00 | 0 | |||||
| 2025-08-12 | 13F | O'shaughnessy Asset Management, Llc | 1,074 | 0.00 | 65 | 20.37 | ||||
| 2025-05-13 | 13F | Neuberger Berman Group LLC | 0 | -100.00 | 0 | -100.00 | ||||
| 2025-08-11 | 13F | SFI Advisors, LLC | 14,841 | -27.71 | 899 | -14.15 | ||||
| 2025-08-18 | 13F | Hollencrest Capital Management | 13,660 | 0.00 | 827 | 18.82 | ||||
| 2025-08-14 | 13F | DRW Securities, LLC | 40,114 | 89.22 | 2,434 | 125.37 | ||||
| 2025-08-01 | 13F | Y-Intercept (Hong Kong) Ltd | 3,382 | 205 | ||||||
| 2025-08-14 | 13F | Discovery Capital Management, Llc / Ct | 29,050 | 1,759 | ||||||
| 2025-08-12 | 13F | Stevens Capital Management Lp | 5,772 | 0 | ||||||
| 2025-08-04 | 13F | Spire Wealth Management | 9,488 | 9.79 | 575 | 30.45 | ||||
| 2025-07-21 | 13F | Mirae Asset Global Investments Co., Ltd. | 3,100 | -26.19 | 188 | -13.43 | ||||
| 2025-07-25 | 13F | Apollon Wealth Management, LLC | 7,559 | 458 | ||||||
| 2025-07-28 | 13F | BRYN MAWR TRUST Co | 3,208 | -22.53 | 194 | -8.06 | ||||
| 2025-08-05 | 13F | Mma Asset Management Llc | 25,416 | 1,539 | ||||||
| 2025-08-13 | 13F | Lido Advisors, LLC | 7,202 | 436 | ||||||
| 2025-08-14 | 13F | Wetherby Asset Management Inc | 5,860 | 0.00 | 355 | 29.20 | ||||
| 2025-07-28 | 13F | Credit Industriel Et Commercial | 0 | -100.00 | 0 | |||||
| 2025-08-06 | 13F | Pekin Hardy Strauss, Inc. | 78,586 | 51.00 | 4,759 | 79.45 | ||||
| 2025-07-28 | 13F | Credit Industriel Et Commercial | Put | 0 | -100.00 | 0 | ||||
| 2025-08-12 | 13F | XTX Topco Ltd | 0 | -100.00 | 0 | |||||
| 2025-07-08 | 13F | Nbc Securities, Inc. | 218 | 0 | ||||||
| 2025-08-08 | 13F | SG Americas Securities, LLC | 286,750 | 929.70 | 17 | 1,600.00 | ||||
| 2025-08-08 | 13F | Cetera Investment Advisers | 27,202 | 1,647 | ||||||
| 2025-08-14 | 13F | Smartleaf Asset Management LLC | 120 | 25.00 | 7 | 75.00 | ||||
| 2025-08-14 | 13F | Susquehanna International Group, Llp | 288,775 | 88.58 | 17,488 | 124.12 | ||||
| 2025-08-13 | 13F | Sun Life Financial Inc | 18,825 | 36.66 | 1 | |||||
| 2025-08-14 | 13F | Schonfeld Strategic Advisors LLC | Call | 0 | -100.00 | 0 | -100.00 | |||
| 2025-05-14 | 13F | Van Hulzen Asset Management, LLC | 0 | -100.00 | 0 | |||||
| 2025-08-14 | 13F | Susquehanna International Group, Llp | Call | 43,600 | -2.68 | 2,640 | 15.64 | |||
| 2025-08-14 | 13F | Susquehanna International Group, Llp | Put | 172,500 | 53.06 | 10,447 | 81.89 | |||
| 2025-07-29 | 13F | Millburn Ridgefield Corp | 338,993 | -17.78 | 20,529 | -2.30 | ||||
| 2025-08-13 | 13F | Baker Avenue Asset Management, LP | 352,648 | 10.29 | 21,356 | 31.07 | ||||
| 2025-07-31 | 13F | Wealthfront Advisers Llc | 9,956 | -3.58 | 603 | 14.45 | ||||
| 2025-08-12 | 13F | Atlas Capital Advisors Llc | 914 | -0.33 | 55 | 19.57 | ||||
| 2025-08-15 | 13F | Equitable Holdings, Inc. | 13,990 | -14.32 | 847 | 1.80 | ||||
| 2025-08-15 | 13F | Kestra Advisory Services, LLC | 3,676 | 223 | ||||||
| 2025-05-15 | 13F | Bank Of America Corp /de/ | Put | 0 | -100.00 | 0 | -100.00 | |||
| 2025-08-27 | 13F/A | Brinker Capital Investments, LLC | 4,217 | 6.14 | 255 | 26.24 | ||||
| 2025-05-15 | 13F | Black Maple Capital Management LP | 0 | -100.00 | 0 | |||||
| 2025-08-13 | 13F | Bank Of Nova Scotia | 14,363 | 26.70 | 870 | 50.61 | ||||
| 2025-08-12 | 13F | Clear Street Markets Llc | 5,000 | 303 | ||||||
| 2025-08-14 | 13F | Bnp Paribas Arbitrage, Sa | 70,941 | -72.99 | 4,296 | -67.90 | ||||
| 2025-08-19 | 13F | Advisory Services Network, LLC | 4,611 | -2.78 | 277 | 14.94 | ||||
| 2025-07-29 | NP | BLUIX - BLUEPRINT GROWTH FUND Institutional Class | 13,069 | 58.07 | 786 | 88.49 | ||||
| 2025-07-29 | 13F | JTC Employer Solutions Trusteee Ltd | 275 | 0.00 | 0 | |||||
| 2025-08-14 | 13F | Tudor Investment Corp Et Al | 13,172 | 798 | ||||||
| 2025-08-14 | 13F | Bank Of America Corp /de/ | Call | 0 | -100.00 | 0 | -100.00 | |||
| 2025-08-13 | 13F | Bridgewater Associates, LP | 112,044 | 57.55 | 6,785 | 87.22 | ||||
| 2025-04-23 | 13F | Golden State Wealth Management, LLC | 0 | -100.00 | 0 | |||||
| 2025-08-19 | NP | GOIIX - Goldman Sachs Growth and Income Strategy Portfolio Institutional | 3,887 | 0.00 | 235 | 18.69 | ||||
| 2025-08-12 | 13F | Jpmorgan Chase & Co | 1,136,385 | -2.49 | 68,820 | 15.88 | ||||
| 2025-08-14 | 13F | Citadel Advisors Llc | 34,480 | 4,735.90 | 2,088 | 5,700.00 | ||||
| 2025-07-21 | NP | TTIFX - Goldman Sachs Tactical Tilt Overlay Fund Institutional Shares | 864,052 | 0.00 | 51,990 | 19.10 | ||||
| 2025-08-28 | 13F/A | Lavaca Capital Llc | 811 | -12.70 | 49 | 4.26 | ||||
| 2025-08-13 | 13F | Edgestream Partners, L.P. | 3,407 | 206 | ||||||
| 2025-08-08 | 13F | Pnc Financial Services Group, Inc. | 900 | 0.00 | 55 | 20.00 | ||||
| 2025-08-29 | NP | MBXAX - Catalyst/Millburn Hedge Strategy Fund Class A | 338,993 | -17.78 | 20,529 | -2.30 | ||||
| 2025-03-25 | 13F | Arrow Investment Advisors, LLC | 0 | -100.00 | 0 | |||||
| 2025-07-29 | 13F | Private Trust Co Na | 741 | 45 | ||||||
| 2025-08-27 | 13F/A | Squarepoint Ops LLC | Call | 3,700 | 224 | |||||
| 2025-08-06 | 13F | Innealta Capital, Llc | 20,581 | 1,246 | ||||||
| 2025-05-15 | 13F | State Of Wisconsin Investment Board | 0 | -100.00 | 0 | |||||
| 2025-08-14 | 13F | Comerica Bank | 9,512 | 42.46 | 576 | 69.41 | ||||
| 2025-08-29 | 13F | Centaurus Financial, Inc. | 2,348 | 0.00 | 0 | |||||
| 2025-08-12 | 13F | CIBC Private Wealth Group, LLC | 1,393 | 1.60 | 84 | 29.23 | ||||
| 2025-08-18 | 13F | Hollencrest Capital Management | Call | 0 | -100.00 | 0 | -100.00 | |||
| 2025-08-11 | 13F | HighTower Advisors, LLC | Call | 0 | -100.00 | 0 | ||||
| 2025-08-11 | 13F | Citigroup Inc | 202,931 | -9.99 | 12,289 | 6.96 | ||||
| 2025-08-11 | 13F | Principal Securities, Inc. | 200 | -88.40 | 12 | -85.00 | ||||
| 2025-08-05 | 13F | Gould Asset Management Llc /ca/ | 7,610 | 1.81 | 461 | 21.05 | ||||
| 2025-08-13 | 13F | Amundi | 211,886 | -20.25 | 13,050 | -9.48 | ||||
| 2025-08-14 | 13F | Two Sigma Securities, Llc | 11,610 | 703 | ||||||
| 2025-08-11 | 13F | HighTower Advisors, LLC | Put | 0 | -100.00 | 0 | ||||
| 2025-08-15 | 13F | Captrust Financial Advisors | 4,104 | 3.77 | 249 | 23.38 | ||||
| 2025-08-14 | 13F | Sona Asset Management (us) Llc | 40,000 | 2,422 | ||||||
| 2025-08-14 | 13F | Arizona PSPRS Trust | 0 | -100.00 | 0 | |||||
| 2025-08-28 | NP | DMCY - DEMOCRACY INTERNATIONAL FUND Shares | 455 | 0.00 | 28 | 17.39 | ||||
| 2025-07-22 | 13F | Global Assets Advisory, LLC | 14,652 | -54.35 | 896 | -44.96 | ||||
| 2025-07-28 | 13F | Mowery & Schoenfeld Wealth Management, LLC | 66 | 0.00 | 4 | 0.00 | ||||
| 2025-08-11 | 13F | Strategic Wealth Partners, Ltd. | 1,728 | 105 | ||||||
| 2025-08-14 | 13F | Bank Of America Corp /de/ | 182,515 | -61.00 | 11,053 | -53.65 | ||||
| 2025-07-23 | 13F | Columbus Macro, LLC | 19,960 | 1,209 | ||||||
| 2025-08-11 | 13F | Kazazian Asset Management, LLC | 0 | -100.00 | 0 | |||||
| 2025-07-14 | 13F | Cobblestone Asset Management LLC | 10,057 | 609 | ||||||
| 2025-08-26 | NP | EQ ADVISORS TRUST - EQ/International Core Managed Volatility Portfolio Class IB | 4,548 | -37.25 | 275 | -25.47 | ||||
| 2025-08-14 | 13F | Wellington Management Group Llp | 50,287 | -7.03 | 3,045 | 10.49 | ||||
| 2025-08-19 | 13F | Anchor Investment Management, LLC | 447 | 0.00 | 27 | 22.73 | ||||
| 2025-08-08 | 13F | Cercano Management LLC | 239,617 | 14,511 | ||||||
| 2025-08-28 | NP | Northern Lights Fund Trust - Ocean Park International ETF | 1,048 | -56.15 | 63 | -47.93 | ||||
| 2025-08-06 | 13F | AE Wealth Management LLC | 23 | 0.00 | 1 | 0.00 | ||||
| 2025-08-27 | NP | XNAV - FundX Aggressive ETF | 17,050 | 1,033 | ||||||
| 2025-08-08 | 13F | NAN FUNG TRINITY (HK) Ltd | 406,200 | -38.93 | 24,599 | -27.42 | ||||
| 2025-08-13 | 13F | Scotia Capital Inc. | 3,658 | 222 | ||||||
| 2025-08-14 | 13F | UBS Group AG | Call | 0 | -100.00 | 0 | -100.00 | |||
| 2025-08-13 | 13F | Loomis Sayles & Co L P | 89,600 | 5,426 | ||||||
| 2025-05-15 | 13F | BLKBRD Asset Management, LP | 0 | -100.00 | 0 | |||||
| 2025-07-24 | 13F | Summit Place Financial Advisors, LLC | 17,920 | 6.38 | 1,085 | 26.46 | ||||
| 2025-08-13 | 13F | Korea Investment CORP | 388,217 | 0.00 | 23,510 | 18.84 | ||||
| 2025-08-14 | 13F | Quantitative Investment Management, LLC | 14,339 | 1 | ||||||
| 2025-08-13 | 13F | Kayne Anderson Rudnick Investment Management Llc | 1,110 | 0.00 | 67 | 19.64 | ||||
| 2025-05-14 | 13F | Compass Rose Asset Management, LP | 0 | -100.00 | 0 | |||||
| 2025-08-11 | 13F | TD Waterhouse Canada Inc. | 0 | -100.00 | 0 | |||||
| 2025-07-22 | NP | GIDGX - Goldman Sachs Enhanced Dividend Global Equity Portfolio Institutional | 8,246 | 0.00 | 496 | 19.23 | ||||
| 2025-04-15 | 13F | Oak Family Advisors, Llc | 0 | -100.00 | 0 | |||||
| 2025-05-12 | 13F | Providence First Trust Co | 0 | -100.00 | 0 | |||||
| 2025-08-07 | 13F | CENTRAL TRUST Co | 970 | 0.00 | 59 | 18.37 | ||||
| 2025-08-14 | 13F | Verition Fund Management LLC | 0 | -100.00 | 0 | |||||
| 2025-07-14 | 13F | Painted Porch Advisors LLC | 44 | 0.00 | 3 | 0.00 | ||||
| 2025-08-08 | 13F | M&G Plc | 2,257,723 | -51.19 | 136,728 | -41.99 | ||||
| 2025-08-14 | 13F | Rokos Capital Management LLP | 10,590 | 0.00 | 641 | 18.92 | ||||
| 2025-07-31 | 13F | Glass Jacobson Investment Advisors llc | 0 | -100.00 | 0 | |||||
| 2025-08-01 | 13F | Envestnet Asset Management Inc | 23,693 | 96.90 | 1,435 | 133.93 | ||||
| 2025-08-13 | 13F | Lumbard & Kellner, LLC | 9,326 | 565 | ||||||
| 2025-08-06 | 13F | Texas Yale Capital Corp. | 6,275 | -6.48 | 380 | 11.44 | ||||
| 2025-08-11 | 13F | Banque Cantonale Vaudoise | 1,832 | -2.14 | 0 | |||||
| 2025-08-12 | 13F | Global Retirement Partners, LLC | 2,113 | 23,377.78 | 128 | |||||
| 2025-08-19 | 13F | Element Pointe Advisors, Llc | 10,740 | 0.00 | 650 | 18.83 | ||||
| 2025-07-08 | 13F | Lowe Wealth Advisors, LLC | 529 | 3.93 | 32 | 28.00 | ||||
| 2025-08-15 | 13F | Tower Research Capital LLC (TRC) | 1,203 | 73 | ||||||
| 2025-05-15 | 13F/A | Orion Portfolio Solutions, LLC | 3,973 | 202 | ||||||
| 2025-08-13 | 13F | Mount Yale Investment Advisors, LLC | 43 | 3 | ||||||
| 2025-08-14 | 13F | Michelson Medical Research Foundation, Inc. | 41,850 | 0.00 | 2,534 | 18.86 | ||||
| 2025-08-13 | 13F | Berbice Capital Management LLC | 0 | -100.00 | 0 | |||||
| 2025-08-13 | 13F | Cresset Asset Management, LLC | 9,597 | 27.21 | 581 | 51.30 | ||||
| 2025-05-15 | 13F | Marshall Wace, Llp | Call | 0 | -100.00 | 0 | -100.00 | |||
| 2025-08-27 | 13F/A | Squarepoint Ops LLC | Put | 0 | -100.00 | 0 | ||||
| 2025-08-18 | 13F | Ashford Capital Management Inc | 55,988 | -30.25 | 3,391 | -17.11 | ||||
| 2025-08-27 | 13F/A | Squarepoint Ops LLC | 0 | -100.00 | 0 | |||||
| 2025-08-14 | 13F | Rafferty Asset Management, LLC | 126,361 | -33.49 | 7,652 | -20.96 | ||||
| 2025-05-15 | 13F | Twin Tree Management, LP | Put | 0 | -100.00 | 0 | -100.00 | |||
| 2025-08-14 | 13F | Daiwa Securities Group Inc. | 300 | 0.00 | 0 | |||||
| 2025-08-14 | 13F | DRW Securities, LLC | Call | 0 | -100.00 | 0 | -100.00 | |||
| 2025-07-15 | 13F | Fifth Third Bancorp | 0 | -100.00 | 0 | |||||
| 2025-05-15 | 13F | Eschler Asset Management LLP | 0 | -100.00 | 0 | |||||
| 2025-07-28 | 13F | Kiker Wealth Management, LLC | 374 | 0.00 | 23 | 15.79 | ||||
| 2025-08-13 | 13F | Hsbc Holdings Plc | 1,236,281 | 74,869 | ||||||
| 2025-08-14 | 13F | Goldman Sachs Group Inc | Call | 0 | -100.00 | 0 | -100.00 | |||
| 2025-05-13 | 13F | Thrivent Financial For Lutherans | 0 | -100.00 | 0 | |||||
| 2025-08-14 | 13F | Headlands Technologies LLC | 15,073 | 15,280.61 | 913 | 22,700.00 | ||||
| 2025-08-12 | 13F | BlackRock, Inc. | 1,828 | 5.42 | 111 | 25.00 | ||||
| 2025-08-08 | 13F | Itau Unibanco Holding S.A. | 19,210 | 979 | ||||||
| 2025-08-14 | 13F | Prelude Capital Management, Llc | 12,000 | -0.36 | 727 | 18.43 | ||||
| 2025-08-15 | 13F | Morgan Stanley | 1,615,442 | -56.88 | 97,831 | -48.76 | ||||
| 2025-08-14 | 13F | Citadel Advisors Llc | Call | 82,100 | -79.24 | 4,972 | -75.33 | |||
| 2025-08-14 | 13F | Sargent Investment Group, LLC | 4,435 | -8.08 | 269 | 9.80 | ||||
| 2025-03-13 | 13F | PKO Investment Management Joint-Stock Co | 0 | -100.00 | 0 | -100.00 | ||||
| 2025-08-12 | 13F | Journey Strategic Wealth Llc | 4,700 | 285 | ||||||
| 2025-05-09 | 13F | Delta Asset Management Llc/tn | 0 | -100.00 | 0 | |||||
| 2025-07-18 | 13F | Truist Financial Corp | 12,962 | 34.77 | 785 | 60.00 | ||||
| 2025-08-14 | 13F | Optiver Holding B.V. | 1,136 | 0.00 | 69 | 19.30 | ||||
| 2025-08-14 | 13F | Verition Fund Management LLC | Put | 0 | -100.00 | 0 | ||||
| 2025-07-11 | 13F | Farther Finance Advisors, LLC | 126 | 1.61 | 8 | 16.67 | ||||
| 2025-04-14 | 13F | IMC-Chicago, LLC | 0 | -100.00 | 0 | |||||
| 2025-07-28 | 13F | Axxcess Wealth Management, Llc | 0 | -100.00 | 0 | |||||
| 2025-07-18 | 13F | Institute for Wealth Management, LLC. | 5,323 | 0.00 | 322 | 18.82 | ||||
| 2025-07-24 | 13F | Eastern Bank | 0 | -100.00 | 0 | |||||
| 2025-08-13 | 13F | First Trust Advisors Lp | 26,970 | -4.40 | 1,633 | 13.64 | ||||
| 2025-08-14 | 13F | Citadel Advisors Llc | Put | 126,000 | -60.83 | 7,631 | -53.46 | |||
| 2025-08-19 | NP | GGSIX - Goldman Sachs Growth Strategy Portfolio Institutional | 2,712 | 0.00 | 164 | 18.84 | ||||
| 2025-07-11 | 13F | Caldwell Securities, Inc | 35 | 0.00 | 2 | 100.00 | ||||
| 2025-05-15 | 13F | Wiley Bros.-aintree Capital, Llc | 0 | -100.00 | 0 | |||||
| 2025-05-13 | 13F | Quadrature Capital Ltd | 0 | -100.00 | 0 | |||||
| 2025-07-25 | 13F | We Are One Seven, LLC | 5,329 | 2.13 | 323 | 21.51 | ||||
| 2025-08-11 | 13F | Private Advisor Group, LLC | 4,067 | 246 | ||||||
| 2025-08-13 | 13F | Centiva Capital, LP | 3,882 | 235 | ||||||
| 2025-08-08 | 13F | Capital Investment Advisory Services, LLC | 100 | -90.28 | 6 | -88.46 | ||||
| 2025-08-11 | 13F | Absolute Gestao de Investimentos Ltda. | 22,000 | 1,332 | ||||||
| 2025-08-13 | 13F | PACK Private Wealth, LLC | 4,394 | 10.46 | 266 | 31.68 | ||||
| 2025-08-19 | 13F | National Asset Management, Inc. | 20,555 | 1,245 | ||||||
| 2025-08-04 | 13F | Whalen Wealth Management Inc. | 4,534 | 275 | ||||||
| 2025-06-26 | NP | BlackRock ETF Trust - iShares International Country Rotation Active ETF | 944 | 43.90 | 54 | 65.63 | ||||
| 2025-08-28 | NP | ICCIX - Dynamic International Opportunity Fund Class I | 20,581 | -43.29 | 1,246 | -39.34 | ||||
| 2025-08-12 | 13F | Richard W. Paul & Associates, LLC | 6,217 | 376 | ||||||
| 2025-08-14 | 13F | Two Sigma Investments, Lp | 44,400 | 2,689 | ||||||
| 2025-08-04 | 13F | IFG Advisory, LLC | 16,255 | 984 | ||||||
| 2025-08-14 | 13F | Wells Fargo & Company/mn | Put | 10,000 | 606 | |||||
| 2025-05-20 | 13F | Belpointe Asset Management LLC | 0 | -100.00 | 0 | |||||
| 2025-08-06 | 13F | Commonwealth Equity Services, Llc | 5,769 | 12.24 | 0 | |||||
| 2025-08-28 | NP | SYMIX - AlphaCentric Symmetry Strategy Fund Class I | 2,138 | 12.70 | 129 | -1.53 | ||||
| 2025-08-08 | 13F | Creative Planning | 3,360 | 203 | ||||||
| 2025-08-14 | 13F | Group One Trading, L.p. | 0 | -100.00 | 0 | |||||
| 2025-08-14 | 13F | Wells Fargo & Company/mn | 318,414 | 293.88 | 19,283 | 368.15 | ||||
| 2025-07-11 | 13F/A | Financiere des Professionnels - Fonds d,investissement inc. | 35,000 | 2,120 | ||||||
| 2025-08-06 | 13F | Nvwm, Llc | 20,571 | 132.70 | 1,246 | 176.67 | ||||
| 2025-08-13 | 13F | Capital Fund Management S.a. | 149,643 | 20.89 | 9,062 | 43.68 | ||||
| 2025-07-16 | 13F | Highline Wealth Partners Llc | 0 | -100.00 | 0 | |||||
| 2025-08-14 | 13F | Glen Eagle Advisors, LLC | 539 | 0.00 | 33 | 18.52 | ||||
| 2025-07-31 | 13F | Nisa Investment Advisors, Llc | 500 | 0.00 | 30 | 20.00 | ||||
| 2025-07-22 | 13F | 4Thought Financial Group Inc. | 233 | 2.19 | 14 | 27.27 | ||||
| 2025-08-14 | 13F | Point72 Asset Management, L.P. | Call | 0 | -100.00 | 0 | ||||
| 2025-08-14 | 13F | Hrt Financial Lp | 4,477 | 0 | ||||||
| 2025-08-12 | 13F | Steward Partners Investment Advisory, Llc | 3,416 | 11.09 | 207 | 32.05 | ||||
| 2025-08-13 | 13F | Capital Fund Management S.a. | Call | 36,300 | -67.68 | 2,198 | -61.59 | |||
| 2025-08-18 | 13F | Geneos Wealth Management Inc. | 34,321 | 234.94 | 2,078 | 298.08 | ||||
| 2025-08-13 | 13F | Capital Fund Management S.a. | Put | 25,000 | -68.31 | 1,514 | -62.34 | |||
| 2025-08-13 | 13F | Walleye Trading LLC | Call | 0 | -100.00 | 0 | -100.00 | |||
| 2025-08-14 | 13F | Mml Investors Services, Llc | 12,225 | 27.37 | 1 | |||||
| 2025-05-05 | 13F | IFP Advisors, Inc | 0 | -100.00 | 0 | |||||
| 2025-08-11 | 13F | Covestor Ltd | 3 | 0.00 | 0 | |||||
| 2025-08-11 | 13F | Mount Lucas Management LP | 14,639 | 887 | ||||||
| 2025-07-17 | 13F | Venture Visionary Partners LLC | 16,169 | -0.22 | 979 | 18.67 | ||||
| 2025-08-01 | 13F | Solstein Capital, LLC | 1,916 | -59.05 | 116 | -51.26 | ||||
| 2025-08-14 | 13F | LMR Partners LLP | 0 | -100.00 | 0 | |||||
| 2025-08-01 | 13F | Banco Santander, S.A. | 18,098 | -64.06 | 1,096 | -57.27 | ||||
| 2025-07-11 | 13F | Seacrest Wealth Management, Llc | 28,331 | 1,716 | ||||||
| 2025-08-14 | 13F | Evergreen Capital Management Llc | 49,320 | -16.53 | 2,987 | -0.83 | ||||
| 2025-07-25 | 13F | NorthRock Partners, LLC | 0 | -100.00 | 0 | |||||
| 2025-08-14 | 13F | SIH Partners, LLLP | 6,401 | -92.15 | 388 | -90.68 | ||||
| 2025-08-13 | 13F | Advisor Group Holdings, Inc. | 9,719 | -1.94 | 458 | -9.86 | ||||
| 2025-08-14 | 13F | Toronto Dominion Bank | 6 | 0.00 | 0 | |||||
| 2025-08-14 | 13F | Riggs Asset Managment Co. Inc. | 54,690 | 3,312 | ||||||
| 2025-08-18 | 13F/A | National Bank Of Canada /fi/ | 14,061 | -3.79 | 852 | 14.23 | ||||
| 2025-07-23 | 13F | Vontobel Holding Ltd. | 0 | -100.00 | 0 | |||||
| 2025-08-07 | 13F | Winch Advisory Services, LLC | 169 | 1.81 | 10 | 25.00 | ||||
| 2025-08-12 | 13F | AlphaCore Capital LLC | 100 | 6 | ||||||
| 2025-07-30 | 13F | Avidian Wealth Solutions, LLC | 111,232 | -0.30 | 6,736 | 18.49 | ||||
| 2025-08-05 | 13F | Bank Of Montreal /can/ | 1,504 | 91 | ||||||
| 2025-08-07 | 13F | Sollinda Capital Management LLC | 0 | -100.00 | 0 | -100.00 | ||||
| 2025-08-14 | 13F | Jane Street Group, Llc | 553,090 | 43.25 | 33,495 | 70.24 | ||||
| 2025-06-27 | 13F/A | Goldman Sachs Group Inc | Put | 0 | -100.00 | 0 | -100.00 | |||
| 2025-08-14 | 13F | UBS Group AG | 1,813,780 | 65.85 | 109,843 | 97.09 | ||||
| 2025-08-13 | 13F | JT Stratford LLC | 0 | -100.00 | 0 | |||||
| 2025-08-06 | 13F | North Capital, Inc. | 500 | 30 | ||||||
| 2025-07-31 | 13F | Cambridge Investment Research Advisors, Inc. | 7,222 | 40.23 | 0 | |||||
| 2025-08-14 | 13F | Cinctive Capital Management LP | 0 | -100.00 | 0 | |||||
| 2025-08-05 | 13F | Simplex Trading, Llc | 0 | -100.00 | 0 | |||||
| 2025-08-14 | 13F | Boothbay Fund Management, Llc | 7,688 | 466 | ||||||
| 2025-08-18 | 13F | Wolverine Trading, Llc | 9,928 | -79.03 | 599 | -75.52 | ||||
| 2025-08-12 | 13F | Proequities, Inc. | 0 | 0 | ||||||
| 2025-08-14 | 13F | Point72 Asset Management, L.P. | 0 | -100.00 | 0 | |||||
| 2025-08-18 | 13F | Wolverine Trading, Llc | Call | 21,400 | 32.92 | 1,291 | 55.23 | |||
| 2025-07-30 | 13F | Crewe Advisors LLC | 200 | 0.00 | 12 | 20.00 | ||||
| 2025-08-18 | 13F | Wolverine Trading, Llc | Put | 41,600 | -62.18 | 2,509 | -55.81 | |||
| 2025-07-14 | 13F | AdvisorNet Financial, Inc | 11 | 0.00 | 1 | |||||
| 2025-07-29 | NP | HFND - Unlimited HFND Multi-Strategy Return Tracker ETF | 238 | 244.93 | 14 | 250.00 | ||||
| 2025-06-17 | 13F | Ridgepath Capital Management LLC | 26,974 | 1,375 | ||||||
| 2025-08-14 | 13F | Atom Investors LP | 0 | -100.00 | 0 | |||||
| 2025-08-14 | 13F | Massar Capital Management, LP | 0 | -100.00 | 0 | |||||
| 2025-08-13 | 13F | Walleye Trading LLC | 9,735 | 590 | ||||||
| 2025-08-13 | 13F | Walleye Trading LLC | Put | 13,900 | 172.55 | 842 | 224.71 | |||
| 2025-08-13 | 13F | Renaissance Technologies Llc | 8,598 | 521 | ||||||
| 2025-04-22 | 13F | Synergy Financial Management, LLC | 0 | -100.00 | 0 | |||||
| 2025-07-31 | 13F | Sumitomo Mitsui Trust Holdings, Inc. | 4,785 | 290 | ||||||
| 2025-08-14 | 13F | Jane Street Group, Llc | Call | 18,300 | -74.08 | 1,108 | -69.20 | |||
| 2025-08-05 | 13F | Access Investment Management LLC | 35 | 2 | ||||||
| 2025-08-14 | 13F | Jane Street Group, Llc | Put | 3,700 | -45.59 | 224 | -35.26 | |||
| 2025-05-15 | 13F | Crestline Management, LP | 0 | -100.00 | 0 | |||||
| 2025-07-10 | 13F | CWC Advisors, LLC. | 9,192 | 3.95 | 557 | 23.56 | ||||
| 2025-08-14 | 13F | Goldman Sachs Group Inc | 1,838,100 | 19.97 | 111,315 | 42.57 | ||||
| 2025-07-24 | 13F | Rice Partnership, LLC | 0 | -100.00 | 0 | |||||
| 2025-08-14 | 13F | Integrated Wealth Concepts LLC | 42,683 | 2,585 | ||||||
| 2025-03-31 | NP | SSXU - Day Hagan/Ned Davis Research Smart Sector International ETF | 43,633 | 257.00 | 2,137 | 167.13 | ||||
| 2025-05-28 | NP | GHTA - Goose Hollow Tactical Allocation ETF | 32,811 | 66.65 | 1,672 | 81.54 | ||||
| 2025-08-14 | 13F | CIBC World Markets Inc. | 10,067 | 610 | ||||||
| 2025-07-25 | 13F | Cwm, Llc | 245 | -43.02 | 0 |