Mga Batayang Estadistika
| Pemilik Institusional | 659 total, 629 long only, 0 short only, 30 long/short - change of 1.85% MRQ |
| Alokasi Portofolio Rata-rata | 0.3444 % - change of -17.70% MRQ |
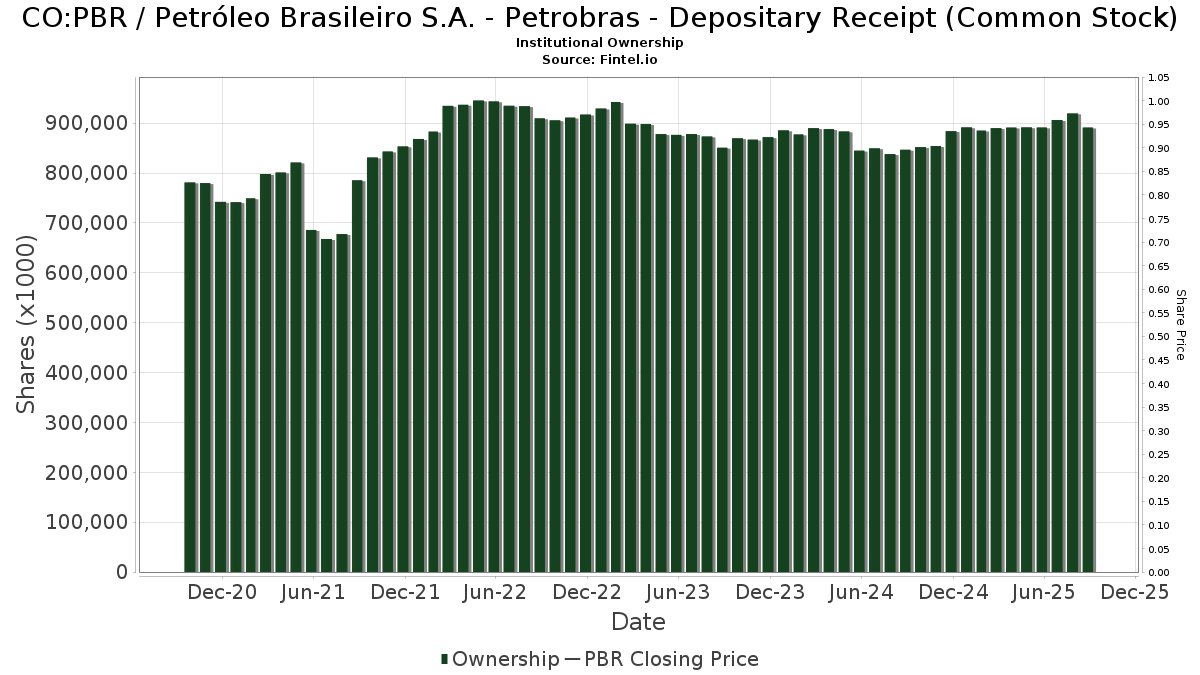
| Saham Institusional (Jangka Panjang) | 891,131,784 (ex 13D/G) - change of -1.35MM shares -0.15% MRQ |
| Nilai Institusional (Jangka Panjang) | $ 10,425,071 USD ($1000) |
Kepemilikan Institusional dan Pemegang Saham
Petróleo Brasileiro S.A. - Petrobras - Depositary Receipt (Common Stock) (CO:PBR) memiliki 659 pemilik institusional dan pemegang saham yang telah mengajukan formulir 13D/G atau 13F kepada Komisi Bursa Efek (Securities Exchange Commission/SEC). Lembaga-lembaga ini memegang total 891,131,784 saham. Pemegang saham terbesar meliputi GQG Partners LLC, GSIHX - Goldman Sachs GQG Partners International Opportunities Fund Class A Shares, GQGPX - GQG PARTNERS EMERGING MARKETS EQUITY FUND Investor Shares, Baillie Gifford & Co, Fmr Llc, Schroder Investment Management Group, Lazard Asset Management Llc, Capital International Investors, Fisher Asset Management, LLC, and Massachusetts Financial Services Co /ma/ .
Struktur kepemilikan institusional Petróleo Brasileiro S.A. - Petrobras - Depositary Receipt (Common Stock) (BVC:PBR) menunjukkan posisi terkini di perusahaan oleh institusi dan dana, serta perubahan terbaru dalam ukuran posisi. Pemegang saham utama dapat mencakup investor individu, reksa dana, dana lindung nilai, atau institusi. Jadwal 13D menunjukkan bahwa investor memegang (atau pernah memegang) lebih dari 5% saham perusahaan dan bermaksud (atau pernah bermaksud) untuk secara aktif mengejar perubahan strategi bisnis. Jadwal 13G menunjukkan investasi pasif lebih dari 5%.
Skor Sentimen Dana
Skor Sentimen Dana (sebelumnya dikenal sebagai Skor Akumulasi Kepemilikan) menemukan saham-saham yang paling banyak dibeli oleh dana. Ini adalah hasil dari model kuantitatif multi-faktor yang canggih yang mengidentifikasi perusahaan dengan tingkat akumulasi institusional tertinggi. Model penilaian menggunakan kombinasi dari total peningkatan pemilik yang diungkapkan, perubahan dalam alokasi portofolio pada pemilik tersebut, dan metrik lainnya. Angka berkisar dari 0 hingga 100, dengan angka yang lebih tinggi menunjukkan tingkat akumulasi yang lebih tinggi dibandingkan dengan perusahaan sejenisnya, dan 50 adalah rata-ratanya.
Frekuensi Pembaruan: Setiap Hari
Lihat Ownership Explorer, yang menyediakan daftar perusahaan dengan peringkat tertinggi.
Pengajuan 13F dan NPORT
Detail pada pengajuan 13F tersedia gratis. Detail pada pengajuan NP memerlukan keanggotaan premium. Baris berwarna hijau menunjukkan posisi baru. Baris berwarna merah menunjukkan posisi yang sudah ditutup. Klik tautan ini ikon untuk melihat riwayat transaksi selengkapnya.
Tingkatkan
untuk membuka data premium dan mengekspor ke Excel ![]() .
.
| Tanggal File | Sumber | Investor | Ketik | Presyo ng Avg (Silangan) |
Saham | Δ Saham (%) |
Dilaporkan Nilai ($1000) |
Nilai Δ (%) |
Alokasi Port (%) |
|
|---|---|---|---|---|---|---|---|---|---|---|
| 2025-07-09 | 13F | Krilogy Financial LLC | 19,815 | 8.78 | 248 | -5.36 | ||||
| 2025-08-29 | NP | Gabelli Global Utility & Income Trust | 10,000 | 0.00 | 125 | -12.59 | ||||
| 2025-08-21 | NP | LAZARD RETIREMENT SERIES INC - Lazard Retirement Emerging Markets Equity Portfolio Service Shares | 318,438 | -18.17 | 3,984 | -28.62 | ||||
| 2025-08-18 | 13F/A | Nomura Holdings Inc | Put | 95,000 | 0.00 | 1,188 | -12.78 | |||
| 2025-08-18 | 13F/A | Nomura Holdings Inc | 69,680 | 29.21 | 872 | 12.68 | ||||
| 2025-05-15 | 13F | Altshuler Shaham Ltd | 0 | -100.00 | 0 | |||||
| 2025-07-15 | 13F | Drum Hill Capital, LLC | 132,048 | -1.09 | 1,652 | -13.74 | ||||
| 2025-07-17 | 13F | Park Place Capital Corp | 884 | 0.00 | 11 | -8.33 | ||||
| 2025-08-04 | 13F | Assetmark, Inc | 1,033,002 | 2.43 | 12,923 | -10.64 | ||||
| 2025-06-26 | NP | DEHP - Dimensional Emerging Markets High Profitability ETF | 8,060 | 53.23 | 91 | 21.62 | ||||
| 2025-05-15 | 13F | Balyasny Asset Management Llc | 0 | -100.00 | 0 | -100.00 | ||||
| 2025-06-26 | NP | Thrivent Core Funds - Thrivent Core Emerging Markets Equity Fund | 54,548 | 0.00 | 616 | -20.65 | ||||
| 2025-08-07 | 13F | Resources Investment Advisors, LLC. | 12,457 | -1.46 | 156 | -14.36 | ||||
| 2025-07-29 | 13F | Lesa Sroufe & Co | 343,008 | 0.38 | 4 | 0.00 | ||||
| 2025-08-07 | 13F | Allworth Financial LP | 12,006 | 138.17 | 150 | 163.16 | ||||
| 2025-08-12 | 13F | Journey Strategic Wealth Llc | 73,492 | 78.94 | 919 | 56.29 | ||||
| 2025-08-27 | NP | RYWTX - Emerging Markets 2x Strategy Fund Class A | 9,905 | 147.93 | 124 | 115.79 | ||||
| 2025-08-19 | 13F | State of Wyoming | 59,222 | -0.22 | 741 | -13.04 | ||||
| 2025-08-14 | 13F | BTG Pactual Asset Management US LLC | 0 | -100.00 | 0 | -100.00 | ||||
| 2025-08-22 | NP | AAAAX - DWS RREEF Real Assets Fund Class A | 728,956 | -16.34 | 9,119 | -27.02 | ||||
| 2025-04-28 | 13F | Ativo Capital Management LLC | 0 | -100.00 | 0 | -100.00 | ||||
| 2025-08-14 | 13F | TCG Advisory Services, LLC | 0 | -100.00 | 0 | |||||
| 2025-08-26 | NP | BGATX - Baillie Gifford Global Alpha Equities Fund Class 2 | 256,555 | 3,210 | ||||||
| 2025-08-12 | 13F | O'shaughnessy Asset Management, Llc | 951,968 | 6.04 | 11,909 | -7.49 | ||||
| 2025-08-13 | 13F | Allie Family Office LLC | 13,860 | 0.00 | 173 | -13.93 | ||||
| 2025-07-14 | 13F | Ridgewood Investments LLC | 47,086 | 52.62 | 589 | 150.64 | ||||
| 2025-08-14 | 13F | EP Wealth Advisors, Inc. | 17,992 | 225 | ||||||
| 2025-08-14 | 13F | Federation des caisses Desjardins du Quebec | 111,606 | -0.71 | 1,398 | -13.34 | ||||
| 2025-08-14 | 13F | Turim 21 Investimentos Ltda. | 3,820 | 48 | ||||||
| 2025-07-25 | NP | DIFAX - MFS Diversified Income Fund A | 221,128 | 62.45 | 2,552 | 40.40 | ||||
| 2025-07-07 | 13F | Retirement Wealth Solutions LLC | 882 | 0.00 | 11 | -8.33 | ||||
| 2025-08-13 | 13F | Mount Yale Investment Advisors, LLC | 13,429 | 168 | ||||||
| 2025-08-14 | 13F | Daiwa Securities Group Inc. | 159,113 | -40.26 | 2 | -66.67 | ||||
| 2025-08-29 | NP | LIVR - Intelligent Livermore ETF | 23,859 | 298 | ||||||
| 2025-07-22 | 13F | MAS Advisors LLC | 29,024 | 4.45 | 363 | -8.79 | ||||
| 2025-06-25 | NP | IPAYX - Integrity Dividend Summit Fund Class I | 23,000 | 15.00 | 260 | -8.80 | ||||
| 2025-08-08 | 13F | Hudock, Inc. | 20,046 | 34.63 | 251 | 17.37 | ||||
| 2025-08-21 | NP | MXENX - Great-West Emerging Markets Equity Fund Institutional Class | 128,591 | -72.12 | 1,609 | -75.69 | ||||
| 2025-08-04 | 13F | Pensionmark Financial Group, Llc | 14,361 | -47.45 | 180 | -54.22 | ||||
| 2025-08-05 | 13F | X-Square Capital, LLC | 21,748 | 0 | ||||||
| 2025-08-06 | 13F | Stone House Investment Management, LLC | 0 | -100.00 | 0 | |||||
| 2025-08-12 | 13F | Advisors Asset Management, Inc. | 152,680 | 8.76 | 1,910 | -5.12 | ||||
| 2025-08-12 | 13F | Rhumbline Advisers | 111,646 | -8.81 | 1,397 | -20.46 | ||||
| 2025-08-13 | 13F | Northern Trust Corp | 1,880,483 | -8.03 | 23,525 | -19.77 | ||||
| 2025-06-26 | NP | EMQAX - Ashmore Emerging Markets Active Equity Fund CLASS A | 19,272 | -30.43 | 218 | -44.78 | ||||
| 2025-07-29 | NP | RBB FUND, INC. - Aquarius International Fund | 10,959 | -81.02 | 126 | -83.64 | ||||
| 2025-05-08 | 13F | Tandem Financial, LLC | 0 | -100.00 | 0 | |||||
| 2025-03-28 | NP | DFEV - Dimensional Emerging Markets Value ETF | 0 | -100.00 | 0 | -100.00 | ||||
| 2025-08-25 | NP | MFS VARIABLE INSURANCE TRUST II - MFS Global Tactical Allocation Portfolio Initial Class | 23,739 | 10.84 | 297 | -3.58 | ||||
| 2025-07-25 | 13F | We Are One Seven, LLC | 55,625 | 8.55 | 696 | -5.31 | ||||
| 2025-08-14 | 13F | Balyasny Asset Management Llc | Call | 56,800 | 711 | |||||
| 2025-08-14 | 13F | Balyasny Asset Management Llc | Put | 31,600 | 395 | |||||
| 2025-08-11 | 13F | B. Metzler seel. Sohn & Co. AG | 410,526 | 0.83 | 5,136 | -12.04 | ||||
| 2025-08-27 | 13F/A | Brinker Capital Investments, LLC | 90,645 | 13.80 | 1,134 | -0.79 | ||||
| 2025-08-29 | 13F | Total Investment Management Inc | 450 | 6 | ||||||
| 2025-09-04 | 13F/A | Advisor Group Holdings, Inc. | 449,315 | 68.84 | 6,069 | 59.01 | ||||
| 2025-08-14 | 13F | Voloridge Investment Management, Llc | 11,396 | -99.78 | 143 | -99.81 | ||||
| 2025-05-12 | 13F | Sagil Capital Llp | Put | 0 | -100.00 | 0 | -100.00 | |||
| 2025-08-12 | 13F | BlackRock, Inc. | 10,934,808 | 10.30 | 136,794 | -3.78 | ||||
| 2025-08-27 | NP | Advanced Series Trust - Ast International Growth Portfolio | 87,809 | -5.71 | 1,098 | -17.75 | ||||
| 2025-04-22 | 13F | Duncker Streett & Co Inc | 0 | -100.00 | 0 | -100.00 | ||||
| 2025-05-13 | 13F | Thrivent Financial For Lutherans | 0 | -100.00 | 0 | -100.00 | ||||
| 2025-08-11 | 13F | Inspire Advisors, LLC | 0 | -100.00 | 0 | |||||
| 2025-08-14 | 13F | Massar Capital Management, LP | 27,500 | 0.00 | 344 | -12.69 | ||||
| 2025-08-13 | 13F | Schroder Investment Management Group | 31,261,243 | 4.90 | 391,078 | -8.48 | ||||
| 2025-07-25 | 13F | JustInvest LLC | 13,728 | 4.17 | 172 | -9.04 | ||||
| 2025-07-11 | 13F | Viking Fund Management Llc | 23,000 | 0.00 | 288 | -12.77 | ||||
| 2025-08-06 | 13F | First Horizon Advisors, Inc. | 207 | 3 | ||||||
| 2025-07-23 | 13F | Vontobel Holding Ltd. | 83,079 | 74.84 | 1,039 | 52.57 | ||||
| 2025-08-08 | 13F | Altfest L J & Co Inc | 0 | -100.00 | 0 | |||||
| 2025-08-27 | NP | THRIVENT SERIES FUND INC - Thrivent International Allocation Portfolio Class A | 26,146 | 90.68 | 327 | 66.84 | ||||
| 2025-07-31 | 13F | Cambridge Investment Research Advisors, Inc. | 184,708 | 12.08 | 2 | 0.00 | ||||
| 2025-08-13 | 13F | Grantham, Mayo, Van Otterloo & Co. LLC | 29,218 | -85.92 | 366 | -87.73 | ||||
| 2025-07-31 | 13F | R Squared Ltd | 28,348 | 94.16 | 355 | 69.38 | ||||
| 2025-06-25 | NP | PRLAX - T. Rowe Price Latin America Fund This fund is a listed as child fund of Price T Rowe Associates Inc /md/ and if that institution has disclosed ownership in this security, then these positions will not be double counted when calculating total shares and total value | 635,177 | 0.00 | 7,171 | -20.54 | ||||
| 2025-05-15 | 13F/A | Clear Street Llc | Call | 0 | -100.00 | 0 | ||||
| 2025-08-06 | 13F | Pekin Hardy Strauss, Inc. | 31,852 | 3.24 | 398 | -9.95 | ||||
| 2025-08-08 | 13F | Banco Bilbao Vizcaya Argentaria, S.a. | 27,621 | 95.53 | 347 | 71.29 | ||||
| 2025-08-14 | 13F | Cubist Systematic Strategies, LLC | Call | 334,800 | 267.91 | 4,188 | 221.17 | |||
| 2025-08-12 | 13F | Segall Bryant & Hamill, Llc | 36,200 | -27.74 | 453 | -37.05 | ||||
| 2025-08-14 | 13F | Cubist Systematic Strategies, LLC | 317,658 | 722.91 | 3,974 | 618.44 | ||||
| 2025-08-14 | 13F | Cubist Systematic Strategies, LLC | Put | 239,300 | -44.09 | 2,994 | -51.23 | |||
| 2025-07-30 | 13F | Whittier Trust Co | 91,382 | 11.51 | 1,143 | -2.72 | ||||
| 2025-08-11 | 13F | Resurgent Financial Advisors LLC | 15,620 | 0.00 | 195 | -12.56 | ||||
| 2025-08-26 | NP | UEMPX - UBS Emerging Markets Equity Opportunity Fund CLASS P | 551,620 | 5.57 | 6,901 | -7.90 | ||||
| 2025-05-15 | 13F/A | Clear Street Llc | Put | 0 | -100.00 | 0 | ||||
| 2025-08-11 | 13F | Lsv Asset Management | 22,000 | 0.00 | 0 | |||||
| 2025-08-13 | 13F | Todd Asset Management Llc | 2,989,446 | 1.09 | 37,398 | -11.81 | ||||
| 2025-04-15 | 13F | TrimTabs Asset Management, LLC | 0 | -100.00 | 0 | |||||
| 2025-07-18 | 13F | Founders Capital Management | 5,000 | 0.00 | 63 | -12.68 | ||||
| 2025-08-26 | NP | EQ ADVISORS TRUST - EQ/International Core Managed Volatility Portfolio Class IB | 53,367 | -10.98 | 668 | -22.35 | ||||
| 2025-08-13 | 13F | Jones Financial Companies Lllp | 39,008 | 307.69 | 483 | 251.82 | ||||
| 2025-07-28 | NP | AVEEX - Avantis Emerging Markets Equity Fund Institutional Class This fund is a listed as child fund of American Century Companies Inc and if that institution has disclosed ownership in this security, then these positions will not be double counted when calculating total shares and total value | 134,560 | -5.56 | 1,553 | -18.40 | ||||
| 2025-07-28 | 13F | Axxcess Wealth Management, Llc | 19,240 | -6.05 | 241 | -18.09 | ||||
| 2025-08-20 | NP | REMG - Emerging Markets Equity Active ETF | 8,995 | 113 | ||||||
| 2025-07-22 | 13F | Old National Bancorp /in/ | 10,675 | -0.68 | 134 | -13.64 | ||||
| 2025-08-05 | 13F | Fullcircle Wealth Llc | 14,525 | 17.14 | 185 | 30.28 | ||||
| 2025-08-11 | 13F | Sprott Inc. | 46,555 | 582 | ||||||
| 2025-08-13 | 13F | Cerity Partners LLC | 43,786 | 10.86 | 548 | -3.36 | ||||
| 2025-08-11 | 13F | Bell Investment Advisors, Inc | 207 | -68.45 | 3 | -77.78 | ||||
| 2025-08-28 | NP | NDOW - Anydrus Advantage ETF | 5,086 | 18.44 | 64 | 3.28 | ||||
| 2025-08-28 | NP | Amplify ETF Trust - Amplify Natural Resources Dividend Income ETF | 49,067 | 5.79 | 614 | -7.82 | ||||
| 2025-08-14 | 13F | Barometer Capital Management Inc. | 0 | -100.00 | 0 | |||||
| 2025-08-13 | 13F | Beacon Pointe Advisors, LLC | 45,061 | -8.82 | 564 | -20.48 | ||||
| 2025-08-14 | 13F | Bnp Paribas | 1,240 | 0.00 | 16 | -11.76 | ||||
| 2025-08-07 | 13F | Cypress Capital Management LLC (WY) | 4 | -99.99 | 0 | -100.00 | ||||
| 2025-07-10 | 13F | Wealth Enhancement Advisory Services, Llc | 90,935 | 1.20 | 1,188 | -7.84 | ||||
| 2025-08-28 | NP | RAPAX - Cohen & Steers Real Assets Fund, Inc. Class A | 81,891 | -1.29 | 1,024 | -13.88 | ||||
| 2025-03-28 | NP | GERIX - Goldman Sachs Emerging Markets Equity Insights Fund Institutional | 1,035,100 | 228.92 | 14,709 | 227.57 | ||||
| 2025-08-14 | 13F | Clark Capital Management Group, Inc. | 0 | -100.00 | 0 | |||||
| 2025-08-13 | 13F | Oaktree Fund Advisors, LLC | 0 | -100.00 | 0 | |||||
| 2025-05-22 | NP | OEQAX - Oaktree Emerging Markets Equity Fund Class A | 173,192 | -22.46 | 2,484 | -13.54 | ||||
| 2025-08-14 | 13F | Erste Asset Management GmbH | 20,000 | 248 | ||||||
| 2025-08-05 | 13F | Carrhae Capital LLP | 0 | -100.00 | 0 | |||||
| 2025-08-05 | 13F | Wellington Shields Capital Management, LLC | 10,000 | -50.00 | 125 | -56.29 | ||||
| 2025-06-26 | NP | FHKFX - Fidelity Series Emerging Markets Fund This fund is a listed as child fund of Fmr Llc and if that institution has disclosed ownership in this security, then these positions will not be double counted when calculating total shares and total value | 814,272 | -25.65 | 9,193 | -40.93 | ||||
| 2025-08-12 | 13F | Franklin Resources Inc | 800,654 | 79.61 | 10,016 | 56.70 | ||||
| 2025-08-14 | 13F | Vennlight Capital Management, LP | 162,000 | 2,027 | ||||||
| 2025-07-17 | 13F | SeaBridge Investment Advisors LLC | 116,031 | 26.62 | 1,452 | 10.43 | ||||
| 2025-08-11 | 13F | Empowered Funds, LLC | 29,979 | 375 | ||||||
| 2025-08-13 | 13F/A | StoneX Group Inc. | 0 | -100.00 | 0 | -100.00 | ||||
| 2025-08-14 | 13F | LMR Partners LLP | Put | 3,400 | -92.22 | 43 | -93.29 | |||
| 2025-08-14 | 13F | LMR Partners LLP | Call | 25,800 | -59.11 | 323 | -64.38 | |||
| 2025-05-15 | 13F | Qube Research & Technologies Ltd | 0 | -100.00 | 0 | -100.00 | ||||
| 2025-04-25 | 13F | Henry James International Management Inc. | 0 | -100.00 | 0 | |||||
| 2025-08-13 | 13F | Capital Fund Management S.a. | Call | 539,900 | 411.75 | 6,754 | 346.69 | |||
| 2025-08-13 | 13F | Capital Fund Management S.a. | Put | 148,200 | 1,854 | |||||
| 2025-05-15 | 13F | Qube Research & Technologies Ltd | Call | 0 | -100.00 | 0 | -100.00 | |||
| 2025-05-15 | 13F | Qube Research & Technologies Ltd | Put | 0 | -100.00 | 0 | -100.00 | |||
| 2025-08-07 | 13F | Teachers Retirement System Of The State Of Kentucky | 1,817,730 | 0.00 | 23 | -15.38 | ||||
| 2025-07-31 | 13F | Glass Jacobson Investment Advisors llc | 0 | -100.00 | 0 | |||||
| 2025-06-24 | NP | JEMA - JPMorgan Emerging Markets Equity Core ETF | 687,800 | 1,112.09 | 7,765 | 863.40 | ||||
| 2025-08-28 | NP | GQGPX - GQG PARTNERS EMERGING MARKETS EQUITY FUND Investor Shares | 61,035,997 | 5.06 | 763,560 | -8.35 | ||||
| 2025-08-13 | 13F | Marshall Wace, Llp | 5,874,953 | 73,496 | ||||||
| 2025-05-05 | 13F | Allianz Asset Management GmbH | 0 | -100.00 | 0 | |||||
| 2025-08-13 | 13F | Diametric Capital, LP | 10,336 | 129 | ||||||
| 2025-06-26 | NP | Dimensional Emerging Markets Value Fund - Dimensional Emerging Markets Value Fund This fund is a listed as child fund of Dimensional Fund Advisors Lp and if that institution has disclosed ownership in this security, then these positions will not be double counted when calculating total shares and total value | 1,849,041 | -3.30 | 20,876 | -23.17 | ||||
| 2025-07-17 | 13F | City Holding Co | 6,773 | 0.00 | 85 | -13.40 | ||||
| 2025-08-14 | 13F | Mariner, LLC | 33,273 | -18.61 | 416 | -29.01 | ||||
| 2025-08-13 | 13F | PACK Private Wealth, LLC | 13,661 | 27.27 | 171 | 11.11 | ||||
| 2025-07-23 | 13F | Tyche Wealth Partners LLC | 25,717 | 45.15 | 322 | 26.38 | ||||
| 2025-08-13 | 13F | CMT Capital Markets Trading GmbH | 168,984 | 106.02 | 2 | 100.00 | ||||
| 2025-08-08 | 13F | Fiera Capital Corp | 0 | -100.00 | 0 | |||||
| 2025-08-08 | 13F/A | Ignite Planners, LLC | 19,511 | -74.60 | 234 | -73.13 | ||||
| 2025-08-13 | 13F | Employees Retirement System of Texas | 314,235 | -21.48 | 4 | -40.00 | ||||
| 2025-08-07 | 13F | Vise Technologies, Inc. | 42,699 | 25.90 | 534 | 22.48 | ||||
| 2025-07-29 | 13F | TrueMark Investments, LLC | 221,000 | 18.32 | 2,765 | 3.21 | ||||
| 2025-08-12 | 13F | Clear Street Markets Llc | 12,700 | 21.25 | 159 | 5.33 | ||||
| 2025-08-14 | 13F | Fmr Llc | 32,413,971 | 1.10 | 405,499 | -11.80 | ||||
| 2025-08-08 | 13F | Candriam Luxembourg S.C.A. | 33,041 | 0.00 | 413 | -12.68 | ||||
| 2025-08-28 | NP | SPEM - SPDR(R) Portfolio Emerging Markets ETF | 2,340,163 | 8.72 | 29,275 | -5.15 | ||||
| 2025-04-28 | 13F | Redmont Wealth Advisors Llc | 0 | -100.00 | 0 | |||||
| 2025-07-30 | 13F | Eqis Capital Management, Inc. | 0 | -100.00 | 0 | |||||
| 2025-07-16 | 13F | Kathmere Capital Management, LLC | 33,966 | 37.04 | 425 | 19.44 | ||||
| 2025-08-22 | NP | VARIABLE INSURANCE PRODUCTS FUND II - Emerging Markets Portfolio Initial Class | 1,556,947 | 33.48 | 19,477 | 16.45 | ||||
| 2025-05-02 | 13F | Capital A Wealth Management, LLC | 637 | 0.00 | 9 | 12.50 | ||||
| 2025-08-14 | 13F | Macquarie Group Ltd | 5,018,966 | 4.77 | 62,787 | -8.60 | ||||
| 2025-05-06 | 13F | Winch Advisory Services, LLC | 0 | -100.00 | 0 | |||||
| 2025-08-12 | 13F | Evelyn Partners Investment Management LLP | 14,910 | 0.00 | 10 | -9.09 | ||||
| 2025-09-05 | 13F | Abn Amro Investment Solutions | 0 | -100.00 | 0 | -100.00 | ||||
| 2025-06-18 | NP | RAZAX - Multi-Asset Growth Strategy Fund Class A | 42,504 | 0.00 | 480 | -20.56 | ||||
| 2025-08-13 | 13F | Hsbc Holdings Plc | 873,924 | 31.49 | 10,932 | 14.70 | ||||
| 2025-08-13 | 13F | Hsbc Holdings Plc | Call | 186,700 | -6.79 | 2,336 | -19.04 | |||
| 2025-08-13 | 13F | Hsbc Holdings Plc | Put | 544,500 | -11.71 | 6,812 | -23.30 | |||
| 2025-07-14 | 13F | Kapitalo Investimentos Ltda | 87,293 | 1,092 | ||||||
| 2025-08-13 | 13F | Twin Peaks Wealth Advisors, LLC | 67 | 1 | ||||||
| 2025-07-28 | NP | AVEM - Avantis Emerging Markets Equity ETF This fund is a listed as child fund of American Century Companies Inc and if that institution has disclosed ownership in this security, then these positions will not be double counted when calculating total shares and total value | 2,412,680 | 21.11 | 27,842 | 4.69 | ||||
| 2025-06-26 | NP | FAMKX - Fidelity Advisor Emerging Markets Fund Class A This fund is a listed as child fund of Fmr Llc and if that institution has disclosed ownership in this security, then these positions will not be double counted when calculating total shares and total value | 10,908,047 | 58.80 | 123,152 | 26.17 | ||||
| 2025-05-12 | 13F | Virtu Financial LLC | 0 | -100.00 | 0 | -100.00 | ||||
| 2025-08-12 | 13F | CIBC Private Wealth Group, LLC | 508 | -29.64 | 6 | -25.00 | ||||
| 2025-07-18 | 13F | Truist Financial Corp | 33,213 | 83.30 | 415 | 60.23 | ||||
| 2025-07-25 | 13F | Sovereign Financial Group, Inc. | 10,617 | 0.00 | 133 | -13.16 | ||||
| 2025-05-14 | 13F | Greenwoods Asset Management Hong Kong Ltd. | 0 | -100.00 | 0 | |||||
| 2025-07-25 | NP | DEMAX - Delaware Emerging Markets Fund Class A | 3,200,000 | 0.00 | 36,928 | -13.56 | ||||
| 2025-08-06 | 13F | Prospera Financial Services Inc | 30,523 | 5.25 | 382 | -8.19 | ||||
| 2025-07-25 | NP | NRES - Xtrackers RREEF Global Natural Resources ETF | 23,155 | 186.18 | 267 | 117.07 | ||||
| 2025-08-13 | 13F | Walleye Capital LLC | Put | 45,500 | 105.88 | 569 | 80.06 | |||
| 2025-08-13 | 13F | Walleye Capital LLC | 84,985 | -65.96 | 1,063 | -70.31 | ||||
| 2025-08-13 | 13F | Walleye Capital LLC | Call | 21,000 | 412.20 | 263 | 351.72 | |||
| 2025-08-08 | 13F | North of South Capital LLP | 113,724 | -36.24 | 1,423 | -44.39 | ||||
| 2025-07-14 | 13F | GAMMA Investing LLC | 895 | -3.14 | 11 | -15.38 | ||||
| 2025-08-14 | 13F | Dark Forest Capital Management Lp | 49,950 | 625 | ||||||
| 2025-08-14 | 13F | Warren Averett Asset Management, LLC | 11,500 | -8.33 | 144 | -20.11 | ||||
| 2025-07-21 | 13F | Patriot Financial Group Insurance Agency, LLC | 12,216 | 3.52 | 153 | -10.06 | ||||
| 2025-06-23 | NP | UBPIX - Ultralatin America Profund Investor Class | 37,098 | -1.32 | 419 | -21.72 | ||||
| 2025-08-28 | NP | SPGM - SPDR(R) Portfolio MSCI Global Stock Market ETF | 21,645 | 2.95 | 271 | -10.30 | ||||
| 2025-08-05 | 13F | Huntington National Bank | 5,498 | 12.07 | 69 | -2.86 | ||||
| 2025-07-28 | 13F | Morningstar Investment Management LLC | 298,508 | 23.83 | 4 | 0.00 | ||||
| 2025-08-08 | 13F | Principal Financial Group Inc | 33,628 | -43.28 | 421 | -50.59 | ||||
| 2025-08-27 | NP | Jnl Series Trust - Jnl/lazard Emerging Markets Fund (a) | 824,875 | 11.90 | 10,319 | -2.38 | ||||
| 2025-07-15 | 13F | Cranbrook Wealth Management, LLC | 600 | 0.00 | 8 | -12.50 | ||||
| 2025-07-25 | NP | BRXAX - MFS Blended Research International Equity Fund A | 476,635 | 9.66 | 5,500 | -5.21 | ||||
| 2025-06-11 | NP | SLANX - DWS Latin America Equity Fund Class A | 288,100 | -15.24 | 3,253 | -32.66 | ||||
| 2025-04-23 | 13F | KG&L Capital Management,LLC | 0 | -100.00 | 0 | -100.00 | ||||
| 2025-08-14 | 13F | Boston Private Wealth Llc | 0 | -100.00 | 0 | |||||
| 2025-08-14 | 13F | Wetherby Asset Management Inc | 40,251 | -8.06 | 504 | -10.50 | ||||
| 2025-08-20 | NP | NATIONWIDE VARIABLE INSURANCE TRUST - NVIT GS Emerging Markets Equity Insights Fund Class Y | 32,550 | -58.22 | 407 | -59.34 | ||||
| 2025-08-13 | 13F | Avestar Capital, LLC | 33,045 | 3.13 | 413 | -10.02 | ||||
| 2025-08-26 | NP | IXC - iShares Global Energy ETF | 1,228,794 | 1.86 | 15,372 | -11.13 | ||||
| 2025-05-01 | 13F | Schechter Investment Advisors, LLC | 0 | -100.00 | 0 | -100.00 | ||||
| 2025-08-11 | 13F | Banque Cantonale Vaudoise | 7,495 | 0 | ||||||
| 2025-08-26 | NP | EQ ADVISORS TRUST - EQ/Lazard Emerging Markets Equity Portfolio Class IB | 471,052 | -17.23 | 5,893 | -27.79 | ||||
| 2025-06-27 | NP | PCEMX - PACE International Emerging Markets Equity Investments Class P | 362,697 | 4.78 | 4,095 | -16.75 | ||||
| 2025-08-14 | 13F | Parvin Asset Management, LLC | 9,200 | 39.39 | 115 | 22.34 | ||||
| 2025-07-24 | 13F | Us Bancorp \de\ | 106,002 | 5.62 | 1,326 | -7.85 | ||||
| 2025-08-06 | 13F | True Wealth Design, LLC | 155 | -13.41 | 2 | -50.00 | ||||
| 2025-08-14 | 13F | DRW Securities, LLC | 76,149 | -41.11 | 953 | -48.65 | ||||
| 2025-08-11 | 13F | Nomura Asset Management Co Ltd | 60,687 | -5.62 | 759 | -17.68 | ||||
| 2025-07-30 | 13F | FNY Investment Advisers, LLC | 12,500 | 448.25 | 0 | |||||
| 2025-08-12 | 13F | Mizuho Securities Co. Ltd. | 200 | -33.33 | 3 | -50.00 | ||||
| 2025-08-01 | 13F | James Investment Research Inc | 26,586 | 0.00 | 333 | -12.86 | ||||
| 2025-08-12 | 13F | American Century Companies Inc | 2,663,898 | 17.21 | 33,325 | 2.25 | ||||
| 2025-07-30 | 13F | Financial Perspectives, Inc | 1,764 | 0.00 | 22 | -12.00 | ||||
| 2025-08-01 | 13F | Banco Santander, S.A. | 293,961 | 89.35 | 3,677 | 65.18 | ||||
| 2025-08-15 | 13F/A | MONECO Advisors, LLC | 0 | -100.00 | 0 | |||||
| 2025-08-14 | 13F/A | Skopos Labs, Inc. | 23,258 | 76.45 | 291 | 53.44 | ||||
| 2025-07-14 | 13F | AdvisorNet Financial, Inc | 268 | -61.60 | 3 | -70.00 | ||||
| 2025-08-13 | 13F | PineBridge Investments, L.P. | 202,110 | 0.00 | 2,528 | -12.77 | ||||
| 2025-07-23 | 13F | Nbt Bank N A /ny | 2,000 | -11.50 | 25 | -21.87 | ||||
| 2025-08-28 | NP | GNR - SPDR(R) S&P(R) Global Natural Resources ETF | 1,282,173 | 1.11 | 16,040 | -11.79 | ||||
| 2025-07-30 | 13F | Legacy Wealth Asset Management, LLC | 39,667 | 2.97 | 496 | -10.14 | ||||
| 2025-08-21 | NP | Thornburg Income Builder Opportunities Trust | 302,585 | 0.00 | 3,785 | -12.77 | ||||
| 2025-08-14 | 13F | Parallax Volatility Advisers, L.P. | 14,578 | 182 | ||||||
| 2025-03-31 | NP | VMNVX - Vanguard Global Minimum Volatility Fund Admiral Shares | 29,677 | -15.54 | 422 | -29.36 | ||||
| 2025-08-13 | 13F | Centiva Capital, LP | 69,415 | 868 | ||||||
| 2025-08-26 | NP | ILF - iShares Latin America 40 ETF | 6,527,485 | 9.44 | 81,659 | -4.53 | ||||
| 2025-06-17 | NP | GSIHX - Goldman Sachs GQG Partners International Opportunities Fund Class A Shares | 71,773,456 | 5.18 | 810,322 | -16.43 | ||||
| 2025-08-07 | NP | OTGAX - OTG Latin America Fund Class A Shares | 36,250 | 0.00 | 453 | -12.72 | ||||
| 2025-08-26 | NP | JOEMX - JOHCM Emerging Markets Opportunities Fund Class Z Shares | 1,459,835 | -1.50 | 18,263 | -14.07 | ||||
| 2025-08-20 | NP | NATIONWIDE VARIABLE INSURANCE TRUST - NVIT Emerging Markets Fund Class I | 191,000 | 20.66 | 2,389 | 5.24 | ||||
| 2025-07-07 | 13F | Wesbanco Bank Inc | 11,208 | 140 | ||||||
| 2025-08-14 | 13F | Group One Trading, L.p. | 2,342,809 | 127.71 | 29,309 | 98.66 | ||||
| 2025-08-08 | 13F | SG Americas Securities, LLC | 440,602 | -30.09 | 6 | -44.44 | ||||
| 2025-08-25 | NP | AMERICAN FUNDS INSURANCE SERIES - New World Fund Class 1 This fund is a listed as child fund of Capital World Investors and if that institution has disclosed ownership in this security, then these positions will not be double counted when calculating total shares and total value | 344,847 | 1,748.35 | 4,314 | 1,705.02 | ||||
| 2025-08-14 | 13F | Group One Trading, L.p. | Put | 13,400 | -99.32 | 155 | -99.45 | |||
| 2025-05-06 | 13F | ANTIPODES PARTNERS Ltd | 0 | -100.00 | 0 | -100.00 | ||||
| 2025-08-14 | 13F | Group One Trading, L.p. | Call | 3,700 | -99.55 | 43 | -99.64 | |||
| 2025-08-26 | NP | BGEHX - Baillie Gifford Emerging Markets Equities Fund Class 2 | 9,158,144 | -14.27 | 114,568 | -25.21 | ||||
| 2025-06-26 | NP | DEXC - Dimensional Emerging Markets ex China Core Equity ETF | 48,450 | 22.97 | 547 | -2.15 | ||||
| 2025-07-21 | 13F | Ping Capital Management, Inc. | 235,000 | 179.76 | 2,940 | 144.10 | ||||
| 2025-06-30 | NP | VT - Vanguard Total World Stock Index Fund ETF Shares | 179,623 | 0.00 | 2,028 | -20.57 | ||||
| 2025-08-11 | 13F | Principal Securities, Inc. | 9,689 | -65.52 | 121 | -66.48 | ||||
| 2025-07-21 | 13F | 25 Llc | 16,818 | 210 | ||||||
| 2025-07-30 | 13F | Cullen/frost Bankers, Inc. | 558 | 0.90 | 7 | -14.29 | ||||
| 2025-08-12 | 13F | Wood Tarver Financial Group, LLC | 221 | 0.00 | 0 | -100.00 | ||||
| 2025-08-13 | 13F | Guggenheim Capital Llc | 136,051 | 11.35 | 1,702 | -2.91 | ||||
| 2025-06-24 | NP | EQNAX - MFS Equity Income Fund A | 165,730 | 1,871 | ||||||
| 2025-06-27 | NP | MPEMX - MONDRIAN EMERGING MARKETS VALUE EQUITY FUND | 33,258 | -4.17 | 375 | -23.94 | ||||
| 2025-04-22 | 13F | E Six Thirteen, Llc | 0 | -100.00 | 0 | |||||
| 2025-08-12 | 13F | Eisler Capital Management Ltd. | 1,338 | 17 | ||||||
| 2025-08-07 | 13F | Payden & Rygel | 10,210 | 0.00 | 0 | |||||
| 2025-08-12 | 13F | Eisler Capital Management Ltd. | Call | 300,000 | 0.00 | 3,753 | -12.72 | |||
| 2025-08-12 | 13F | Eisler Capital Management Ltd. | Put | 600,000 | 0.00 | 7,506 | -12.73 | |||
| 2025-08-08 | 13F | Horrell Capital Management, Inc. | 500 | 0.00 | 6 | -14.29 | ||||
| 2025-08-14 | 13F | Jane Street Group, Llc | 0 | -100.00 | 0 | |||||
| 2025-06-18 | NP | RMYAX - Multi-Strategy Income Fund Class A | 17,713 | 0.33 | 200 | -20.40 | ||||
| 2025-08-14 | 13F | SWAN Capital LLC | 350 | 0.00 | 4 | -20.00 | ||||
| 2025-07-17 | 13F | Sound Income Strategies, LLC | 1,000 | 440.54 | 13 | 500.00 | ||||
| 2025-05-13 | 13F | Clear Street Markets Llc | Put | 0 | -100.00 | 0 | -100.00 | |||
| 2025-07-16 | 13F | FCG Investment Co | 36,176 | 453 | ||||||
| 2025-07-25 | 13F | Yousif Capital Management, Llc | 24,063 | -3.93 | 301 | -16.16 | ||||
| 2025-07-16 | 13F | Signaturefd, Llc | 30,254 | -23.69 | 378 | -33.45 | ||||
| 2025-04-24 | 13F | Boyd Wealth Management, LLC | 0 | -100.00 | 0 | |||||
| 2025-08-14 | 13F/A | Perritt Capital Management Inc | 226 | 0.00 | 3 | -33.33 | ||||
| 2025-08-13 | 13F | Natixis Advisors, L.p. | 1,240,362 | 34.90 | 16 | 15.38 | ||||
| 2025-07-25 | NP | PRDAX - Diversified Real Asset Fund Class A | 35,176 | 43.18 | 406 | 23.85 | ||||
| 2025-08-13 | 13F | Robotti Robert | 50,000 | 0.00 | 626 | -12.83 | ||||
| 2025-08-08 | 13F | Hartland & Co., LLC | 615 | 1.15 | 8 | -12.50 | ||||
| 2025-07-08 | 13F | Nbc Securities, Inc. | 1,021 | 2.10 | 0 | |||||
| 2025-08-13 | 13F | Capital Markets Trading UK LLP | 152,196 | -69.26 | 2 | -85.71 | ||||
| 2025-08-08 | 13F | Financial Gravity Companies, Inc. | 2,041 | -0.63 | 26 | -3.85 | ||||
| 2025-07-17 | 13F | Janney Montgomery Scott LLC | 31,441 | -7.70 | 0 | |||||
| 2025-08-28 | NP | GQRRX - GQG PARTNERS GLOBAL QUALITY EQUITY FUND R6 Shares | 1,442,684 | -43.26 | 18,048 | -50.50 | ||||
| 2025-07-07 | 13F | Investors Research Corp | 1,109 | 0.00 | 14 | -13.33 | ||||
| 2025-08-11 | 13F | Dorsey & Whitney Trust CO LLC | 0 | -100.00 | 0 | |||||
| 2025-08-13 | 13F | Qtron Investments LLC | 114,020 | 12.52 | 1,426 | -1.86 | ||||
| 2025-07-29 | 13F | Regions Financial Corp | 20,913 | 43.49 | 262 | 24.88 | ||||
| 2025-05-05 | 13F | Transce3nd, LLC | 0 | -100.00 | 0 | |||||
| 2025-08-14 | 13F | Vident Advisory, LLC | 106,770 | 38.54 | 1,336 | 20.81 | ||||
| 2025-08-19 | 13F | Marex Group plc | 48,151 | 602 | ||||||
| 2025-08-28 | NP | QEMM - SPDR MSCI Emerging Markets StrategicFactors ETF | 4,423 | -3.95 | 55 | -16.67 | ||||
| 2025-08-01 | 13F | Envestnet Asset Management Inc | 1,023,858 | -33.47 | 12,808 | -41.96 | ||||
| 2025-05-29 | NP | VICTORY VARIABLE INSURANCE FUNDS - Victory Sophus Emerging Markets VIP Series Class I | 18,035 | -10.43 | 259 | 0.00 | ||||
| 2025-07-10 | 13F | Oliver Lagore Vanvalin Investment Group | 1,001 | 0.00 | 14 | 16.67 | ||||
| 2025-07-24 | 13F | Ramirez Asset Management, Inc. | 87 | -99.97 | 1 | -99.98 | ||||
| 2025-08-14 | 13F | Integrated Wealth Concepts LLC | 56,486 | -6.16 | 707 | -18.19 | ||||
| 2025-03-31 | NP | FEMYX - Fidelity Series Sustainable Emerging Markets Fund | 1,464 | -24.18 | 21 | -20.00 | ||||
| 2025-07-16 | 13F | Eagle Global Advisors Llc | 82,100 | -10.86 | 1,027 | -22.20 | ||||
| 2025-08-11 | 13F | Artemis Investment Management LLP | 2,518,451 | -35.57 | 31,506 | -43.79 | ||||
| 2025-05-15 | 13F | CAPROCK Group, Inc. | 141,712 | 15.26 | 2,032 | 19.67 | ||||
| 2025-07-28 | 13F | Rosenberg Matthew Hamilton | 1,447 | -24.16 | 18 | -33.33 | ||||
| 2025-07-28 | 13F | Naviter Wealth, LLC | 23,231 | 291 | ||||||
| 2025-08-13 | 13F | Thornburg Investment Management Inc | 7,713,498 | -0.48 | 96,496 | -91.32 | ||||
| 2025-04-01 | NP | PRMSX - T. Rowe Price Emerging Markets Stock Fund This fund is a listed as child fund of Price T Rowe Associates Inc /md/ and if that institution has disclosed ownership in this security, then these positions will not be double counted when calculating total shares and total value | 3,513,636 | 27.56 | 49,929 | 34.77 | ||||
| 2025-08-12 | 13F | Dimensional Fund Advisors Lp | 3,053,286 | 4.08 | 38,177 | -9.26 | ||||
| 2025-08-13 | 13F | Townsquare Capital Llc | 0 | -100.00 | 0 | |||||
| 2025-08-14 | 13F | Sunbelt Securities, Inc. | 10,031 | 167,083.33 | 129 | |||||
| 2025-08-12 | 13F | XTX Topco Ltd | 159,382 | 1,994 | ||||||
| 2025-08-27 | NP | RYDEX VARIABLE TRUST - Energy Fund Variable Annuity | 10,167 | -7.97 | 127 | -19.62 | ||||
| 2025-04-01 | NP | RPGAX - T. Rowe Price Global Allocation Fund, Inc. This fund is a listed as child fund of Price T Rowe Associates Inc /md/ and if that institution has disclosed ownership in this security, then these positions will not be double counted when calculating total shares and total value | 23,100 | 30.51 | 328 | 37.82 | ||||
| 2025-07-24 | 13F | IFP Advisors, Inc | 978 | 10.38 | 12 | 0.00 | ||||
| 2025-05-15 | 13F | Cullen Capital Management, LLC | 2,506,251 | 50.10 | 35,940 | 67.37 | ||||
| 2025-07-22 | 13F | Diligent Investors, LLC | 0 | -100.00 | 0 | |||||
| 2025-08-06 | 13F | Commonwealth Equity Services, Llc | 253,816 | -7.87 | 3 | 0.00 | ||||
| 2025-07-22 | 13F | IMC-Chicago, LLC | Put | 82,300 | 155.59 | 1,030 | 123.21 | |||
| 2025-07-22 | 13F | IMC-Chicago, LLC | Call | 133,500 | 1.29 | 1,670 | -11.64 | |||
| 2025-08-11 | 13F | TD Waterhouse Canada Inc. | 30 | 0.00 | 0 | |||||
| 2025-07-15 | 13F | Colonial River Wealth Management, LLC | 19,240 | -6.05 | 247 | -16.04 | ||||
| 2025-07-30 | 13F | Bogart Wealth, LLC | 350 | 0.00 | 4 | -20.00 | ||||
| 2025-08-14 | 13F | Smartleaf Asset Management LLC | 86 | -64.02 | 1 | -66.67 | ||||
| 2025-06-26 | NP | NEWFX - NEW WORLD FUND INC Class A | 5,799,400 | 1,582.18 | 65,475 | 1,236.77 | ||||
| 2025-07-17 | 13F | Nelson, Van Denburg & Campbell Wealth Management Group, LLC | 13,434 | -66.84 | 168 | -71.03 | ||||
| 2025-07-28 | 13F | Ritholtz Wealth Management | 185,765 | -2.95 | 2,324 | -15.34 | ||||
| 2025-08-14 | 13F | Point72 Asset Management, L.P. | Put | 158,100 | 0.00 | 1,978 | -12.79 | |||
| 2025-08-14 | 13F | Point72 Asset Management, L.P. | 3,410,815 | -1.81 | 42,669 | -14.34 | ||||
| 2025-08-14 | 13F | Point72 Asset Management, L.P. | Call | 254,900 | -17.13 | 3,189 | -27.71 | |||
| 2025-08-21 | NP | LZOEX - Lazard Emerging Markets Equity Portfolio Open Shares | 3,884,396 | -10.32 | 48,594 | -21.76 | ||||
| 2025-08-26 | NP | BGEZX - Baillie Gifford Emerging Markets ex China Fund Class K | 1,958 | 0.00 | 24 | -14.29 | ||||
| 2025-08-12 | 13F | Centric Wealth Management | 31,699 | 384 | ||||||
| 2025-05-15 | 13F | Royal Bank Of Canada | Call | 0 | -100.00 | 0 | -100.00 | |||
| 2025-05-15 | 13F | Royal Bank Of Canada | Put | 0 | -100.00 | 0 | -100.00 | |||
| 2025-08-13 | 13F | Virtus Investment Advisers, Inc. | 13,126 | 14.19 | 164 | 0.00 | ||||
| 2025-08-14 | 13F | Millennium Management Llc | Call | 11,500 | -81.02 | 144 | -83.54 | |||
| 2025-08-14 | 13F | Millennium Management Llc | 1,396,748 | -71.97 | 17,473 | -75.55 | ||||
| 2025-08-13 | 13F | Channing Global Advisors, Llc | 140 | -36.65 | 2 | -66.67 | ||||
| 2025-08-14 | 13F | Millennium Management Llc | Put | 75,100 | -76.08 | 940 | -79.14 | |||
| 2025-06-26 | NP | MFWTX - MFS Global Total Return Fund A | 153,373 | 78.65 | 1,732 | 42.00 | ||||
| 2025-06-26 | NP | Dfa Investment Trust Co - The Emerging Markets Series This fund is a listed as child fund of Dimensional Fund Advisors Lp and if that institution has disclosed ownership in this security, then these positions will not be double counted when calculating total shares and total value | 142,561 | 0.00 | 1,610 | -20.54 | ||||
| 2025-08-14 | 13F | BI Asset Management Fondsmaeglerselskab A/S | 92,668 | 87.70 | 1 | |||||
| 2025-08-05 | 13F | Bank of New York Mellon Corp | 75,294 | -7.17 | 942 | -19.09 | ||||
| 2025-08-13 | 13F | Cresset Asset Management, LLC | 15,683 | 55.91 | 201 | 39.58 | ||||
| 2025-07-08 | 13F/A | Salem Investment Counselors Inc | 564,661 | 8.40 | 7,065 | -5.42 | ||||
| 2025-08-14 | 13F | Goldman Sachs Group Inc | Call | 1,720,000 | 9.55 | 21,517 | -4.42 | |||
| 2025-05-15 | 13F | Parallax Volatility Advisers, L.P. | Put | 0 | -100.00 | 0 | -100.00 | |||
| 2025-08-14 | 13F | Goldman Sachs Group Inc | 8,082,780 | 30.80 | 101,116 | 14.10 | ||||
| 2025-05-15 | 13F | Parallax Volatility Advisers, L.P. | Call | 0 | -100.00 | 0 | -100.00 | |||
| 2025-07-08 | 13F | Atwood & Palmer Inc | 327 | 0.00 | 4 | 0.00 | ||||
| 2025-08-13 | 13F | Continuum Advisory, LLC | 0 | -100.00 | 0 | |||||
| 2025-07-25 | NP | DWGAX - AMERICAN FUNDS DEVELOPING WORLD GROWTH & INCOME FUND Class A This fund is a listed as child fund of Capital World Investors and if that institution has disclosed ownership in this security, then these positions will not be double counted when calculating total shares and total value | 837,825 | -82.21 | 9,668 | -73.10 | ||||
| 2025-08-07 | 13F | Altman Advisors, Inc. | 130,928 | 3.18 | 1,648 | 15.08 | ||||
| 2025-08-14 | 13F | Ancora Advisors, LLC | 472 | 6 | ||||||
| 2025-08-25 | NP | MEMX - Matthews Emerging Markets ex China Active ETF | 22,258 | -15.62 | 278 | -26.46 | ||||
| 2025-08-07 | 13F | HighPoint Advisor Group LLC | 0 | -100.00 | 0 | |||||
| 2025-03-26 | NP | FTLS - First Trust Long/Short Equity ETF This fund is a listed as child fund of First Trust Advisors Lp and if that institution has disclosed ownership in this security, then these positions will not be double counted when calculating total shares and total value | 506,190 | -36.19 | 7,193 | -32.59 | ||||
| 2025-08-13 | 13F | Arrowstreet Capital, Limited Partnership | 0 | -100.00 | 0 | |||||
| 2025-08-11 | 13F | Truffle Hound Capital, LLC | 0 | -100.00 | 0 | |||||
| 2025-08-14 | 13F | Goldman Sachs Group Inc | Put | 995,200 | -63.41 | 12,450 | -68.08 | |||
| 2025-08-14 | 13F | Atomi Financial Group, Inc. | 41,305 | -17.91 | 517 | -28.43 | ||||
| 2025-07-25 | 13F | Sequoia Financial Advisors, LLC | 19,560 | 245 | ||||||
| 2025-05-15 | 13F/A | Orion Portfolio Solutions, LLC | 79,655 | -13.51 | 1,142 | -3.55 | ||||
| 2025-07-31 | 13F | Oppenheimer Asset Management Inc. | 341,296 | 0.25 | 4,270 | -12.54 | ||||
| 2025-08-13 | 13F | Capital Fund Management S.a. | 307,194 | 3,843 | ||||||
| 2025-08-14 | 13F | Cohen & Steers, Inc. | 194,712 | -2.50 | 2 | 0.00 | ||||
| 2025-08-06 | 13F | Fox Run Management, L.l.c. | 0 | -100.00 | 0 | |||||
| 2025-08-13 | 13F | CMT Capital Markets Trading GmbH | Put | 593,500 | -30.08 | 7 | -41.67 | |||
| 2025-06-26 | NP | DFAE - Dimensional Emerging Core Equity Market ETF | 103,050 | 0.00 | 1,163 | -20.56 | ||||
| 2025-08-14 | 13F | Camden Capital, LLC | 250,000 | 66.67 | 3,128 | 45.37 | ||||
| 2025-08-13 | 13F | CMT Capital Markets Trading GmbH | Call | 413,700 | -16.78 | 5 | -28.57 | |||
| 2025-07-22 | 13F | Sava Infond d.o.o. | 23,000 | 0.00 | 288 | -12.77 | ||||
| 2025-05-29 | NP | GBEMX - Victory Sophus Emerging Markets Fund Class A | 230,145 | -23.26 | 3,300 | -14.42 | ||||
| 2025-07-25 | NP | USAWX - World Growth Fund Shares | 70,435 | -5.62 | 813 | -18.47 | ||||
| 2025-08-07 | 13F | Campbell & CO Investment Adviser LLC | 118,230 | 31.68 | 1,479 | 14.92 | ||||
| 2025-08-01 | 13F | Y-Intercept (Hong Kong) Ltd | 1,494,991 | 341.75 | 18,702 | 285.37 | ||||
| 2025-08-11 | 13F | Brown Brothers Harriman & Co | 129 | -99.50 | 2 | -99.72 | ||||
| 2025-08-14 | 13F | Jane Street Group, Llc | Put | 594,100 | -12.88 | 7,432 | -23.99 | |||
| 2025-07-22 | 13F | Simplicity Wealth,LLC | 52,000 | 651 | ||||||
| 2025-07-14 | 13F | Abound Wealth Management | 24 | -7.69 | 0 | |||||
| 2025-08-14 | 13F | Jane Street Group, Llc | Call | 1,437,300 | 264.89 | 17,981 | 218.34 | |||
| 2025-07-29 | 13F | Stratos Wealth Advisors, LLC | 10,352 | 130 | ||||||
| 2025-08-14 | 13F | Two Sigma Securities, Llc | 53,829 | 324.32 | 673 | 271.82 | ||||
| 2025-05-05 | 13F | Eagle Bay Advisors LLC | 0 | -100.00 | 0 | -100.00 | ||||
| 2025-08-06 | 13F | Csenge Advisory Group | 0 | -100.00 | 0 | |||||
| 2025-08-14 | 13F | Bank Of America Corp /de/ | 5,209,806 | -8.03 | 65,175 | -19.76 | ||||
| 2025-08-14 | 13F | Axa S.a. | 116,562 | 0.00 | 1,458 | -12.75 | ||||
| 2025-07-31 | 13F | Briaud Financial Planning, Inc | 50 | 0.00 | 0 | |||||
| 2025-08-12 | 13F | Inscription Capital, LLC | 0 | -100.00 | 0 | |||||
| 2025-08-14 | 13F | Sompo Japan Nipponkoa Asset Management Co.,ltd. | 0 | -100.00 | 0 | |||||
| 2025-08-14 | 13F | Wells Fargo & Company/mn | 992,048 | -15.09 | 12,411 | -25.93 | ||||
| 2025-08-18 | 13F | N.E.W. Advisory Services LLC | 0 | -100.00 | 0 | |||||
| 2025-07-16 | 13F | Brave Asset Management Inc | 15,793 | 198 | ||||||
| 2025-07-22 | 13F | Checchi Capital Advisers, LLC | 24,866 | -6.04 | 311 | -17.94 | ||||
| 2025-08-12 | 13F | Global Retirement Partners, LLC | 91,093 | 651.47 | 1,140 | 634.84 | ||||
| 2025-08-14 | 13F | Gotham Asset Management, LLC | 50,719 | 126.23 | 634 | 97.51 | ||||
| 2025-08-14 | 13F | Stifel Financial Corp | 183,385 | -2.77 | 2,294 | -15.16 | ||||
| 2025-08-26 | NP | SBHEX - Segall Bryant & Hamill Emerging Markets Fund Retail Class | 24,700 | 0.00 | 309 | -12.99 | ||||
| 2025-07-17 | 13F | Wolff Wiese Magana Llc | 5,000 | 0.00 | 63 | -12.68 | ||||
| 2025-06-26 | NP | MSTFX - Morningstar International Equity Fund | 205,024 | 186.29 | 2,315 | 186.39 | ||||
| 2025-08-12 | 13F | J.w. Cole Advisors, Inc. | 11,515 | 144 | ||||||
| 2025-08-04 | 13F | Strs Ohio | 37,465 | 0.00 | 469 | -12.85 | ||||
| 2025-08-12 | 13F | Ameraudi Asset Management, Inc. | 13,850 | 0.00 | 173 | -12.63 | ||||
| 2025-08-14 | 13F | Wealth Preservation Advisors, LLC | 0 | -100.00 | 0 | |||||
| 2025-07-09 | 13F | Radnor Capital Management, LLC | 50,300 | 0.00 | 1 | |||||
| 2025-08-14 | 13F | Royal Bank Of Canada | 558,142 | 46.05 | 6,982 | 27.41 | ||||
| 2025-08-13 | 13F | Capital Markets Trading UK LLP | Put | 1,227,300 | 3.20 | 15 | -11.76 | |||
| 2025-07-15 | 13F | SJS Investment Consulting Inc. | 653 | 0.00 | 8 | -11.11 | ||||
| 2025-08-13 | 13F | Capital Markets Trading UK LLP | Call | 546,800 | -28.53 | 7 | -40.00 | |||
| 2025-07-25 | 13F | Cwm, Llc | 4,802 | -20.07 | 0 | |||||
| 2025-05-06 | 13F | Venturi Wealth Management, LLC | 0 | -100.00 | 0 | |||||
| 2025-08-13 | 13F | Contrarian Capital Management, L.l.c. | 1,928,173 | -50.64 | 24,121 | -56.94 | ||||
| 2025-08-25 | NP | MFS VARIABLE INSURANCE TRUST II - MFS Emerging Markets Equity Portfolio Initial Class | 38,139 | 34.84 | 477 | 17.78 | ||||
| 2025-07-11 | 13F | Kingstone Capital Partners Texas, LLC | 11,556,690 | 148 | ||||||
| 2025-05-14 | 13F | Legacy Financial Advisors, Inc. | 0 | -100.00 | 0 | |||||
| 2025-07-24 | 13F | Comprehensive Money Management Services LLC | 20,455 | 0.00 | 256 | -12.97 | ||||
| 2025-08-11 | 13F | NewEdge Wealth, LLC | 0 | -100.00 | 0 | |||||
| 2025-08-11 | 13F | Frank, Rimerman Advisors LLC | 35,055 | 439 | ||||||
| 2025-07-21 | 13F | Matthews International Capital Management Llc | 23,829 | -14.74 | 298 | -25.50 | ||||
| 2025-08-29 | NP | JAVAX - James Aggressive Allocation Fund | 20,000 | 0.00 | 250 | -12.59 | ||||
| 2025-08-04 | 13F | Migdal Insurance & Financial Holdings Ltd. | 2,180 | 0.00 | 0 | |||||
| 2025-08-18 | 13F | Geneos Wealth Management Inc. | 2,438 | 74.89 | 30 | 57.89 | ||||
| 2025-08-13 | 13F | Northwestern Mutual Wealth Management Co | 98,683 | 12.95 | 1,235 | -1.44 | ||||
| 2025-07-22 | 13F | Gsa Capital Partners Llp | 0 | -100.00 | 0 | |||||
| 2025-05-13 | 13F | Geode Capital Management, Llc | 0 | -100.00 | 0 | -100.00 | ||||
| 2025-08-14 | 13F | Mercer Global Advisors Inc /adv | 16,206 | -24.08 | 203 | -33.99 | ||||
| 2025-04-09 | 13F | American National Bank | 0 | -100.00 | 0 | |||||
| 2025-08-27 | NP | JNL SERIES TRUST - JNL/GQG Emerging Markets Equity Fund (A) | 2,105,491 | -2.22 | 26,340 | -14.70 | ||||
| 2025-07-30 | 13F | DekaBank Deutsche Girozentrale | 30,000 | 0.00 | 0 | |||||
| 2025-08-13 | 13F | Oaktree Capital Management Lp | 0 | -100.00 | 0 | -100.00 | ||||
| 2025-07-24 | 13F | Jfs Wealth Advisors, Llc | 466 | -54.98 | 6 | -64.29 | ||||
| 2025-05-05 | 13F | Lindbrook Capital, Llc | 16,587 | 2.52 | 238 | 13.94 | ||||
| 2025-07-15 | 13F | Public Employees Retirement System Of Ohio | 1,597,885 | -33.13 | 19,990 | -41.66 | ||||
| 2025-08-27 | 13F/A | Squarepoint Ops LLC | Put | 706,400 | -3.39 | 8,837 | -15.72 | |||
| 2025-08-27 | 13F/A | Squarepoint Ops LLC | 1,094,963 | 137.92 | 13,698 | 107.56 | ||||
| 2025-05-12 | 13F | Peapack Gladstone Financial Corp | 0 | -100.00 | 0 | |||||
| 2025-08-14 | 13F | Wiley Bros.-aintree Capital, Llc | 20,070 | -17.01 | 251 | -27.67 | ||||
| 2025-07-28 | 13F | J.Safra Asset Management Corp | 13,997 | 0.00 | 173 | -13.50 | ||||
| 2025-08-14 | 13F | Quantinno Capital Management LP | 53,897 | 35.05 | 674 | 17.83 | ||||
| 2025-07-28 | 13F | Ckw Financial Group | 59 | -74.79 | 0 | |||||
| 2025-08-26 | NP | Profunds - Profund Vp Emerging Markets | 31,777 | 11.17 | 398 | -2.93 | ||||
| 2025-07-08 | 13F | Northwest & Ethical Investments L.P. | 0 | -100.00 | 0 | -100.00 | ||||
| 2025-07-28 | 13F | Kiker Wealth Management, LLC | 5,718 | 158.27 | 72 | 129.03 | ||||
| 2025-07-24 | 13F | Financial Security Advisor, Inc. | 17,800 | 0.00 | 223 | -12.94 | ||||
| 2025-08-05 | 13F | Obermeyer Wood Investment Counsel, Lllp | 44,650 | -5.87 | 559 | -17.94 | ||||
| 2025-06-26 | NP | Elevation Series Trust - The Opal International Dividend Income ETF | 197,936 | 53.73 | 2,235 | 22.14 | ||||
| 2025-08-01 | 13F | Alexander Labrunerie & Co., Inc. | 10,050 | 0.00 | 126 | -13.19 | ||||
| 2025-08-01 | 13F | Rossby Financial, LCC | 10,705 | -0.09 | 134 | 8.13 | ||||
| 2025-06-26 | NP | FEMSX - Fidelity Series Emerging Markets Opportunities Fund This fund is a listed as child fund of Fmr Llc and if that institution has disclosed ownership in this security, then these positions will not be double counted when calculating total shares and total value | 3,710,035 | -1.11 | 41,886 | -21.43 | ||||
| 2025-07-16 | 13F | Highline Wealth Partners Llc | 717 | -13.51 | 9 | -27.27 | ||||
| 2025-08-07 | 13F | Midwest Trust Co | 23,454 | 293 | ||||||
| 2025-08-13 | 13F | Amundi | 144,763 | 0.00 | 1,875 | -7.59 | ||||
| 2025-08-13 | 13F | Cloverfields Capital Group, Lp | 282,151 | 29.22 | 3,530 | 12.71 | ||||
| 2025-08-08 | 13F | Pnc Financial Services Group, Inc. | 32,919 | 29.67 | 412 | 12.91 | ||||
| 2025-04-21 | 13F | Envestnet Portfolio Solutions, Inc. | 0 | -100.00 | 0 | |||||
| 2025-08-13 | 13F | Ted Buchan & Co | 244,299 | 10.08 | 3,056 | -3.96 | ||||
| 2025-07-11 | 13F | Seacrest Wealth Management, Llc | 56,660 | -2.52 | 709 | -15.01 | ||||
| 2025-08-14 | 13F | Masters Capital Management Llc | 1,000,000 | 0.00 | 12,510 | -12.76 | ||||
| 2025-08-22 | NP | Columbia Funds Variable Series Trust II - Columbia Variable Portfolio - Emerging Markets Fund Class 3 | 386,360 | 93.87 | 4,833 | 69.16 | ||||
| 2025-08-08 | 13F | Creative Planning | 134,527 | -6.15 | 1,683 | -18.15 | ||||
| 2025-07-23 | 13F | High Note Wealth, LLC | 41 | 1 | ||||||
| 2025-08-28 | NP | IDVO - Amplify International Enhanced Dividend Income ETF | 254,540 | -17.92 | 3,184 | -28.40 | ||||
| 2025-08-11 | 13F | Anfield Capital Management, LLC | 7,322 | 0.00 | 92 | -12.50 | ||||
| 2025-06-26 | NP | TWAAX - Thrivent International Allocation Fund Class A | 7,420 | 0.00 | 84 | -20.95 | ||||
| 2025-08-26 | NP | NMMEX - Active M Emerging Markets Equity Fund | 74,700 | 6.56 | 934 | -7.06 | ||||
| 2025-08-07 | 13F | Profund Advisors Llc | 78,328 | -5.78 | 980 | -17.87 | ||||
| 2025-07-17 | 13F | Venture Visionary Partners LLC | 229,786 | 13.79 | 2,875 | -0.73 | ||||
| 2025-07-16 | 13F | ORG Partners LLC | 2,318 | 10.75 | 29 | -3.33 | ||||
| 2025-08-13 | 13F | Fisher Asset Management, LLC | 14,587,174 | -2.55 | 182,486 | -14.99 | ||||
| 2025-06-20 | NP | ABLD - Donoghue Forlines Yield Enhanced Real Asset ETF | 97,512 | 695.56 | 1,101 | 532.18 | ||||
| 2025-08-14 | 13F | Moneda S.A. Administradora General de Fondos | 510,578 | -21.41 | 6,387 | -31.43 | ||||
| 2025-08-15 | 13F | CI Private Wealth, LLC | 37,872 | -33.03 | 474 | -41.39 | ||||
| 2025-08-19 | 13F | Newbridge Financial Services Group, Inc. | 1,625 | 0.00 | 20 | -13.04 | ||||
| 2025-08-06 | 13F | Savant Capital, LLC | 11,199 | 140 | ||||||
| 2025-06-25 | NP | IMRFX - Columbia Global Opportunities Fund Class A | 24,416 | 95.77 | 276 | 55.37 | ||||
| 2025-08-12 | 13F | Pathstone Holdings, LLC | 30,828 | -22.02 | 386 | -32.10 | ||||
| 2025-05-14 | 13F | First Trust Advisors Lp | 0 | -100.00 | 0 | |||||
| 2025-07-15 | 13F | Ballentine Partners, LLC | 11,593 | -12.41 | 145 | -23.28 | ||||
| 2025-08-12 | 13F | Retirement Planning Co of New England, Inc. | 38,775 | 12.28 | 485 | -2.02 | ||||
| 2025-08-14 | 13F | Riggs Asset Managment Co. Inc. | 145 | 2 | ||||||
| 2025-08-27 | NP | VHGEX - Vanguard Global Equity Fund Investor Shares | 1,777,083 | 0.00 | 22,231 | -12.76 | ||||
| 2025-07-28 | NP | AVXC - Avantis Emerging Markets ex-China Equity ETF | 37,399 | 71.01 | 432 | 48.11 | ||||
| 2025-04-28 | NP | GBFFX - GMO Benchmark-Free Fund Class III | 27 | -99.11 | 0 | -100.00 | ||||
| 2025-08-28 | NP | ARMIX - ARGA EMERGING MARKETS VALUE FUND Institutional Shares | 1,267,747 | 0.00 | 15,860 | -12.76 | ||||
| 2025-05-15 | 13F | Tudor Investment Corp Et Al | Call | 0 | -100.00 | 0 | ||||
| 2025-08-14 | 13F | Toroso Investments, LLC | 49,067 | 5.79 | 614 | -7.82 | ||||
| 2025-04-30 | 13F | Sofos Investments, Inc. | 2,054 | 29 | ||||||
| 2025-08-13 | 13F | Flow Traders U.s. Llc | 23,964 | 17.30 | 0 | |||||
| 2025-08-13 | 13F | Walleye Trading LLC | Call | 12,400 | -94.94 | 155 | -95.59 | |||
| 2025-08-13 | 13F | Walleye Trading LLC | Put | 72,200 | -81.87 | 903 | -84.19 | |||
| 2025-08-11 | 13F | United Advisor Group, LLC | 16,429 | 59.47 | 206 | 39.46 | ||||
| 2025-08-13 | 13F | Walleye Trading LLC | 114,336 | 239.03 | 1,430 | 196.07 | ||||
| 2025-08-14 | 13F | Lazard Asset Management Llc | 19,139,752 | -12.51 | 239 | -23.64 | ||||
| 2025-08-07 | 13F | Sierra Ocean, Llc | 1,232 | 17.45 | 15 | 0.00 | ||||
| 2025-08-13 | 13F | Quadrature Capital Ltd | 325,492 | 4,074 | ||||||
| 2025-06-30 | NP | AIM INVESTMENT FUNDS (INVESCO INVESTMENT FUNDS) - Invesco Oppenheimer Global Allocation Fund Class R | 23,131 | 261 | ||||||
| 2025-08-14 | 13F | MIRAE ASSET GLOBAL ETFS HOLDINGS Ltd. | 48,238 | 46.83 | 603 | 28.03 | ||||
| 2025-08-14 | 13F | Hilltop Holdings Inc. | 13,265 | -12.10 | 166 | -23.61 | ||||
| 2025-08-14 | 13F | Horizon Investments, LLC | 0 | -100.00 | 0 | |||||
| 2025-07-30 | NP | APIE - ActivePassive International Equity ETF | 90,780 | -46.43 | 1,048 | -53.71 | ||||
| 2025-08-13 | 13F | Consultiva Wealth Management, Corp. | 1,000 | 0.00 | 13 | -14.29 | ||||
| 2025-04-01 | NP | IEMFX - T. Rowe Price Institutional Emerging Markets Equity Fund This fund is a listed as child fund of Price T Rowe Associates Inc /md/ and if that institution has disclosed ownership in this security, then these positions will not be double counted when calculating total shares and total value | 353,473 | 20.69 | 5,023 | 27.49 | ||||
| 2025-08-12 | 13F | SPX Equities Gestao de Recursos Ltda | 4,990,500 | 228.24 | 62,431 | 186.35 | ||||
| 2025-08-27 | NP | THRIVENT SERIES FUND INC - Thrivent Partner Emerging Markets Equity Portfolio Class A | 11,186 | 74.64 | 140 | 52.75 | ||||
| 2025-07-29 | 13F | Activest Wealth Management | 3,846 | 0.42 | 48 | -11.11 | ||||
| 2025-08-14 | 13F | D. E. Shaw & Co., Inc. | 3,147,889 | 363.47 | 39,380 | 304.35 | ||||
| 2025-08-14 | 13F | D. E. Shaw & Co., Inc. | Put | 86,000 | -33.02 | 1,076 | -41.61 | |||
| 2025-08-14 | 13F | D. E. Shaw & Co., Inc. | Call | 23,700 | 296 | |||||
| 2025-06-30 | NP | AIM INVESTMENT FUNDS (INVESCO INVESTMENT FUNDS) - Invesco Oppenheimer Developing Markets Fund Class R6 | 7,200,842 | 81,298 | ||||||
| 2025-08-11 | 13F | Poehling Capital Management, LLC | 236,251 | 3.43 | 2,956 | -9.77 | ||||
| 2025-07-14 | 13F | U.S. Capital Wealth Advisors, LLC | 15,200 | -1.52 | 190 | -14.03 | ||||
| 2025-08-14 | 13F | Bluefin Capital Management, Llc | 16,200 | 203 | ||||||
| 2025-08-14 | 13F | Bluefin Capital Management, Llc | Put | 10,900 | 0 | |||||
| 2025-08-27 | NP | RYEIX - Energy Fund Investor Class | 16,309 | 1.35 | 204 | -11.30 | ||||
| 2025-08-14 | 13F | Kovitz Investment Group Partners, LLC | 301,240 | 0.01 | 3,769 | -12.76 | ||||
| 2025-08-13 | 13F | Provida Pension Fund Administrator | 0 | -100.00 | 0 | -100.00 | ||||
| 2025-04-10 | 13F | Retireful, LLC | 0 | -100.00 | 0 | |||||
| 2025-07-10 | 13F | Sumitomo Mitsui DS Asset Management Company, Ltd | 16,000 | 0.00 | 200 | -12.66 | ||||
| 2025-08-05 | 13F | Sigma Planning Corp | 33,453 | -60.43 | 422 | -65.26 | ||||
| 2025-08-07 | 13F | Kestra Private Wealth Services, Llc | 16,184 | -26.40 | 202 | -35.87 | ||||
| 2025-08-12 | 13F | LPL Financial LLC | 339,767 | -13.38 | 4,250 | -24.43 | ||||
| 2025-07-30 | 13F | D.a. Davidson & Co. | 12,921 | 162 | ||||||
| 2025-08-27 | NP | TPIAX - Timothy Plan International Fund Class A | 81,500 | 0.00 | 1,020 | -12.76 | ||||
| 2025-07-25 | 13F | Allspring Global Investments Holdings, LLC | 1,187,462 | 6.91 | 14,950 | -6.91 | ||||
| 2025-08-05 | 13F | Bank Of Montreal /can/ | 60,163 | -1.50 | 753 | -14.06 | ||||
| 2025-08-07 | 13F | Zurcher Kantonalbank (Zurich Cantonalbank) | 59,346 | 12.03 | 742 | -2.24 | ||||
| 2025-08-13 | 13F | Russell Investments Group, Ltd. | 3,179,796 | -26.17 | 39,695 | -35.73 | ||||
| 2025-07-25 | 13F | Richardson Financial Services Inc. | 0 | -100.00 | 0 | |||||
| 2025-08-08 | 13F | Itau Unibanco Holding S.A. | Put | 0 | -100.00 | 0 | -100.00 | |||
| 2025-08-15 | 13F | Strategic Investment Advisors / MI | 17,296 | -5.38 | 216 | -17.56 | ||||
| 2025-07-21 | 13F | Ameritas Advisory Services, LLC | 304 | 4 | ||||||
| 2025-08-27 | NP | Brighthouse Funds Trust I - SSGA Emerging Markets Enhanced Index Portfolio Class B | 55,000 | 198.91 | 688 | 161.60 | ||||
| 2025-08-12 | 13F | Jpmorgan Chase & Co | Call | 1,100,000 | -39.59 | 13,761 | -47.30 | |||
| 2025-08-14 | 13F | CoreCommodity Management, LLC | 12,064 | 0.00 | 151 | -12.79 | ||||
| 2025-07-17 | 13F | Sonora Investment Management Group, LLC | 17,070 | 0.00 | 214 | -12.70 | ||||
| 2025-08-12 | 13F | Jpmorgan Chase & Co | Put | 1,177,500 | 6.80 | 14,731 | -6.83 | |||
| 2025-05-23 | NP | BGALX - Baillie Gifford Global Alpha Equities Fund Class 4 | 351,380 | 0.00 | 5,039 | 11.51 | ||||
| 2025-08-07 | 13F | Fidelis Capital Partners, LLC | 12,306 | 0.00 | 160 | 13.48 | ||||
| 2025-08-13 | 13F | Dodge & Cox | 30,400 | 7.04 | 380 | -6.63 | ||||
| 2025-08-12 | 13F | Jpmorgan Chase & Co | 9,333,230 | 20.33 | 116,759 | 4.98 | ||||
| 2025-08-25 | NP | AEPGX - EUROPACIFIC GROWTH FUND Class A | 7,277,197 | 75.95 | 91,038 | 112.88 | ||||
| 2025-08-25 | NP | AMERICAN FUNDS INSURANCE SERIES - International Growth and Income Fund Class 1 This fund is a listed as child fund of Capital World Investors and if that institution has disclosed ownership in this security, then these positions will not be double counted when calculating total shares and total value | 30,053 | 376 | ||||||
| 2025-08-07 | 13F | Nwam Llc | 26,688 | 345 | ||||||
| 2025-07-23 | 13F | Heck Capital Advisors, LLC | 0 | -100.00 | 0 | |||||
| 2025-08-06 | 13F | Stokes Family Office, LLC | 10,000 | 0.00 | 125 | -12.59 | ||||
| 2025-08-08 | 13F | Itau Unibanco Holding S.A. | Call | 0 | -100.00 | 0 | -100.00 | |||
| 2025-07-28 | NP | NSI - National Security Emerging Markets Index ETF | 7,098 | 38.42 | 82 | 19.12 | ||||
| 2025-06-26 | NP | FSGEX - Fidelity Series Global ex U.S. Index Fund This fund is a listed as child fund of Fmr Llc and if that institution has disclosed ownership in this security, then these positions will not be double counted when calculating total shares and total value | 9 | -99.99 | 0 | -100.00 | ||||
| 2025-08-25 | NP | IGAAX - International Growth and Income Fund Class A | 1,283,857 | 538.49 | 16,061 | 1,353.48 | ||||
| 2025-07-28 | 13F | Harbour Investments, Inc. | 2,379 | 0.63 | 30 | -12.12 | ||||
| 2025-08-13 | 13F | RWC Asset Management LLP | 1,959,567 | 6.79 | 24,514 | -6.84 | ||||
| 2025-05-09 | 13F | GeoWealth Management, LLC | 0 | -100.00 | 0 | |||||
| 2025-08-11 | 13F | FSA Wealth Management LLC | 68 | 1 | ||||||
| 2025-08-05 | 13F | Cherry Tree Wealth Management, LLC | 0 | -100.00 | 0 | |||||
| 2025-08-21 | NP | TIBAX - Thornburg Investment Income Builder Fund - Class A | 7,310,155 | 0.00 | 91,450 | -12.76 | ||||
| 2025-06-26 | NP | MSTSX - Morningstar Unconstrained Allocation Fund | 60,127 | -2.16 | 679 | -22.34 | ||||
| 2025-07-31 | 13F | ARGA Investment Management, LP | 11,036,110 | 0.00 | 138,062 | -12.76 | ||||
| 2025-08-13 | 13F | Capital International Inc /ca/ | 887,626 | 11,104 | ||||||
| 2025-08-13 | 13F | OMERS ADMINISTRATION Corp | 0 | -100.00 | 0 | |||||
| 2025-08-08 | 13F | JBF Capital, Inc. | 50,000 | 7.53 | 577 | -4.79 | ||||
| 2025-08-13 | 13F | Everstar Asset Management, LLC | 13,752 | 172 | ||||||
| 2025-07-28 | NP | TEMUX - Emerging Markets Equity Fund | 88,012 | -20.24 | 1,016 | -31.09 | ||||
| 2025-04-22 | 13F | Synergy Financial Management, LLC | 0 | -100.00 | 0 | |||||
| 2025-08-12 | 13F | SRS Capital Advisors, Inc. | 498 | 6 | ||||||
| 2025-08-14 | 13F | First Manhattan Co | 144,509 | -0.91 | 1,854 | -11.33 | ||||
| 2025-08-12 | 13F | Insigneo Advisory Services, Llc | 199,384 | 9.85 | 2,494 | -4.15 | ||||
| 2025-08-12 | 13F | Deutsche Bank Ag\ | 1,582,608 | -4.61 | 19,798 | -16.78 | ||||
| 2025-08-13 | 13F | West Family Investments, Inc. | 21,892 | 1.02 | 274 | -11.94 | ||||
| 2025-08-14 | 13F | Citadel Advisors Llc | Put | 1,034,800 | -8.26 | 12,945 | -19.97 | |||
| 2025-08-14 | 13F | Citadel Advisors Llc | 68,013 | -90.06 | 851 | -91.34 | ||||
| 2025-07-25 | NP | EEMAX - Columbia Emerging Markets Fund Class A | 534,812 | 116.85 | 6,172 | 87.45 | ||||
| 2025-08-13 | 13F | Capital International Sarl | 39,177 | 490 | ||||||
| 2025-08-07 | 13F | Hennion & Walsh Asset Management, Inc. | 36,653 | -23.97 | 459 | -33.72 | ||||
| 2025-08-14 | 13F | Citadel Advisors Llc | Call | 657,000 | -92.63 | 8,219 | -93.57 | |||
| 2025-05-15 | 13F | Platinum Investment Management Ltd | 0 | -100.00 | 0 | -100.00 | ||||
| 2025-08-13 | 13F | M&t Bank Corp | 30,012 | 138.34 | 375 | 108.33 | ||||
| 2025-08-14 | 13F | VPR Management LLC | 132,846 | 0.00 | 1,662 | -12.81 | ||||
| 2025-06-25 | NP | EMGAX - Wells Fargo Emerging Markets Equity Fund Class A | 522,079 | -7.12 | 5,894 | -26.21 | ||||
| 2025-07-11 | 13F | Annex Advisory Services, LLC | 1,856,898 | 2.11 | 23,230 | -10.92 | ||||
| 2025-07-31 | 13F | State of New Jersey Common Pension Fund D | 825,006 | -2.30 | 10,321 | -14.77 | ||||
| 2025-08-12 | 13F | Tocqueville Asset Management L.p. | 23,025 | -3.31 | 288 | -15.54 | ||||
| 2025-08-15 | 13F/A | Rakuten Securities, Inc. | 136,570 | 95.82 | 1,708 | 70.80 | ||||
| 2025-08-14 | 13F | CIBC World Markets Inc. | 55,551 | 16.50 | 695 | 1.61 | ||||
| 2025-08-07 | 13F | Rathbone Brothers plc | 11,110 | 139 | ||||||
| 2025-08-14 | 13F | IPG Investment Advisors LLC | 661,855 | 53.35 | 8,461 | 36.71 | ||||
| 2025-08-13 | 13F | Edgestream Partners, L.P. | 29,602 | 41.05 | 370 | 23.33 | ||||
| 2025-08-12 | 13F | MAI Capital Management | 4,947 | 164.83 | 62 | 134.62 | ||||
| 2025-08-19 | 13F | Advisory Services Network, LLC | 40,829 | 20.95 | 520 | 7.44 | ||||
| 2025-06-18 | NP | RTNAX - Tax-Managed International Equity Fund Class A | 572,426 | -35.05 | 6,463 | -48.40 | ||||
| 2025-07-14 | 13F | Ridgewood Investments LLC | Call | 16,000 | 12 | |||||
| 2025-07-09 | 13F | St. Louis Financial Planners Asset Management, LLC | 11,992 | -3.97 | 150 | -16.20 | ||||
| 2025-08-13 | 13F | Fairtree Asset Management (Pty) Ltd | 0 | -100.00 | 0 | |||||
| 2025-08-22 | NP | Fidelity Central Investment Portfolios LLC - Fidelity Emerging Markets Equity Central Fund This fund is a listed as child fund of Fmr Llc and if that institution has disclosed ownership in this security, then these positions will not be double counted when calculating total shares and total value | 425,800 | 1.70 | 5,327 | -11.29 | ||||
| 2025-08-21 | NP | MEMSX - Mercer Emerging Markets Equity Fund Class I | 298,861 | -34.51 | 3,739 | -42.87 | ||||
| 2025-08-14 | 13F | Ameriprise Financial Inc | 3,298,091 | 55.09 | 41,265 | 35.32 | ||||
| 2025-04-29 | NP | TAX - Cambria Tax Aware ETF | 876 | 12 | ||||||
| 2025-08-13 | 13F | Jump Financial, LLC | 1,813,746 | 22,690 | ||||||
| 2025-07-30 | NP | FGOMX - Strategic Advisers Fidelity Emerging Markets Fund This fund is a listed as child fund of Fmr Llc and if that institution has disclosed ownership in this security, then these positions will not be double counted when calculating total shares and total value | 5,542,396 | 54.52 | 63,959 | 33.57 | ||||
| 2025-07-28 | 13F | Moran Wealth Management, LLC | 438,047 | 8.01 | 5,480 | -5.78 | ||||
| 2025-08-14 | 13F | Ubs Asset Management Americas Inc | 7,636,325 | 11,246.69 | 95,530 | 9,799.48 | ||||
| 2025-06-26 | NP | HRLIX - The Hartford Global Real Asset Fund Class I | 35,708 | -32.89 | 403 | -46.69 | ||||
| 2025-08-14 | 13F | Quantitative Investment Management, LLC | 70,775 | 1 | ||||||
| 2025-08-04 | 13F | Arkadios Wealth Advisors | 16,711 | 46.32 | 209 | 28.22 | ||||
| 2025-08-11 | 13F | Citigroup Inc | Call | 280,000 | 0.00 | 3,503 | -12.78 | |||
| 2025-07-28 | NP | AVES - Avantis Emerging Markets Value ETF This fund is a listed as child fund of American Century Companies Inc and if that institution has disclosed ownership in this security, then these positions will not be double counted when calculating total shares and total value | 47,544 | 0.00 | 549 | -13.56 | ||||
| 2025-08-11 | 13F | Citigroup Inc | 685,339 | 109.84 | 8,574 | 83.07 | ||||
| 2025-08-11 | 13F | Citigroup Inc | Put | 620,000 | 0.00 | 7,756 | -12.76 | |||
| 2025-08-08 | 13F | Mitsubishi UFJ Trust & Banking Corp | 666,966 | -7.31 | 8,344 | -19.14 | ||||
| 2025-08-14 | 13F | CoreCap Advisors, LLC | 1,534 | 0.00 | 19 | -9.52 | ||||
| 2025-08-14 | 13F | RBF Capital, LLC | 120,000 | 0.00 | 1,501 | -12.73 | ||||
| 2025-08-05 | 13F | Fourth Dimension Wealth, LLC | 600 | 0.00 | 8 | -12.50 | ||||
| 2025-08-27 | NP | TPDAX - Timothy Plan Defensive Strategies Fund Class A | 12,064 | 0.00 | 151 | -12.79 | ||||
| 2025-08-28 | NP | GQJPX - GQG PARTNERS INTERNATIONAL QUALITY DIVIDEND INCOME FUND Investor Shares | 964,156 | 16.13 | 12,062 | 1.30 | ||||
| 2025-08-12 | 13F | Proequities, Inc. | 0 | 0 | ||||||
| 2025-08-07 | 13F | Acadian Asset Management Llc | 1,356,687 | 11,321.85 | 17 | |||||
| 2025-08-12 | 13F | Proequities, Inc. | Call | 0 | 0 | |||||
| 2025-08-14 | 13F | Bnp Paribas Arbitrage, Sa | Call | 11,797 | -46.51 | 14,758 | -53.34 | |||
| 2025-08-14 | 13F | Bnp Paribas Arbitrage, Sa | 1,043,445 | -39.86 | 13,053 | -47.54 | ||||
| 2025-08-14 | 13F | Bnp Paribas Arbitrage, Sa | Put | 9,971 | -63.40 | 12,474 | -68.07 | |||
| 2025-06-18 | NP | REMSX - Emerging Markets Fund Class S | 74,820 | 0.00 | 845 | -20.60 | ||||
| 2025-08-28 | NP | RWCIX - RWC Global Emerging Equity Fund Class I Shares | 399,399 | 31.80 | 4,996 | 14.98 | ||||
| 2025-08-14 | 13F | Peak6 Llc | Call | 1,038,700 | 27.92 | 12,994 | 11.59 | |||
| 2025-08-27 | 13F/A | Squarepoint Ops LLC | Call | 0 | -100.00 | 0 | -100.00 | |||
| 2025-08-06 | 13F | Vestmark Advisory Solutions, Inc. | 0 | -100.00 | 0 | |||||
| 2025-06-25 | NP | VRAI - Virtus Real Asset Income ETF | 10,995 | -3.31 | 124 | -22.98 | ||||
| 2025-08-04 | 13F | Atria Investments Llc | 27,814 | -16.73 | 348 | -27.41 | ||||
| 2025-08-11 | 13F | Covestor Ltd | 0 | -100.00 | 0 | |||||
| 2025-06-18 | NP | RTXAX - Tax-Managed Real Assets Fund Class A | 24,208 | 0.00 | 273 | -20.41 | ||||
| 2025-07-29 | NP | SEPIX - Energy & Basic Materials Portfolio Energy & Basic Materials Class I | 2,908 | -7.65 | 34 | -21.43 | ||||
| 2025-07-14 | 13F | Park Avenue Securities Llc | 16,919 | 0 | ||||||
| 2025-06-26 | NP | DFCEX - Emerging Markets Core Equity Portfolio - Institutional Class This fund is a listed as child fund of Dimensional Fund Advisors Lp and if that institution has disclosed ownership in this security, then these positions will not be double counted when calculating total shares and total value | 297,124 | -61.04 | 3,355 | -69.05 | ||||
| 2025-07-29 | NP | GIMFX - GMO Implementation Fund | 62 | -99.84 | 1 | -100.00 | ||||
| 2025-06-26 | NP | HFCVX - Hennessy Cornerstone Value Fund Investor Class | 398,900 | 0.00 | 4,504 | -20.55 | ||||
| 2025-08-18 | 13F | Wolverine Trading, Llc | Put | 85,000 | -44.95 | 1,052 | -52.61 | |||
| 2025-08-14 | 13F | State Street Corp | 5,330,598 | 3.25 | 68,377 | -7.64 | ||||
| 2025-08-18 | 13F | Wolverine Trading, Llc | 69,663 | 54.56 | 862 | 33.02 | ||||
| 2025-07-23 | 13F | Ameliora Wealth Management Ltd. | 4,000 | 0.00 | 50 | -12.28 | ||||
| 2025-07-25 | 13F | Atria Wealth Solutions, Inc. | 11,051 | 0.00 | 144 | -8.86 | ||||
| 2025-08-18 | 13F | Wolverine Trading, Llc | Call | 273,500 | 48.64 | 3,386 | 27.98 | |||
| 2025-05-16 | 13F/A | Kestra Investment Management, LLC | 0 | -100.00 | 0 | -100.00 | ||||
| 2025-08-14 | 13F | Banque Transatlantique SA | 0 | -100.00 | 0 | |||||
| 2025-07-29 | 13F | Private Trust Co Na | 0 | -100.00 | 0 | |||||
| 2025-08-12 | 13F | Longfellow Investment Management Co Llc | 210,216 | 0.00 | 2,630 | -12.77 | ||||
| 2025-07-15 | 13F | Fifth Third Bancorp | 49,554 | 0.72 | 620 | -12.20 | ||||
| 2025-08-11 | 13F | WPG Advisers, LLC | 144 | 0.00 | 2 | -50.00 | ||||
| 2025-08-13 | 13F | GQG Partners LLC | 221,361,832 | -13.56 | 2,769,237 | -24.59 | ||||
| 2025-08-14 | 13F | Raymond James Financial Inc | 447,104 | 21.64 | 5,593 | 6.13 | ||||
| 2025-08-26 | NP | EQ ADVISORS TRUST - EQ/Emerging Markets Equity PLUS Portfolio Class IB | 27,229 | -1.73 | 341 | -14.36 | ||||
| 2025-07-31 | 13F | Whipplewood Advisors, LLC | 2,875 | 45.72 | 36 | 2.94 | ||||
| 2025-06-26 | NP | HFIGX - Hartford Schroders Diversified Growth Fund Class I | 4,063 | 30.81 | 46 | 2.27 | ||||
| 2025-08-12 | 13F | Trexquant Investment LP | 655,875 | 8,205 | ||||||
| 2025-08-14 | 13F | Mml Investors Services, Llc | 52,422 | -24.15 | 1 | |||||
| 2025-08-15 | 13F | WealthCollab, LLC | 1,324 | 0.00 | 17 | -11.11 | ||||
| 2025-05-13 | 13F | Mondrian Investment Partners LTD | 9,255,391 | -0.97 | 132,722 | -0.07 | ||||
| 2025-07-31 | 13F | Nisa Investment Advisors, Llc | 2,200 | -12.00 | 28 | -22.86 | ||||
| 2025-07-25 | 13F | Hazlett, Burt & Watson, Inc. | 974 | 0 | ||||||
| 2025-08-14 | 13F | Parkwood LLC | 1,485,340 | 220.22 | 19 | 200.00 | ||||
| 2025-08-13 | 13F | Mackenzie Financial Corp | 122,000 | -90.19 | 1,526 | -91.44 | ||||
| 2025-08-14 | 13F | Ieq Capital, Llc | 32,098 | 77.68 | 402 | 54.83 | ||||
| 2025-08-19 | 13F | Cape Investment Advisory, Inc. | 100 | 0.00 | 1 | 0.00 | ||||
| 2025-05-05 | 13F | Creekmur Asset Management LLC | 0 | -100.00 | 0 | |||||
| 2025-06-27 | NP | DAINX - Dunham International Stock Fund Class A | 84,063 | -27.23 | 949 | -42.17 | ||||
| 2025-08-13 | 13F | EverSource Wealth Advisors, LLC | 2,704 | 108.48 | 34 | 83.33 | ||||
| 2025-05-15 | 13F | DZ BANK AG Deutsche Zentral Genossenschafts Bank, Frankfurt am Main | 0 | -100.00 | 0 | |||||
| 2025-08-13 | 13F | New York State Common Retirement Fund | 2,234,730 | 6.88 | 28 | -6.90 | ||||
| 2025-08-07 | 13F | Parkside Financial Bank & Trust | 1,169 | -32.00 | 15 | -41.67 | ||||
| 2025-06-30 | NP | CVY - Invesco Zacks Multi-Asset Income ETF This fund is a listed as child fund of Invesco Ltd. and if that institution has disclosed ownership in this security, then these positions will not be double counted when calculating total shares and total value | 78,708 | 889 | ||||||
| 2025-08-25 | NP | EMRGX - EMERGING MARKETS GROWTH FUND INC Class M | 95,534 | -19.53 | 1,195 | 18.79 | ||||
| 2025-08-12 | 13F | Proequities, Inc. | Put | 0 | 0 | |||||
| 2025-06-25 | NP | IEMGX - Voya Multi-Manager Emerging Markets Equity Fund Class I | 138,536 | 0.00 | 1,564 | -20.53 | ||||
| 2025-05-14 | 13F | Virtus ETF Advisers LLC | 0 | -100.00 | 0 | |||||
| 2025-07-30 | NP | BRAZ - Global X Brazil Active ETF | 50,488 | 103.15 | 583 | 75.83 | ||||
| 2025-08-14 | 13F | Driehaus Capital Management Llc | 0 | -100.00 | 0 | |||||
| 2025-06-30 | NP | VEU - Vanguard FTSE All-World ex-US Index Fund ETF Shares | 995,895 | 0.00 | 11,244 | -20.55 | ||||
| 2025-08-14 | 13F | Colony Group, LLC | 18,325 | -11.18 | 229 | -22.37 | ||||
| 2025-08-14 | 13F | UBS Group AG | 4,598,810 | 46.76 | 57,531 | 28.03 | ||||
| 2025-08-08 | 13F | Crossmark Global Holdings, Inc. | 84,156 | 3.61 | 1,053 | -9.62 | ||||
| 2025-06-26 | NP | DFEM - Dimensional Emerging Markets Core Equity 2 ETF | 77,872 | 0.00 | 879 | -20.52 | ||||
| 2025-08-15 | 13F | Binnacle Investments Inc | 672 | 4.84 | 8 | -11.11 | ||||
| 2025-08-29 | NP | Gabelli Dividend & Income Trust | 25,000 | 0.00 | 313 | -12.85 | ||||
| 2025-08-14 | 13F | UBS Group AG | Call | 7,445,940 | 19.82 | 93,149 | 4.53 | |||
| 2025-08-14 | 13F | UBS Group AG | Put | 2,590,900 | -19.94 | 32,412 | -30.15 | |||
| 2025-08-13 | 13F | Quantbot Technologies LP | 45,578 | -78.80 | 570 | -81.51 | ||||
| 2025-08-28 | NP | CSNR - Cohen & Steers Natural Resources Active ETF | 13,840 | 103.74 | 173 | 78.35 | ||||
| 2025-06-25 | NP | VVIFX - Voya VACS Series EME Fund | 172,150 | 0.00 | 1,944 | -20.56 | ||||
| 2025-06-26 | NP | SEMVX - Hartford Schroders Emerging Markets Equity Fund Class A | 4,342,982 | -26.89 | 49,032 | -41.92 | ||||
| 2025-08-12 | 13F | Ci Investments Inc. | 1,743,362 | 7.66 | 22 | -8.70 | ||||
| 2025-07-22 | 13F | Chung Wu Investment Group, LLC | 2,500 | 31 | ||||||
| 2025-07-18 | 13F | Bartlett & Co. Wealth Management Llc | 62 | 1 | ||||||
| 2025-08-15 | 13F | Tower Research Capital LLC (TRC) | 8,581 | 1,900.23 | 107 | 1,683.33 | ||||
| 2025-07-09 | 13F | Sapient Capital Llc | 14,743 | 1.29 | 189 | -9.13 | ||||
| 2025-08-05 | 13F | GHP Investment Advisors, Inc. | 0 | -100.00 | 0 | |||||
| 2025-07-29 | 13F | International Assets Investment Management, Llc | 11,534 | -11.71 | 144 | -22.99 | ||||
| 2025-08-14 | 13F | Aprio Wealth Management, LLC | 16,512 | 0.71 | 207 | -12.34 | ||||
| 2025-05-27 | NP | DREGX - DRIEHAUS EMERGING MARKETS GROWTH FUND Investor Share Class | 1,698,859 | -16.73 | 24,362 | -7.14 | ||||
| 2025-07-18 | 13F | Generali Investments CEE, investicni spolecnost, a.s. | 92,900 | 60.45 | 1,162 | 40.00 | ||||
| 2025-08-12 | 13F | Barings Llc | 73,545 | 0.00 | 920 | -12.71 | ||||
| 2025-06-26 | NP | DAADX - Emerging Markets ex China Core Equity Portfolio Institutional Class | 37,001 | 0.00 | 418 | -20.57 | ||||
| 2025-08-13 | 13F | Rsm Us Wealth Management Llc | 13,571 | 1.92 | 170 | -11.05 | ||||
| 2025-08-07 | 13F | Samalin Investment Counsel, LLC | 0 | -100.00 | 0 | |||||
| 2025-07-11 | 13F | Farther Finance Advisors, LLC | 25,491 | -25.71 | 319 | -35.89 | ||||
| 2025-08-14 | 13F | Breakout Capital Partners, LP | 1,172,682 | 0.00 | 14,670 | -12.76 | ||||
| 2025-08-13 | 13F | Renaissance Technologies Llc | 10,002,800 | 54.44 | 125,135 | 34.73 | ||||
| 2025-05-16 | 13F | Coppell Advisory Solutions LLC | 0 | -100.00 | 0 | |||||
| 2025-08-14 | 13F | Jain Global LLC | 55,655 | 696 | ||||||
| 2025-08-14 | 13F/A | Bank Julius Baer & Co. Ltd, Zurich | 170,000 | 13.02 | 2,127 | -12.76 | ||||
| 2025-08-14 | 13F | Wellington Management Group Llp | 696,155 | 4.41 | 8,709 | -8.92 | ||||
| 2025-07-21 | 13F | Ascent Group, LLC | 15,492 | -2.23 | 194 | -14.98 | ||||
| 2025-08-14 | 13F | GWM Advisors LLC | 18,792 | 797.85 | 235 | 683.33 | ||||
| 2025-08-12 | 13F | Coldstream Capital Management Inc | 0 | -100.00 | 0 | |||||
| 2025-04-09 | 13F | JTC Employer Solutions Trusteee Ltd | 0 | -100.00 | 0 | |||||
| 2025-08-14 | 13F | Evergreen Capital Management Llc | 71,248 | 565.25 | 895 | 484.97 | ||||
| 2025-07-18 | 13F | Union Bancaire Privee, UBP SA | 34,813 | 0.00 | 431 | -13.80 | ||||
| 2025-08-13 | 13F | Quadrant Capital Group Llc | 38,774 | 93.61 | 485 | 68.99 | ||||
| 2025-05-14 | 13F | Credit Agricole S A | 2,003,659 | 6.02 | 28,732 | 18.22 | ||||
| 2025-08-08 | 13F | D'Orazio & Associates, Inc. | 14,461 | 20.14 | 181 | 4.65 | ||||
| 2025-07-30 | 13F | Whittier Trust Co Of Nevada Inc | 50,345 | 44.76 | 630 | 26.31 | ||||
| 2025-08-15 | 13F | Kestra Advisory Services, LLC | 29,453 | 33.52 | 368 | 16.46 | ||||
| 2025-08-28 | NP | GQFPX - GQG PARTNERS GLOBAL QUALITY DIVIDEND INCOME FUND Investor Shares | 440,928 | 15.17 | 5,516 | 0.49 | ||||
| 2025-08-08 | 13F | Gts Securities Llc | 0 | -100.00 | 0 | |||||
| 2025-08-13 | 13F | Capital International Investors | 17,619,209 | 220,416 | ||||||
| 2025-08-12 | 13F | Zacks Investment Management | 10,323 | 0.00 | 129 | -12.84 | ||||
| 2025-08-13 | 13F | Level Four Advisory Services, Llc | 38,411 | 16.18 | 481 | 1.27 | ||||
| 2025-08-11 | 13F | United Capital Financial Advisers, Llc | 19,866 | -32.24 | 249 | -40.95 | ||||
| 2025-08-14 | 13F | Aspen Grove Capital, LLC | 13,212 | -15.77 | 170 | -24.55 | ||||
| 2025-07-11 | 13F | Perpetual Ltd | 3,261,657 | 1.51 | 40,803 | -11.45 | ||||
| 2025-07-31 | 13F | University Of Texas/texas Am Investment Managment Co | 0 | -100.00 | 0 | |||||
| 2025-08-11 | 13F | HHM Wealth Advisors, LLC | 500 | 0.00 | 6 | -14.29 | ||||
| 2025-08-04 | 13F | Hantz Financial Services, Inc. | 12,581 | 688.78 | 0 | |||||
| 2025-08-14 | 13F | Nfj Investment Group, Llc | 130 | -99.45 | 2 | -99.71 | ||||
| 2025-08-25 | NP | MMIUX - MassMutual Select T. Rowe Price International Equity Fund Class I | 15,426 | -32.71 | 193 | -41.46 | ||||
| 2025-07-08 | 13F | Parallel Advisors, LLC | 31,510 | -3.30 | 394 | -15.63 | ||||
| 2025-07-21 | 13F | Qrg Capital Management, Inc. | 43,258 | -15.69 | 541 | -26.39 | ||||
| 2025-08-12 | 13F | Aigen Investment Management, Lp | 0 | -100.00 | 0 | |||||
| 2025-08-11 | 13F | Vanguard Group Inc | 1,184,605 | 0.75 | 14,819 | -12.11 | ||||
| 2025-05-27 | NP | Brighthouse Funds Trust I - Brighthouse/Aberdeen Emerging Markets Equity Portfolio Class A | 36,600 | 0.00 | 525 | 11.49 | ||||
| 2025-08-13 | 13F | Victory Financial Group, Llc | 18,045 | 6.15 | 226 | -7.41 | ||||
| 2025-08-14 | 13F | Optiver Holding B.V. | Call | 87,300 | -98.95 | 1,007 | -99.07 | |||
| 2025-08-14 | 13F | Optiver Holding B.V. | Put | 141,300 | 42.15 | 1,631 | 25.77 | |||
| 2025-08-15 | 13F | Earnest Partners Llc | 3,206,568 | -1.12 | 40,114 | -13.74 | ||||
| 2025-08-14 | 13F | Optiver Holding B.V. | 5,814,209 | 19.75 | 72,736 | 4.47 | ||||
| 2025-05-09 | 13F | Vision Financial Markets Llc | 0 | -100.00 | 0 | |||||
| 2025-08-12 | 13F | one8zero8, LLC | 81,439 | 19.06 | 1,019 | 3.88 | ||||
| 2025-03-17 | NP | ABLG - TrimTabs All Cap International Free-Cash-Flow ETF | 121,361 | 137.78 | 1,725 | 151.31 | ||||
| 2025-07-23 | 13F | Sachetta, LLC | 5,100 | 142.86 | 64 | 110.00 | ||||
| 2025-07-29 | 13F | Foster & Motley Inc | 109,706 | -4.48 | 1 | 0.00 | ||||
| 2025-06-26 | NP | EEMGX - MFS Emerging Markets Equity Research Fund R4 | 784 | -50.00 | 9 | -63.64 | ||||
| 2025-05-15 | 13F | Integrated Quantitative Investments LLC | 0 | -100.00 | 0 | |||||
| 2025-07-25 | NP | MEMAX - MFS Emerging Markets Equity Fund A | 6,755,502 | 1.22 | 77,958 | -12.50 | ||||
| 2025-08-08 | NP | QGBLX - Quantified Global Fund Investor Class | 127,250 | 4,896.07 | 1,592 | 4,871.88 | ||||
| 2025-08-13 | 13F | Congress Wealth Management LLC / DE / | 33,966 | -2.44 | 425 | -14.86 | ||||
| 2025-08-07 | 13F | NS Partners Ltd | 0 | -100.00 | 0 | |||||
| 2025-08-12 | 13F | Wayfinding Financial, LLC | 0 | -100.00 | 0 | |||||
| 2025-08-28 | NP | Principal Diversified Select Real Asset Fund | 3,043 | 1.87 | 38 | -9.52 | ||||
| 2025-07-14 | 13F | UMA Financial Services, Inc. | 63 | 1 | ||||||
| 2025-07-30 | NP | LENS - Sarmaya Thematic ETF | 6,120 | 54.55 | 71 | 34.62 | ||||
| 2025-08-06 | 13F | Baillie Gifford & Co | 40,397,064 | -21.94 | 505,367 | -31.90 | ||||
| 2025-08-11 | 13F | Rwc Asset Advisors (us) Llc | 4,743,523 | 3.39 | 59,341 | -9.81 | ||||
| 2025-07-23 | 13F | Prime Capital Investment Advisors, LLC | 101,155 | 12.03 | 1,265 | -2.24 | ||||
| 2025-08-12 | 13F | Steward Partners Investment Advisory, Llc | 113,360 | 3.77 | 1,418 | -9.45 | ||||
| 2025-08-01 | 13F | Bessemer Group Inc | 14,415 | 0.00 | 0 | |||||
| 2025-08-13 | 13F | Blueshift Asset Management, LLC | 23,470 | 294 | ||||||
| 2025-08-01 | 13F | Financial Counselors Inc | 0 | -100.00 | 0 | |||||
| 2025-07-28 | 13F | BRYN MAWR TRUST Co | 3,672 | -6.56 | 46 | -19.64 | ||||
| 2025-08-01 | 13F | Redwood Park Advisors LLC | 4,248 | 14.72 | 53 | 0.00 | ||||
| 2025-07-15 | 13F | Td Private Client Wealth Llc | 20,086 | 15.31 | 251 | 0.80 | ||||
| 2025-08-12 | 13F | Park Square Financial Group, LLC | 243 | -61.79 | 3 | -66.67 | ||||
| 2025-08-07 | 13F | Capital Wealth Planning, LLC | 255,950 | -17.47 | 3,202 | -28.02 | ||||
| 2025-08-13 | 13F | Hudson Portfolio Management LLC | 18,850 | 0.00 | 236 | -12.96 | ||||
| 2025-08-14 | 13F | Aqr Capital Management Llc | 101,053 | -14.32 | 1,264 | -25.25 | ||||
| 2025-08-07 | 13F | Summit X, LLC | 0 | -100.00 | 0 | |||||
| 2025-07-30 | 13F | Blume Capital Management, Inc. | 50 | 1 | ||||||
| 2025-08-14 | 13F | Engineers Gate Manager LP | 88,617 | -22.26 | 1,109 | -32.19 | ||||
| 2025-08-13 | 13F | HAP Trading, LLC | Put | 10,500 | -16.67 | 4 | -40.00 | |||
| 2025-08-13 | 13F | HAP Trading, LLC | Call | 12,100 | -16.55 | 9 | -68.00 | |||
| 2025-08-08 | 13F | Larson Financial Group LLC | 3,000 | 200.00 | 38 | 164.29 | ||||
| 2025-05-14 | 13F | Capula Management Ltd | 0 | -100.00 | 0 | |||||
| 2025-07-18 | 13F | Deltec Asset Management Llc | 65,000 | 0.00 | 813 | -12.77 | ||||
| 2025-07-23 | 13F | Abel Hall, LLC | 15,500 | 194 | ||||||
| 2025-08-14 | 13F | Susquehanna International Group, Llp | 1,121,430 | -76.65 | 14,029 | -79.63 | ||||
| 2025-06-23 | 13F | RK Capital Management, LLC/FL | Put | 0 | -100.00 | 0 | -100.00 | |||
| 2025-06-23 | 13F | RK Capital Management, LLC/FL | 0 | -100.00 | 0 | -100.00 | ||||
| 2025-08-05 | 13F | Prosperity Consulting Group, LLC | 0 | -100.00 | 0 | |||||
| 2025-05-14 | 13F | Capula Management Ltd | Put | 0 | -100.00 | 0 | ||||
| 2025-03-24 | NP | NABAX - Neuberger Berman Absolute Return Multi-Manager Fund Class A | 4,913 | 16.73 | 70 | 16.95 | ||||
| 2025-08-14 | 13F | Verition Fund Management LLC | 433,881 | 113.80 | 5,428 | 86.49 | ||||
| 2025-08-14 | 13F | Sei Investments Co | 1,829,737 | 9.37 | 22,890 | -4.59 | ||||
| 2025-08-15 | 13F | Morgan Stanley | 8,687,560 | -12.49 | 108,681 | -23.66 | ||||
| 2025-08-14 | 13F | Point72 Hong Kong Ltd | 0 | -100.00 | 0 | |||||
| 2025-08-14 | 13F | Susquehanna International Group, Llp | Call | 4,597,000 | 11.57 | 57,508 | -2.67 | |||
| 2025-08-14 | 13F | Susquehanna International Group, Llp | Put | 7,707,000 | -17.86 | 96,415 | -28.34 | |||
| 2025-08-08 | 13F | Intrua Financial, LLC | 25,494 | 50.41 | 319 | 30.86 | ||||
| 2025-08-08 | 13F | Avantax Advisory Services, Inc. | 186,259 | 29.26 | 2,330 | 12.78 | ||||
| 2025-08-12 | 13F | Archer Investment Corp | 122 | 1.67 | 2 | 0.00 | ||||
| 2025-08-14 | 13F | Graham Capital Management, L.P. | 42,461 | 13.40 | 531 | -0.93 | ||||
| 2025-08-25 | 13F/A | Neuberger Berman Group LLC | 124,471 | 8.20 | 1,557 | -5.58 | ||||
| 2025-06-30 | NP | VMMSX - Vanguard Emerging Markets Select Stock Fund Investor Shares | 547,866 | -2.76 | 6,185 | -22.74 | ||||
| 2025-08-14 | 13F | Wells Fargo & Company/mn | Put | 0 | -100.00 | 0 | -100.00 | |||
| 2025-08-13 | 13F | Kilter Group LLC | 113 | 1 | ||||||
| 2025-07-10 | 13F | Perkins Coie Trust Co | 0 | -100.00 | 0 | |||||
| 2025-08-11 | 13F | Private Advisor Group, LLC | 189,225 | 0.89 | 2,367 | -11.97 | ||||
| 2025-07-28 | 13F | Sagespring Wealth Partners, Llc | 10,818 | -12.67 | 135 | -23.73 | ||||
| 2025-08-14 | 13F | Kerrisdale Advisers, LLC | 111,126 | 0.00 | 1,390 | -12.74 | ||||
| 2025-08-14 | 13F | USS Investment Management Ltd | 894,094 | 0.00 | 11,190 | -12.70 | ||||
| 2025-05-13 | 13F | Ethos Financial Group, LLC | 0 | -100.00 | 0 | |||||
| 2025-07-25 | NP | USEMX - Emerging Markets Fund Shares | 348,204 | -3.27 | 4,018 | -16.38 | ||||
| 2025-08-14 | 13F | Price T Rowe Associates Inc /md/ | 5,759,116 | -28.80 | 72 | -37.39 | ||||
| 2025-08-06 | 13F | Metis Global Partners, LLC | 91,717 | 26.77 | 1,147 | 10.61 | ||||
| 2025-08-05 | 13F | Simplex Trading, Llc | Put | 931,900 | -39.47 | 12 | -50.00 | |||
| 2025-08-05 | 13F | Simplex Trading, Llc | 15,660 | -96.76 | 0 | -100.00 | ||||
| 2025-08-05 | 13F | Simplex Trading, Llc | Call | 811,300 | -19.47 | 10 | -28.57 | |||
| 2025-08-18 | 13F | Hollencrest Capital Management | 28 | 0.00 | 0 | |||||
| 2025-06-26 | NP | FTCEX - Fidelity Total International Equity Fund Fidelity Advisor Total International Equity Fund: Class C This fund is a listed as child fund of Fmr Llc and if that institution has disclosed ownership in this security, then these positions will not be double counted when calculating total shares and total value | 190,282 | 101.61 | 2,148 | 60.18 | ||||
| 2025-05-14 | 13F | Van Hulzen Asset Management, LLC | 0 | -100.00 | 0 | |||||
| 2025-08-11 | 13F | Hexagon Capital Partners LLC | 0 | -100.00 | 0 | |||||
| 2025-08-14 | 13F | Transamerica Financial Advisors, Inc. | 0 | -100.00 | 0 | |||||
| 2025-07-22 | 13F | Cullinan Associates Inc | 33,200 | 0.00 | 415 | -12.82 | ||||
| 2025-07-17 | 13F | Archford Capital Strategies, LLC | 46,806 | 586 | ||||||
| 2025-08-04 | 13F | Spire Wealth Management | 6,062 | 1.75 | 76 | -11.76 | ||||
| 2025-08-05 | 13F | Wellington Shields & Co., LLC | 130 | 0.00 | 2 | 0.00 | ||||
| 2025-08-14 | 13F | Glenorchy Capital Ltd | 43,979 | 0.78 | 550 | -12.00 | ||||
| 2025-08-14 | 13F | Point72 Europe (London) LLP | 1,281,159 | 95.94 | 16,027 | 70.94 | ||||
| 2025-08-14 | 13F | Two Sigma Advisers, Lp | 56,800 | -33.25 | 711 | -41.80 | ||||
| 2025-08-13 | 13F | Gabelli Funds Llc | 35,000 | 0.00 | 438 | -12.77 | ||||
| 2025-07-29 | 13F | Arista Wealth Management, LLC | 13,000 | 163 | ||||||
| 2025-08-25 | NP | EMEQ - Macquarie Focused Emerging Markets Equity ETF | 29,166 | 0.00 | 365 | -12.92 | ||||
| 2025-08-13 | 13F | Natixis | 177,706 | 2,223 | ||||||
| 2025-08-14 | 13F/A | Barclays Plc | 657,962 | 8.88 | 8 | 0.00 | ||||
| 2025-08-08 | 13F | Cetera Investment Advisers | 214,258 | -24.18 | 2,680 | -33.86 | ||||
| 2025-06-26 | NP | SNTKX - Steward International Enhanced Index Fund Class A | 25,860 | 0.00 | 292 | -20.71 | ||||
| 2025-07-24 | 13F | Ronald Blue Trust, Inc. | 31,834 | 7.19 | 398 | -6.35 | ||||
| 2025-07-24 | 13F | Standard Life Aberdeen plc | 288,571 | -0.64 | 3,610 | -13.30 | ||||
| 2025-08-14 | 13F | Hrt Financial Lp | 314,827 | 4 | ||||||
| 2025-07-21 | 13F | Hennessy Advisors Inc | 398,900 | 0.00 | 4,990 | -12.76 | ||||
| 2025-08-13 | 13F | Lumbard & Kellner, LLC | 507,838 | -1.60 | 6,353 | -14.15 | ||||
| 2025-05-15 | 13F | Barclays Plc | Put | 0 | -100.00 | 0 | -100.00 | |||
| 2025-08-08 | 13F | Massachusetts Financial Services Co /ma/ | 13,003,735 | 33.85 | 162,677 | 16.77 | ||||
| 2025-08-27 | NP | FAIEX - PFM Multi-Manager International Equity Fund Institutional Class | 77,359 | 1.17 | 968 | -11.77 | ||||
| 2025-07-11 | 13F/A | Umb Bank N A/mo | 1,200 | -11.57 | 15 | -21.05 | ||||
| 2025-08-07 | 13F | Connor, Clark & Lunn Investment Management Ltd. | 402,967 | 5,041 | ||||||
| 2025-08-07 | 13F | Traynor Capital Management, Inc. | 0 | -100.00 | 0 | |||||
| 2025-05-06 | 13F | Advisors Preferred, LLC | 0 | -100.00 | 0 | |||||
| 2025-07-30 | NP | FSAMX - Strategic Advisers Emerging Markets Fund This fund is a listed as child fund of Fmr Llc and if that institution has disclosed ownership in this security, then these positions will not be double counted when calculating total shares and total value | 2,804,900 | 0.11 | 32,369 | -13.46 | ||||
| 2025-08-08 | 13F | Wealth Alliance | 22,943 | -4.27 | 287 | -16.33 | ||||
| 2025-08-11 | 13F | HighTower Advisors, LLC | 90,550 | -73.69 | 1,133 | -77.06 | ||||
| 2025-07-18 | 13F | Robeco Institutional Asset Management B.V. | 5,843,804 | 6.79 | 73,106 | -6.84 | ||||
| 2025-08-13 | 13F | Pictet Asset Management Holding SA | 847,208 | 34.75 | 10,599 | 17.56 | ||||
| 2025-07-21 | 13F | Mirae Asset Global Investments Co., Ltd. | 97,988 | 3.83 | 1,226 | -9.66 | ||||
| 2025-06-23 | NP | UUPIX - Ultraemerging Markets Profund Investor Class | 7,665 | 9.23 | 87 | -13.13 | ||||
| 2025-08-13 | 13F | Victory Capital Management Inc | 147,871 | -90.53 | 1,850 | -91.74 | ||||
| 2025-07-22 | 13F | Net Worth Advisory Group | 13,700 | -1.04 | 171 | -13.64 | ||||
| 2025-07-31 | 13F | Caitong International Asset Management Co., Ltd | 36,592 | 64,096.49 | 458 | |||||
| 2025-08-08 | 13F | Itau Unibanco Holding S.A. | 5,664,002 | -7.86 | 70,857 | 82,290.70 | ||||
| 2025-08-13 | 13F | Invesco Ltd. | 11,034,592 | 401.28 | 138,043 | 337.31 | ||||
| 2025-04-30 | 13F | Stratos Wealth Partners, LTD. | 0 | -100.00 | 0 |