Mga Batayang Estadistika
| Pemilik Institusional | 301 total, 283 long only, 1 short only, 17 long/short - change of 15.71% MRQ |
| Alokasi Portofolio Rata-rata | 0.5205 % - change of 7.17% MRQ |
| Saham Institusional (Jangka Panjang) | 46,980,586 (ex 13D/G) - change of 8.46MM shares 21.97% MRQ |
| Nilai Institusional (Jangka Panjang) | $ 3,091,904 USD ($1000) |
Kepemilikan Institusional dan Pemegang Saham
iShares, Inc. - iShares MSCI South Korea ETF (US:EWY) memiliki 301 pemilik institusional dan pemegang saham yang telah mengajukan formulir 13D/G atau 13F kepada Komisi Bursa Efek (Securities Exchange Commission/SEC). Lembaga-lembaga ini memegang total 46,980,586 saham. Pemegang saham terbesar meliputi State of Tennessee, Treasury Department, Bank Of America Corp /de/, Morgan Stanley, Owl Creek Asset Management, L.P., PointState Capital LP, Susquehanna International Group, Llp, Sun Life Financial Inc, Bridgewater Associates, LP, Citigroup Inc, and Arrowstreet Capital, Limited Partnership .
Struktur kepemilikan institusional iShares, Inc. - iShares MSCI South Korea ETF (ARCA:EWY) menunjukkan posisi terkini di perusahaan oleh institusi dan dana, serta perubahan terbaru dalam ukuran posisi. Pemegang saham utama dapat mencakup investor individu, reksa dana, dana lindung nilai, atau institusi. Jadwal 13D menunjukkan bahwa investor memegang (atau pernah memegang) lebih dari 5% saham perusahaan dan bermaksud (atau pernah bermaksud) untuk secara aktif mengejar perubahan strategi bisnis. Jadwal 13G menunjukkan investasi pasif lebih dari 5%.
The share price as of September 5, 2025 is 73.63 / share. Previously, on September 9, 2024, the share price was 61.65 / share. This represents an increase of 19.43% over that period.

Skor Sentimen Dana
Skor Sentimen Dana (sebelumnya dikenal sebagai Skor Akumulasi Kepemilikan) menemukan saham-saham yang paling banyak dibeli oleh dana. Ini adalah hasil dari model kuantitatif multi-faktor yang canggih yang mengidentifikasi perusahaan dengan tingkat akumulasi institusional tertinggi. Model penilaian menggunakan kombinasi dari total peningkatan pemilik yang diungkapkan, perubahan dalam alokasi portofolio pada pemilik tersebut, dan metrik lainnya. Angka berkisar dari 0 hingga 100, dengan angka yang lebih tinggi menunjukkan tingkat akumulasi yang lebih tinggi dibandingkan dengan perusahaan sejenisnya, dan 50 adalah rata-ratanya.
Frekuensi Pembaruan: Setiap Hari
Lihat Ownership Explorer, yang menyediakan daftar perusahaan dengan peringkat tertinggi.
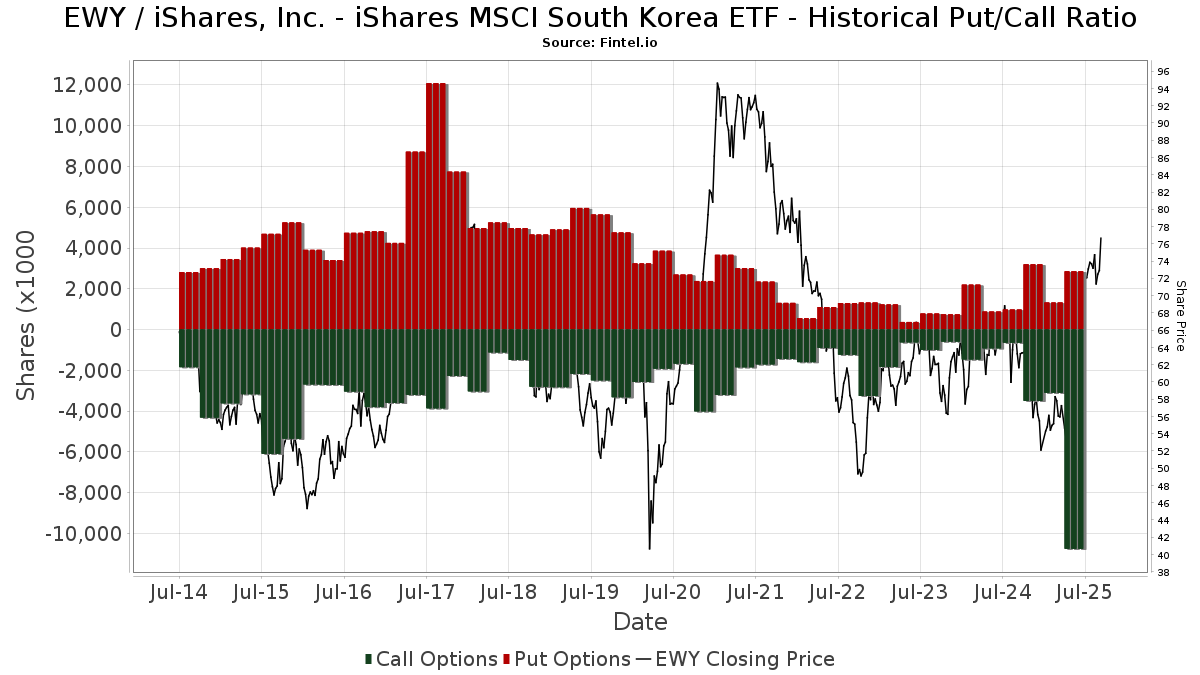
Rasio Put/Call Institusional
Selain melaporkan isu ekuitas dan utang standar, institusi dengan aset di bawah manajemen lebih dari 100 juta dolar AS juga harus mengungkapkan kepemilikan opsi put dan call mereka. Karena opsi put umumnya menunjukkan sentimen negatif, dan opsi call menunjukkan sentimen positif, kita dapat mengetahui sentimen institusional secara keseluruhan dengan memplot rasio put terhadap call. Grafik di sebelah kanan memplot rasio put/call historis untuk instrumen ini.
Menggunakan Rasio Put/Call sebagai indikator sentimen investor mengatasi salah satu kekurangan utama dari penggunaan total kepemilikan institusional, yaitu sejumlah besar aset yang dikelola diinvestasikan secara pasif untuk melacak indeks. Dana yang dikelola secara pasif biasanya tidak membeli opsi, sehingga indikator rasio put/call lebih akurat dalam melacak sentimen dana yang dikelola secara aktif.
Pengajuan 13F dan NPORT
Detail pada pengajuan 13F tersedia gratis. Detail pada pengajuan NP memerlukan keanggotaan premium. Baris berwarna hijau menunjukkan posisi baru. Baris berwarna merah menunjukkan posisi yang sudah ditutup. Klik tautan ini ikon untuk melihat riwayat transaksi selengkapnya.
Tingkatkan
untuk membuka data premium dan mengekspor ke Excel ![]() .
.
| Tanggal File | Sumber | Investor | Ketik | Presyo ng Avg (Silangan) |
Saham | Δ Saham (%) |
Dilaporkan Nilai ($1000) |
Nilai Δ (%) |
Alokasi Port (%) |
|
|---|---|---|---|---|---|---|---|---|---|---|
| 2025-07-30 | 13F | Cullen/frost Bankers, Inc. | 15 | 0.00 | 1 | |||||
| 2025-08-14 | 13F | BTG Pactual Asset Management US LLC | 2,291 | -27.68 | 164 | -4.09 | ||||
| 2025-08-12 | 13F | Prudential Financial Inc | 19,000 | 18.75 | 1,364 | 57.75 | ||||
| 2025-08-13 | 13F | Custom Index Systems, Llc | 4,023 | 289 | ||||||
| 2025-06-27 | 13F/A | Goldman Sachs Group Inc | Call | 0 | -100.00 | 0 | -100.00 | |||
| 2025-08-13 | 13F | Capital Analysts, Inc. | 348 | -14.50 | 0 | |||||
| 2025-08-14 | 13F | Raymond James Financial Inc | 62,627 | 19.13 | 4,495 | 58.27 | ||||
| 2025-08-11 | 13F | Trium Capital LLP | 374,732 | 26,898 | ||||||
| 2025-08-14 | 13F | LMR Partners LLP | 61,232 | 0.00 | 4,395 | 32.86 | ||||
| 2025-08-14 | 13F | Fmr Llc | 514,264 | -0.00 | 36,914 | 32.83 | ||||
| 2025-08-14 | 13F | DZ BANK AG Deutsche Zentral Genossenschafts Bank, Frankfurt am Main | 58,908 | 4,228 | ||||||
| 2025-07-24 | 13F | Lmcg Investments, Llc | 55,463 | -4.33 | 3,981 | 27.07 | ||||
| 2025-08-13 | 13F | Northwestern Mutual Wealth Management Co | 34 | 70.00 | 2 | 100.00 | ||||
| 2025-08-14 | 13F | Ancora Advisors, LLC | 18 | 0.00 | 1 | |||||
| 2025-05-14 | 13F | Walleye Trading LLC | 0 | -100.00 | 0 | -100.00 | ||||
| 2025-07-25 | 13F | Cwm, Llc | 596 | 328.78 | 0 | |||||
| 2025-05-05 | 13F | Ping Capital Management, Inc. | 0 | -100.00 | 0 | -100.00 | ||||
| 2025-08-13 | 13F | Provida Pension Fund Administrator | 0 | -100.00 | 0 | -100.00 | ||||
| 2025-08-28 | NP | SYMIX - AlphaCentric Symmetry Strategy Fund Class I | 2,121 | 113.17 | 152 | 141.27 | ||||
| 2025-07-24 | 13F | Monument Capital Management | 23,999 | 1,723 | ||||||
| 2025-08-12 | 13F | LPL Financial LLC | 106,035 | 138.55 | 7,611 | 216.86 | ||||
| 2025-08-14 | 13F | Royal Bank Of Canada | Call | 170,000 | 12,203 | |||||
| 2025-08-14 | 13F | Synovus Financial Corp | 5,208 | -36.92 | 374 | -16.37 | ||||
| 2025-08-14 | 13F | Tudor Investment Corp Et Al | 0 | -100.00 | 0 | -100.00 | ||||
| 2025-08-11 | 13F | HighTower Advisors, LLC | 72,662 | 2,072.91 | 5,216 | 2,249.10 | ||||
| 2025-08-14 | 13F | Royal Bank Of Canada | 413,045 | 509.79 | 29,649 | 709.86 | ||||
| 2025-07-24 | 13F | Ronald Blue Trust, Inc. | 1,702 | -65.73 | 122 | -54.48 | ||||
| 2025-05-13 | 13F | Brandywine Global Investment Management, LLC | 0 | -100.00 | 0 | |||||
| 2025-08-14 | 13F | Banque Transatlantique SA | 0 | -100.00 | 0 | |||||
| 2025-08-13 | 13F | Beacon Pointe Advisors, LLC | 5,747 | -2.97 | 413 | 28.75 | ||||
| 2025-07-23 | 13F | WestEnd Advisors, LLC | 1,470 | 106 | ||||||
| 2025-08-07 | 13F | Guidance Capital, Inc | 6,075 | 4.74 | 429 | 28.44 | ||||
| 2025-08-14 | 13F | D. E. Shaw & Co., Inc. | 19,933 | 1,431 | ||||||
| 2025-08-08 | 13F | Banco Bilbao Vizcaya Argentaria, S.a. | 457,986 | 547.22 | 32,807 | 762.43 | ||||
| 2025-08-14 | 13F | Moneda S.A. Administradora General de Fondos | 11,989 | 0.00 | 861 | 32.92 | ||||
| 2025-08-08 | 13F | SBI Securities Co., Ltd. | 967 | -4.73 | 69 | 27.78 | ||||
| 2025-08-13 | 13F | Flow Traders U.s. Llc | 0 | -100.00 | 0 | |||||
| 2025-08-14 | 13F | Parallax Volatility Advisers, L.P. | 0 | -100.00 | 0 | |||||
| 2025-08-13 | 13F | Idaho Trust Bank | 0 | -100.00 | 0 | |||||
| 2025-08-12 | 13F | Twin Focus Capital Partners, Llc | 4,955 | 0.00 | 356 | 32.96 | ||||
| 2025-07-16 | 13F/A | CX Institutional | 27 | 0.00 | 0 | |||||
| 2025-05-16 | 13F | Sender Co & Partners, Inc. | 0 | -100.00 | 0 | |||||
| 2025-07-24 | 13F | Blair William & Co/il | 1,115 | 0.00 | 80 | 33.33 | ||||
| 2025-07-24 | 13F | ADAPT Investment Managers SA | Call | 100,000 | 7,178 | |||||
| 2025-05-15 | 13F | Hrt Financial Lp | 0 | -100.00 | 0 | |||||
| 2025-07-14 | 13F | Proathlete Wealth Management Llc | 6 | 50.00 | 0 | |||||
| 2025-07-28 | NP | EARAX - Eaton Vance Richard Bernstein All Asset Strategy Fund Class A | 24,642 | -68.91 | 1,494 | -65.51 | ||||
| 2025-07-16 | 13F | Banque Pictet & Cie Sa | 80,169 | 0.00 | 5,755 | 32.83 | ||||
| 2025-07-24 | 13F | ADAPT Investment Managers SA | Put | 150,000 | 10,767 | |||||
| 2025-07-29 | 13F | Portman Square Capital LLP | 0 | -100.00 | 0 | |||||
| 2025-08-08 | 13F | City Of London Investment Management Co Ltd | 432,489 | 26.94 | 31,040 | 68.60 | ||||
| 2025-08-14 | 13F | DRW Securities, LLC | 50,184 | -83.71 | 3,597 | -78.40 | ||||
| 2025-08-12 | 13F | Rhumbline Advisers | 95,728 | 39.24 | 6,871 | 84.95 | ||||
| 2025-08-08 | 13F | Altfest L J & Co Inc | 89,632 | 6,434 | ||||||
| 2025-08-12 | 13F | Dynamic Technology Lab Private Ltd | 12,941 | 929 | ||||||
| 2025-07-14 | 13F | Clear Harbor Asset Management, LLC | 41,270 | 31.52 | 2,962 | 74.75 | ||||
| 2025-08-12 | 13F | Martin Currie Ltd | 16,133 | -23.11 | 1,158 | 2.21 | ||||
| 2025-08-14 | 13F | Temasek Holdings (Private) Ltd | 736,400 | 1,194.20 | 52,859 | 1,619.52 | ||||
| 2025-08-13 | 13F | Marshall Wace, Llp | 0 | -100.00 | 0 | |||||
| 2025-08-14 | 13F | Susquehanna International Group, Llp | Put | 957,400 | 29.12 | 68,722 | 71.50 | |||
| 2025-07-23 | 13F | Fluent Financial, LLC | 10,364 | 82.02 | 744 | 142.02 | ||||
| 2025-07-28 | 13F | BRYN MAWR TRUST Co | 5,194 | 0.00 | 373 | 32.86 | ||||
| 2025-08-14 | 13F | Susquehanna International Group, Llp | 630,029 | 6.80 | 45,223 | 41.85 | ||||
| 2025-08-14 | 13F | Susquehanna International Group, Llp | Call | 1,660,900 | 293.48 | 119,219 | 422.66 | |||
| 2025-08-06 | 13F | Pekin Hardy Strauss, Inc. | 84,090 | 134.45 | 6,036 | 211.40 | ||||
| 2025-07-29 | 13F | Portman Square Capital LLP | Call | 0 | -100.00 | 0 | ||||
| 2025-07-21 | 13F | J. Safra Sarasin Holding AG | 0 | -100.00 | 0 | |||||
| 2025-08-05 | 13F | Castlekeep Investment Advisors Llc | 5,525 | -3.39 | 397 | 28.16 | ||||
| 2025-07-08 | 13F | Nbc Securities, Inc. | 362 | 0 | ||||||
| 2025-05-14 | 13F | Quantitative Investment Management, LLC | 0 | -100.00 | 0 | |||||
| 2025-08-14 | 13F | SIH Partners, LLLP | 0 | -100.00 | 0 | |||||
| 2025-08-14 | 13F | Smartleaf Asset Management LLC | 46 | 0.00 | 3 | 50.00 | ||||
| 2025-07-22 | 13F | IMC-Chicago, LLC | 28,145 | 2,020 | ||||||
| 2025-08-08 | 13F | Cetera Investment Advisers | 49,582 | 457.41 | 3,559 | 641.25 | ||||
| 2025-08-14 | 13F | Bnp Paribas Arbitrage, Sa | 146,434 | 20.99 | 10,511 | 60.72 | ||||
| 2025-08-14 | 13F | Jain Global LLC | 100,071 | 7,183 | ||||||
| 2025-08-12 | 13F | Global Retirement Partners, LLC | 3,127 | 449.56 | 224 | 700.00 | ||||
| 2025-08-12 | 13F | Legal & General Group Plc | 35,500 | 0.00 | 2,547 | 32.79 | ||||
| 2025-07-25 | 13F | Cypress Capital Group | 7,050 | 11.02 | 506 | 47.52 | ||||
| 2025-08-01 | 13F | Bessemer Group Inc | 59,403 | 128.53 | 4 | 300.00 | ||||
| 2025-08-14 | 13F | DeepCurrents Investment Group LLC | 6,310 | 453 | ||||||
| 2025-07-22 | 13F | Knights of Columbus Asset Advisors LLC | 5,682 | 0.00 | 408 | 32.57 | ||||
| 2025-08-14 | 13F | Soros Capital Management Llc | 229,100 | 16,445 | ||||||
| 2025-07-29 | 13F | Private Trust Co Na | 695 | -1.56 | 50 | 28.95 | ||||
| 2025-08-08 | 13F | Pnc Financial Services Group, Inc. | 4,062 | 17.84 | 292 | 56.45 | ||||
| 2025-08-12 | 13F | SPX Equities Gestao de Recursos Ltda | 74,000 | 5,312 | ||||||
| 2025-08-07 | 13F/A | Credit Industriel Et Commercial | Put | 15,200 | 0.00 | 1,091 | 32.89 | |||
| 2025-08-27 | 13F/A | Squarepoint Ops LLC | Call | 700,000 | 50,246 | |||||
| 2025-05-13 | 13F | Steward Partners Investment Advisory, Llc | 0 | -100.00 | 0 | |||||
| 2025-08-14 | 13F | BlueCrest Capital Management Ltd | 7,476 | 537 | ||||||
| 2025-08-14 | 13F | Bank Of America Corp /de/ | Put | 200,000 | 14,356 | |||||
| 2025-08-14 | 13F | Bank Of America Corp /de/ | Call | 325,500 | 62.75 | 23,364 | 116.17 | |||
| 2025-08-14 | 13F | Bank Of America Corp /de/ | 2,328,142 | -1.85 | 167,114 | 30.37 | ||||
| 2025-08-14 | 13F | Comerica Bank | 275,763 | -1.64 | 19,794 | 30.65 | ||||
| 2025-08-07 | 13F/A | Credit Industriel Et Commercial | 199 | -97.19 | 14 | -96.34 | ||||
| 2025-08-07 | 13F | Valence8 US LP | 83,746 | 6,011 | ||||||
| 2025-08-11 | 13F | Citigroup Inc | 1,600,520 | 416.49 | 114,885 | 586.04 | ||||
| 2025-08-12 | 13F | Atlas Capital Advisors Llc | 0 | -100.00 | 0 | |||||
| 2025-07-21 | 13F | Credential Qtrade Securities Inc. | 0 | -100.00 | 0 | -100.00 | ||||
| 2025-08-11 | 13F | Citigroup Inc | Put | 100,000 | 7,178 | |||||
| 2025-05-15 | 13F | Advisory Services Network, LLC | 0 | -100.00 | 0 | |||||
| 2025-08-05 | 13F | Gould Asset Management Llc /ca/ | 12,627 | 5.74 | 906 | 40.47 | ||||
| 2025-08-11 | 13F | Citigroup Inc | Call | 100,000 | 7,178 | |||||
| 2025-08-13 | 13F | Wealthedge Investment Advisors, Llc | 15,390 | -37.33 | 1,105 | -16.80 | ||||
| 2025-07-28 | NP | ZEMRX - American Beacon Ninety One Emerging Markets Equity Fund R6 Class | 0 | -100.00 | 0 | -100.00 | ||||
| 2025-07-23 | 13F | Elm3 Financial Group, LLC | 11,843 | 3.71 | 850 | 37.76 | ||||
| 2025-08-14 | 13F | Sona Asset Management (us) Llc | 37,000 | 2,656 | ||||||
| 2025-08-13 | 13F | Avos Capital Management, LLC | 10,929 | 784 | ||||||
| 2025-08-06 | 13F | Black Swift Group, LLC | 98,320 | 7,057 | ||||||
| 2025-08-18 | 13F/A | National Bank Of Canada /fi/ | 284 | 43.43 | 20 | 100.00 | ||||
| 2025-07-17 | 13F | SeaBridge Investment Advisors LLC | 9,923 | -2.68 | 712 | 29.45 | ||||
| 2025-08-14 | 13F | Kingdon Capital Management, L.l.c. | 200,000 | 14,356 | ||||||
| 2025-08-06 | 13F | AE Wealth Management LLC | 289 | -25.13 | 21 | 0.00 | ||||
| 2025-03-31 | NP | SSXU - Day Hagan/Ned Davis Research Smart Sector International ETF | 40,668 | 2,195 | ||||||
| 2025-08-14 | 13F | Millennium Management Llc | 52,106 | 122.89 | 3,740 | 196.12 | ||||
| 2025-08-08 | 13F | NAN FUNG TRINITY (HK) Ltd | 920,800 | 0.00 | 66,095 | 32.83 | ||||
| 2025-08-14 | 13F | Engineers Gate Manager LP | 23,700 | 1,701 | ||||||
| 2025-08-11 | 13F | Hexagon Capital Partners LLC | 0 | -100.00 | 0 | |||||
| 2025-08-08 | 13F | Gts Securities Llc | 0 | -100.00 | 0 | |||||
| 2025-04-30 | 13F | MeadowBrook Investment Advisors LLC | 0 | -100.00 | 0 | -100.00 | ||||
| 2025-08-12 | 13F | Jefferies Financial Group Inc. | 3,420 | 245 | ||||||
| 2025-08-06 | 13F | Richard Bernstein Advisors LLC | 170,000 | -54.01 | 12,203 | -38.91 | ||||
| 2025-05-07 | 13F | Phoenix Holdings Ltd. | 0 | -100.00 | 0 | |||||
| 2025-08-01 | 13F | Envestnet Asset Management Inc | 233,118 | 1.68 | 16,733 | 35.05 | ||||
| 2025-08-08 | 13F | Avantax Advisory Services, Inc. | 24,856 | 3.83 | 1,784 | 37.97 | ||||
| 2025-08-11 | 13F | Banque Cantonale Vaudoise | 2,678 | -2.33 | 0 | |||||
| 2025-08-04 | 13F | Atria Investments Llc | 3,904 | 280 | ||||||
| 2025-08-14 | 13F | CIBC Asset Management Inc | 4,560 | -16.10 | 327 | 11.60 | ||||
| 2025-08-14 | 13F | Michelson Medical Research Foundation, Inc. | 20,155 | 0.00 | 1,447 | 32.78 | ||||
| 2025-08-08 | 13F | Fortis Group Advisors, LLC | 8 | 0.00 | 1 | |||||
| 2025-08-14 | 13F | Rafferty Asset Management, LLC | 985,291 | 11.02 | 70,724 | 47.46 | ||||
| 2025-08-04 | 13F | Assetmark, Inc | 61,710 | 144.59 | 4,430 | 224.94 | ||||
| 2025-08-14 | 13F | Bnp Paribas Arbitrage, Sa | Call | 350 | 2,512 | |||||
| 2025-08-14 | 13F | Bnp Paribas Arbitrage, Sa | Put | 1,111 | 7,975 | |||||
| 2025-07-29 | 13F | Private Wealth Management Group, LLC | 1,320 | 83.33 | 95 | 147.37 | ||||
| 2025-08-07 | 13F | Resources Investment Advisors, LLC. | 3,783 | -0.34 | 272 | 32.20 | ||||
| 2025-05-14 | 13F | One River Asset Management, LLC | Put | 0 | -100.00 | 0 | ||||
| 2025-05-14 | 13F | One River Asset Management, LLC | 0 | -100.00 | 0 | |||||
| 2025-08-14 | 13F | Karpus Management, Inc. | 83,418 | 5,988 | ||||||
| 2025-04-23 | 13F | GHP Investment Advisors, Inc. | 0 | -100.00 | 0 | |||||
| 2025-08-19 | 13F | Cape Investment Advisory, Inc. | 213 | 47.92 | 15 | 114.29 | ||||
| 2025-08-12 | 13F | Manchester Capital Management LLC | 900 | 0.00 | 65 | 33.33 | ||||
| 2025-08-13 | 13F | First Trust Advisors Lp | 45,832 | -4.73 | 3,290 | 26.55 | ||||
| 2025-08-13 | 13F | Marshall Wace, Llp | Call | 0 | -100.00 | 0 | ||||
| 2025-05-15 | 13F | Strategic Global Advisors, LLC | 0 | -100.00 | 0 | |||||
| 2025-08-14 | 13F | Caisse De Depot Et Placement Du Quebec | 235,000 | 51.71 | 16,868 | 101.53 | ||||
| 2025-08-14 | 13F | PointState Capital LP | 1,868,227 | 134,101 | ||||||
| 2025-07-30 | 13F | Phillips Financial Management, Llc | 405 | 0.00 | 29 | 38.10 | ||||
| 2025-08-14 | 13F | Headlands Technologies LLC | 4,008 | 288 | ||||||
| 2025-04-17 | 13F | Factory Mutual Insurance Co | 0 | -100.00 | 0 | |||||
| 2025-07-31 | 13F | Jordan Park Group LLC | 147,435 | 190.11 | 10,583 | 285.36 | ||||
| 2025-08-14 | 13F | Goldman Sachs Group Inc | 1,075,298 | 348.12 | 77,185 | 495.23 | ||||
| 2025-07-28 | NP | ERBAX - Eaton Vance Richard Bernstein Equity Strategy Fund Class A | 160,358 | -44.77 | 9,723 | -38.75 | ||||
| 2025-05-15 | 13F | Kiker Wealth Management, LLC | 0 | -100.00 | 0 | |||||
| 2025-07-23 | 13F | Nbt Bank N A /ny | 157 | 0.00 | 11 | 37.50 | ||||
| 2025-08-08 | 13F | Creative Planning | 5,021 | 3.63 | 360 | 37.93 | ||||
| 2025-08-13 | 13F | Sumitomo Mitsui Financial Group, Inc. | 680,000 | 48,810 | ||||||
| 2025-08-13 | 13F | Invesco Ltd. | 94,461 | 424.29 | 6,780 | 596.81 | ||||
| 2025-08-01 | 13F | Y-Intercept (Hong Kong) Ltd | 22,036 | 1,582 | ||||||
| 2025-08-13 | 13F | Arrowstreet Capital, Limited Partnership | 1,536,252 | -44.29 | 110,272 | -26.00 | ||||
| 2025-08-04 | 13F | Spire Wealth Management | 50 | -80.00 | 4 | -76.92 | ||||
| 2025-08-27 | 13F/A | Squarepoint Ops LLC | 0 | -100.00 | 0 | -100.00 | ||||
| 2025-07-24 | 13F | Total Wealth Planning & Management, Inc. | 6,698 | 481 | ||||||
| 2025-07-22 | 13F | 4Thought Financial Group Inc. | 257 | 0.78 | 18 | 38.46 | ||||
| 2025-08-11 | 13F | Mount Lucas Management LP | 14,308 | 1,027 | ||||||
| 2025-08-08 | 13F | Larson Financial Group LLC | 17 | 0.00 | 1 | |||||
| 2025-08-19 | 13F | Marex Group plc | Put | 25,500 | 1,830 | |||||
| 2025-08-14 | 13F | Evergreen Capital Management Llc | 116,905 | -20.98 | 8,391 | 4.97 | ||||
| 2025-07-31 | 13F | Leavell Investment Management, Inc. | 14,468 | 5.56 | 1,039 | 40.27 | ||||
| 2025-08-19 | 13F | Marex Group plc | 6,052 | 434 | ||||||
| 2025-08-06 | 13F | First Horizon Advisors, Inc. | 0 | -100.00 | 0 | |||||
| 2025-08-14 | 13F | Toronto Dominion Bank | 7 | 0.00 | 1 | |||||
| 2025-09-04 | 13F/A | Advisor Group Holdings, Inc. | 5,244 | 70.04 | 376 | 126.51 | ||||
| 2025-08-15 | 13F | Morgan Stanley | 2,210,025 | 14.71 | 158,636 | 52.37 | ||||
| 2025-05-28 | NP | GHTA - Goose Hollow Tactical Allocation ETF | 18,001 | 973 | ||||||
| 2025-08-01 | 13F | Oversea-Chinese Banking CORP Ltd | 22,959 | -3.42 | 1,648 | 28.27 | ||||
| 2025-04-16 | 13F | Byrne Asset Management LLC | 0 | -100.00 | 0 | |||||
| 2025-06-26 | NP | MSTFX - Morningstar International Equity Fund | 244,996 | 53.29 | 13,766 | 59.61 | ||||
| 2025-07-23 | 13F | Venturi Wealth Management, LLC | 0 | -100.00 | 0 | |||||
| 2025-08-08 | 13F | Pinnbrook Capital Management Lp | Call | 385,000 | 27,635 | |||||
| 2025-07-25 | 13F | Envestnet Portfolio Solutions, Inc. | 6,726 | -8.09 | 483 | 22.03 | ||||
| 2025-07-08 | 13F | Boltwood Capital Management | 3,800 | 273 | ||||||
| 2025-08-14 | 13F | Optiver Holding B.V. | 342 | 25 | ||||||
| 2025-08-14 | 13F | KADENSA CAPITAL Ltd | 110,265 | 7,915 | ||||||
| 2025-08-14 | 13F | UBS Group AG | Put | 374,800 | 24.93 | 26,903 | 65.94 | |||
| 2025-08-13 | 13F | Cresset Asset Management, LLC | 8,661 | 6.98 | 622 | 42.11 | ||||
| 2025-08-14 | 13F | UBS Group AG | 1,079,461 | -20.70 | 77,484 | 5.33 | ||||
| 2025-07-14 | 13F | Park Avenue Securities Llc | 2,827 | 13.90 | 0 | -100.00 | ||||
| 2025-08-14 | 13F | UBS Group AG | Call | 828,000 | 176.00 | 59,434 | 266.60 | |||
| 2025-07-14 | 13F | AdvisorNet Financial, Inc | 0 | -100.00 | 0 | |||||
| 2025-08-12 | 13F | Deutsche Bank Ag\ | 1,770 | -49.90 | 127 | -33.16 | ||||
| 2025-07-31 | 13F | Cambridge Investment Research Advisors, Inc. | 5,865 | 47.21 | 0 | |||||
| 2025-08-08 | 13F | Pinnbrook Capital Management Lp | 58,617 | 4,208 | ||||||
| 2025-08-13 | 13F | GeoWealth Management, LLC | 18,601 | 84,450.00 | 1,335 | 133,400.00 | ||||
| 2025-07-28 | 13F | Morningstar Investment Management LLC | 318,457 | -25.38 | 23 | -4.35 | ||||
| 2025-08-14 | 13F | Boothbay Fund Management, Llc | 7,500 | 0.00 | 538 | 32.84 | ||||
| 2025-08-14 | 13F | Owl Creek Asset Management, L.P. | 304,386 | 21,849 | ||||||
| 2025-08-14 | 13F | Owl Creek Asset Management, L.P. | Call | 2,100,000 | 150,738 | |||||
| 2025-08-05 | 13F | Bank Of Montreal /can/ | 1,845 | -69.65 | 132 | -59.76 | ||||
| 2025-08-13 | 13F | Walleye Trading LLC | Put | 9,900 | 0.00 | 711 | 32.96 | |||
| 2025-08-13 | 13F | Walleye Trading LLC | Call | 36,200 | -6.22 | 2,598 | 24.60 | |||
| 2025-08-14 | 13F | Wells Fargo & Company/mn | 29,622 | -7.50 | 2,126 | 22.89 | ||||
| 2025-08-14 | 13F | Wells Fargo & Company/mn | Put | 100,000 | 7,178 | |||||
| 2025-08-05 | 13F | Key FInancial Inc | 451 | 0.00 | 32 | 33.33 | ||||
| 2025-05-12 | 13F | First Western Trust Bank | 0 | -100.00 | 0 | |||||
| 2025-08-14 | 13F | Old Mission Capital Llc | 0 | -100.00 | 0 | |||||
| 2025-08-04 | 13F | Arkadios Wealth Advisors | 3,461 | 248 | ||||||
| 2025-08-14 | 13F | Horizon Investments, LLC | 6 | 0 | ||||||
| 2025-08-28 | NP | Northern Lights Fund Trust - Ocean Park International ETF | 1,066 | 2.21 | 77 | 35.71 | ||||
| 2025-08-13 | 13F | Westerkirk Capital Inc. | 29,432 | 2,113 | ||||||
| 2025-08-14 | 13F | Wells Fargo & Company/mn | Call | 100,000 | 7,178 | |||||
| 2025-08-13 | 13F | M&t Bank Corp | 2,827 | 203 | ||||||
| 2025-07-24 | 13F | Us Bancorp \de\ | 170 | -40.97 | 12 | -20.00 | ||||
| 2025-08-12 | 13F | O'shaughnessy Asset Management, Llc | 151 | 0.00 | 11 | 25.00 | ||||
| 2025-07-18 | 13F | BOCHK Asset Management Ltd | 8,000 | 574 | ||||||
| 2025-08-13 | 13F | Global Endowment Management, LP | 6,110 | 0.00 | 439 | 32.73 | ||||
| 2025-08-12 | 13F | Zacks Investment Management | 10,001 | 18.52 | 718 | 57.58 | ||||
| 2025-07-25 | 13F | Prostatis Group LLC | 42,334 | 3,039 | ||||||
| 2025-08-13 | 13F | Fairtree Asset Management (Pty) Ltd | 644 | -85.13 | 46 | -80.34 | ||||
| 2025-08-05 | 13F | Huntington National Bank | 0 | |||||||
| 2025-05-14 | 13F | Jump Financial, LLC | 0 | -100.00 | 0 | |||||
| 2025-08-14 | 13F/A | Bank Julius Baer & Co. Ltd, Zurich | 2,099 | -27.22 | 151 | -14.77 | ||||
| 2025-07-23 | 13F | Viewpoint Capital Management LLC | 1 | 0.00 | 0 | |||||
| 2025-08-14 | 13F/A | Barclays Plc | 1,400,083 | 97.58 | 100 | 163.16 | ||||
| 2025-08-04 | 13F | Wolverine Asset Management Llc | 300 | 66.67 | 22 | 90.91 | ||||
| 2025-08-14 | 13F | Operose Advisors LLC | 23 | 2 | ||||||
| 2025-07-24 | 13F | Standard Life Aberdeen plc | 159,066 | 41.25 | 11,397 | 89.00 | ||||
| 2025-07-09 | 13F | Massmutual Trust Co Fsb/adv | 8,163 | -4.54 | 586 | 26.62 | ||||
| 2025-07-22 | 13F | Gsa Capital Partners Llp | 3,461 | 0 | ||||||
| 2025-08-14 | 13F | Schonfeld Strategic Advisors LLC | 2,877 | -93.74 | 207 | -91.71 | ||||
| 2025-07-10 | 13F | Exchange Traded Concepts, Llc | 1,066 | 2.21 | 77 | 35.71 | ||||
| 2025-07-23 | 13F | Bellevue Asset Management, Llc | 100 | 0.00 | 7 | 40.00 | ||||
| 2025-08-14 | 13F/A | Barclays Plc | Call | 555,000 | 40 | |||||
| 2025-08-15 | 13F | Earnest Partners Llc | 25,483 | 0.00 | 1,829 | 32.82 | ||||
| 2025-07-18 | 13F | Union Bancaire Privee, UBP SA | 30,476 | 58.12 | 2,110 | 102.30 | ||||
| 2025-07-14 | 13F | Kapitalo Investimentos Ltda | 0 | -100.00 | 0 | |||||
| 2025-08-14 | 13F | Manufacturers Life Insurance Company, The | 267,877 | 6,220.84 | 19,228 | 8,296.51 | ||||
| 2025-08-14 | 13F | Hara Capital LLC | 660 | -29.03 | 47 | -6.00 | ||||
| 2025-08-14 | 13F | Aristotle Capital Management, LLC | 68,789 | 0.06 | 4,938 | 32.89 | ||||
| 2025-07-08 | 13F | Webster Bank, N. A. | 600 | 0.00 | 43 | 34.38 | ||||
| 2025-08-11 | 13F | Bell Investment Advisors, Inc | 7 | 0.00 | 1 | |||||
| 2025-04-28 | 13F | Mainstream Capital Management LLC | 0 | -100.00 | 0 | |||||
| 2025-08-14 | 13F | Stamos Capital Partners, L.p. | 25,182 | 1,808 | ||||||
| 2025-07-28 | 13F | Allianz Asset Management GmbH | 6,785 | -3.88 | 487 | 27.82 | ||||
| 2025-08-14 | 13F | Cubist Systematic Strategies, LLC | Put | 5,300 | -75.12 | 380 | -66.99 | |||
| 2025-08-27 | 13F/A | Squarepoint Ops LLC | Put | 0 | -100.00 | 0 | -100.00 | |||
| 2025-08-14 | 13F | Cubist Systematic Strategies, LLC | Call | 9,200 | -33.33 | 660 | -11.41 | |||
| 2025-05-15 | 13F | Centiva Capital, LP | 0 | -100.00 | 0 | -100.00 | ||||
| 2025-08-14 | 13F | Maytus Capital Management, LLC | 129,140 | 9,270 | ||||||
| 2025-07-28 | 13F | Td Asset Management Inc | 828,532 | 0.00 | 59,472 | 32.83 | ||||
| 2025-08-12 | 13F | Prudential Plc | 12,600 | 904 | ||||||
| 2025-08-11 | 13F | Aptus Capital Advisors, LLC | 125 | 0.00 | 9 | 33.33 | ||||
| 2025-08-14 | 13F | Stifel Financial Corp | 24,700 | -78.18 | 1,773 | -71.03 | ||||
| 2025-08-14 | 13F | Colony Group, LLC | 6,192 | 25.45 | 444 | 66.92 | ||||
| 2025-08-14 | 13F | Ameriprise Financial Inc | 5,957 | -8.10 | 428 | 22.00 | ||||
| 2025-08-14 | 13F | Balyasny Asset Management Llc | 0 | -100.00 | 0 | |||||
| 2025-08-12 | 13F | Rock Creek Group, LP | 40,361 | 2,897 | ||||||
| 2025-07-14 | 13F | Ridgewood Investments LLC | 0 | -100.00 | 0 | -100.00 | ||||
| 2025-07-31 | 13F | Pacitti Group Inc. | 3,326 | 239 | ||||||
| 2025-07-28 | 13F | Harbour Investments, Inc. | 246 | 74.47 | 18 | 142.86 | ||||
| 2025-08-12 | 13F | MAI Capital Management | 112 | -6.67 | 8 | 33.33 | ||||
| 2025-08-12 | 13F | Franklin Resources Inc | 326 | 86.29 | 23 | 155.56 | ||||
| 2025-06-26 | NP | MSTSX - Morningstar Unconstrained Allocation Fund | 181,780 | -13.14 | 10,214 | -9.56 | ||||
| 2025-07-29 | 13F | Stephens Inc /ar/ | 4,280 | 0.00 | 307 | 32.90 | ||||
| 2025-06-30 | NP | PTIN - Pacer Trendpilot International ETF | 0 | -100.00 | 0 | -100.00 | ||||
| 2025-08-14 | 13F | Sunbelt Securities, Inc. | 5,287 | 3.22 | 269 | -2.54 | ||||
| 2025-07-03 | 13F | Garde Capital, Inc. | 205 | 0.00 | 15 | 27.27 | ||||
| 2025-07-21 | 13F | Ameritas Advisory Services, LLC | 1,065 | 76 | ||||||
| 2025-07-21 | 13F | Mirae Asset Global Investments Co., Ltd. | 44,494 | -82.49 | 3,194 | -78.66 | ||||
| 2025-08-13 | 13F | Capital Fund Management S.a. | 0 | -100.00 | 0 | -100.00 | ||||
| 2025-08-13 | 13F | Lido Advisors, LLC | 21,818 | 1,566 | ||||||
| 2025-08-14 | 13F | Verition Fund Management LLC | Call | 0 | -100.00 | 0 | ||||
| 2025-08-14 | 13F | Sentinus, LLC | 4,685 | -0.55 | 336 | 32.28 | ||||
| 2025-08-14 | 13F | Capstone Investment Advisors, Llc | Call | 5,000 | 359 | |||||
| 2025-08-14 | 13F | Capstone Investment Advisors, Llc | Put | 51,200 | 3,675 | |||||
| 2025-08-12 | 13F | Coldstream Capital Management Inc | 0 | -100.00 | 0 | |||||
| 2025-08-14 | 13F | Capstone Investment Advisors, Llc | 18,919 | 1,358 | ||||||
| 2025-07-31 | 13F | Caisse Des Depots Et Consignations | 162,000 | 0.00 | 11,610 | 32.18 | ||||
| 2025-05-14 | 13F | Boston Private Wealth Llc | 0 | -100.00 | 0 | |||||
| 2025-08-13 | 13F | Sun Life Financial Inc | 1,660,773 | 7.16 | 119 | 43.37 | ||||
| 2025-08-14 | 13F | Lazard Asset Management Llc | 4,050 | 0 | ||||||
| 2025-08-27 | NP | QCGLRX - Global Equities Account Class R1 | 36,359 | -22.40 | 2,610 | 3.08 | ||||
| 2025-08-08 | 13F | 1776 Wealth LLC | 3,219 | 231 | ||||||
| 2025-08-12 | 13F | Financial Advocates Investment Management | 0 | -100.00 | 0 | |||||
| 2025-08-13 | 13F | Bridgewater Associates, LP | 1,627,624 | 8.20 | 116,831 | 43.72 | ||||
| 2025-08-14 | 13F | Maven Securities LTD | 9,758 | 700 | ||||||
| 2025-08-14 | 13F | Sei Investments Co | 119,543 | 8,581 | ||||||
| 2025-05-13 | 13F | Mondrian Investment Partners LTD | 5,273 | 6.22 | 285 | 6.37 | ||||
| 2025-08-05 | 13F | Telos Capital Management, Inc. | 9,897 | 0.83 | 710 | 33.96 | ||||
| 2025-08-14 | 13F | Citadel Advisors Llc | 627,183 | 99.97 | 45,019 | 165.63 | ||||
| 2025-08-06 | 13F | Innealta Capital, Llc | 27,391 | 179.47 | 1,966 | 271.64 | ||||
| 2025-08-27 | NP | HCEMX - The Emerging Markets Portfolio HC Strategic Shares | 6,884 | -83.71 | 494 | -77.02 | ||||
| 2025-08-12 | 13F | Jpmorgan Chase & Co | 1,066,257 | 4,532.07 | 76,536 | 6,057.28 | ||||
| 2025-08-14 | 13F | Tudor Investment Corp Et Al | Call | 1,240,100 | 89,014 | |||||
| 2025-08-12 | 13F | CIBC Private Wealth Group, LLC | 105,265 | 0.00 | 7,556 | 46.73 | ||||
| 2025-08-14 | 13F | Brevan Howard Capital Management LP | Call | 500,000 | 35,890 | |||||
| 2025-08-11 | 13F | Principal Securities, Inc. | 136,548 | 19.91 | 9,801 | 69.13 | ||||
| 2025-05-15 | 13F | Crestline Management, LP | 0 | -100.00 | 0 | |||||
| 2025-08-13 | 13F | Amundi | 11,929 | -66.49 | 858 | -54.63 | ||||
| 2025-07-29 | NP | BLUIX - BLUEPRINT GROWTH FUND Institutional Class | 23,860 | -40.95 | 1,447 | -45.35 | ||||
| 2025-07-29 | 13F | Swmg, Llc | 2,778 | 202 | ||||||
| 2025-08-14 | 13F/A | Rockefeller Capital Management L.P. | 277,262 | 166.09 | 19,902 | 253.48 | ||||
| 2025-08-13 | 13F | Cerity Partners LLC | 30,144 | 0.00 | 2,164 | 32.86 | ||||
| 2025-05-05 | 13F | Morningstar Investment Services LLC | 14,167 | 1 | ||||||
| 2025-05-13 | 13F | Clear Street Markets Llc | 0 | -100.00 | 0 | -100.00 | ||||
| 2025-08-11 | 13F | Nations Financial Group Inc, /ia/ /adv | 30,300 | 19.76 | 2,175 | 59.03 | ||||
| 2025-07-11 | 13F | Grove Bank & Trust | 0 | -100.00 | 0 | |||||
| 2025-07-28 | 13F | Twin Tree Management, LP | 197,269 | 1,466.75 | 14,160 | 1,982.21 | ||||
| 2025-04-17 | 13F | FNY Investment Advisers, LLC | 0 | -100.00 | 0 | |||||
| 2025-08-14 | 13F | USS Investment Management Ltd | 1,147,976 | 13.93 | 82,373 | 51.26 | ||||
| 2025-08-07 | 13F | LOM Asset Management Ltd | 510 | 0 | ||||||
| 2025-07-31 | 13F | Nisa Investment Advisors, Llc | 0 | -100.00 | 0 | |||||
| 2025-08-14 | 13F | Peak6 Llc | Call | 31,700 | -8.12 | 2,275 | 22.05 | |||
| 2025-07-22 | 13F | Checchi Capital Advisers, LLC | 30,968 | 5.54 | 2,223 | 40.19 | ||||
| 2025-08-14 | 13F | Oasis Management Co Ltd. | Put | 172,500 | 12,382 | |||||
| 2025-08-14 | 13F | Peak6 Llc | Put | 11,100 | 2,675.00 | 797 | 3,690.48 | |||
| 2025-08-08 | 13F | Cercano Management LLC | 43,201 | 3,101 | ||||||
| 2025-08-14 | 13F | Transamerica Financial Advisors, Inc. | 19 | 0.00 | 1 | |||||
| 2025-08-05 | 13F | Wakefield Asset Management LLLP | 8,823 | -1.57 | 633 | 30.79 | ||||
| 2025-06-27 | NP | KORU - Direxion Daily MSCI South Korea Bull 3X Shares | 768,808 | -29.82 | 43,199 | -26.93 | ||||
| 2025-05-02 | 13F | BlackRock, Inc. | Call | 0 | -100.00 | 0 | -100.00 | |||
| 2025-05-13 | 13F | Russell Investments Group, Ltd. | 0 | -100.00 | 0 | -100.00 | ||||
| 2025-08-13 | 13F | Fisher Asset Management, LLC | 3,383 | 243 | ||||||
| 2025-07-24 | 13F | Summit Place Financial Advisors, LLC | 26,415 | 1.87 | 1,896 | 35.33 | ||||
| 2025-08-07 | 13F | Private Advisory Group LLC | 314,342 | -3.12 | 22,563 | 28.69 | ||||
| 2025-08-11 | 13F | TD Waterhouse Canada Inc. | 0 | -100.00 | 0 | |||||
| 2025-08-27 | NP | XNAV - FundX Aggressive ETF | 14,000 | 1,005 | ||||||
| 2025-08-12 | 13F | Pacer Advisors, Inc. | 0 | -100.00 | 0 | |||||
| 2025-08-18 | 13F | Geneos Wealth Management Inc. | 30 | 0.00 | 2 | 100.00 | ||||
| 2025-08-06 | 13F | Texas Yale Capital Corp. | 4,810 | -6.51 | 345 | 24.10 | ||||
| 2025-08-15 | 13F | Tower Research Capital LLC (TRC) | 161 | 1,510.00 | 12 | |||||
| 2025-07-30 | NP | FSAMX - Strategic Advisers Emerging Markets Fund This fund is a listed as child fund of Fmr Llc and if that institution has disclosed ownership in this security, then these positions will not be double counted when calculating total shares and total value | 511,975 | 0.00 | 31,041 | 10.90 | ||||
| 2025-08-01 | 13F | Belvedere Trading LLC | Call | 15,000 | 1,077 | |||||
| 2025-07-15 | 13F | BigSur Wealth Management LLC | 750 | 0.00 | 54 | 32.50 | ||||
| 2025-08-14 | 13F | Group One Trading, L.p. | 54,912 | 122.02 | 3,942 | 194.99 | ||||
| 2025-05-15 | 13F | Silvercrest Asset Management Group Llc | 0 | -100.00 | 0 | -100.00 | ||||
| 2025-08-14 | 13F | State Of Wisconsin Investment Board | 139,000 | -24.37 | 9,977 | 0.45 | ||||
| 2025-07-10 | 13F | Polianta Ltd | 0 | -100.00 | 0 | |||||
| 2025-05-30 | NP | SETM - Sprott Energy Transition Materials ETF | 0 | -100.00 | 0 | -100.00 | ||||
| 2025-08-08 | 13F | Itau Unibanco Holding S.A. | 13,565 | 31.84 | 234 | |||||
| 2025-08-13 | 13F | Hsbc Holdings Plc | 1,296,271 | 1,752.98 | 93,047 | 2,363.52 | ||||
| 2025-08-14 | 13F | Prelude Capital Management, Llc | 9,250 | -0.59 | 664 | 32.07 | ||||
| 2025-08-12 | 13F | BlackRock, Inc. | 13,121 | 16.87 | 942 | 55.28 | ||||
| 2025-08-14 | 13F | Citadel Advisors Llc | Call | 1,233,400 | 479.33 | 88,533 | 669.52 | |||
| 2025-07-11 | 13F | Farther Finance Advisors, LLC | 550 | 0.00 | 39 | 30.00 | ||||
| 2025-08-14 | 13F | Kovitz Investment Group Partners, LLC | 5,201 | 373 | ||||||
| 2025-08-14 | 13F | Citadel Advisors Llc | Put | 347,200 | 347.42 | 24,922 | 494.37 | |||
| 2025-07-18 | 13F | SOA Wealth Advisors, LLC. | 38 | 0.00 | 3 | 0.00 | ||||
| 2025-08-14 | 13F | Black Maple Capital Management LP | 0 | -100.00 | 0 | |||||
| 2025-05-13 | 13F | Quadrature Capital Ltd | 0 | -100.00 | 0 | |||||
| 2025-08-04 | 13F | Migdal Insurance & Financial Holdings Ltd. | 2,980 | -19.02 | 0 | |||||
| 2025-07-24 | 13F | Shayne & Co., Llc | 4,375 | -53.26 | 314 | -37.82 | ||||
| 2025-08-12 | 13F | Edmond De Rothschild Holding S.a. | 1,386 | 0.00 | 99 | 33.78 | ||||
| 2025-08-13 | 13F | Continuum Advisory, LLC | 0 | -100.00 | 0 | |||||
| 2025-08-12 | 13F | Nuveen, LLC | 36,359 | -22.40 | 2,610 | 3.08 | ||||
| 2025-08-14 | 13F | New Vernon Capital Holdings II LLC | 157,066 | -88.95 | 11,274 | 43,261.54 | ||||
| 2025-06-26 | NP | BlackRock ETF Trust - iShares International Country Rotation Active ETF | 2,971 | -1.10 | 167 | 2.47 | ||||
| 2025-08-08 | 13F | Quinn Opportunity Partners LLC | 52,286 | -74.91 | 3,753 | -66.67 | ||||
| 2025-07-29 | 13F | TFC Financial Management | 156 | 0.00 | 11 | 37.50 | ||||
| 2025-07-30 | 13F | Journey Advisory Group, LLC | 71,168 | 5,108 | ||||||
| 2025-07-24 | 13F | Costello Asset Management, INC | 36 | 0.00 | 3 | 100.00 | ||||
| 2025-07-31 | 13F | Sumitomo Mitsui Trust Holdings, Inc. | 0 | -100.00 | 0 | |||||
| 2025-08-28 | NP | ICCIX - Dynamic International Opportunity Fund Class I | 27,391 | 211.23 | 1,966 | 313.89 | ||||
| 2025-07-03 | 13F | Fiduciary Financial Group, Llc | 39,342 | -3.82 | 2,818 | 32.99 | ||||
| 2025-08-06 | 13F | Commonwealth Equity Services, Llc | 24,621 | 209.08 | 2 | |||||
| 2025-07-21 | 13F | Washington Growth Strategies Llc | 6,020 | 11,048.15 | 0 | |||||
| 2025-07-11 | 13F/A | Financiere des Professionnels - Fonds d,investissement inc. | 65,000 | 0.00 | 4,666 | 32.83 | ||||
| 2025-07-23 | 13F | Vontobel Holding Ltd. | 119,285 | -15.30 | 8,562 | 12.51 | ||||
| 2025-08-14 | 13F | Glen Eagle Advisors, LLC | 5 | 0.00 | 0 | |||||
| 2025-05-15 | 13F | Cullen Capital Management, LLC | 101,217 | 385.10 | 5,470 | 415.46 | ||||
| 2025-08-13 | 13F | Capital Fund Management S.a. | Call | 442,200 | -15.37 | 31,741 | 12.42 | |||
| 2025-08-11 | 13F | Covestor Ltd | 13 | -23.53 | 0 | |||||
| 2025-08-13 | 13F | Capital Fund Management S.a. | Put | 231,200 | 50.52 | 16,596 | 99.94 | |||
| 2025-07-25 | 13F | Allspring Global Investments Holdings, LLC | 139,164 | -17.18 | 9,989 | 10.01 | ||||
| 2025-07-30 | 13F | Whittier Trust Co | 390 | 0.00 | 28 | 28.57 | ||||
| 2025-08-14 | 13F | Mml Investors Services, Llc | 12,671 | -15.93 | 1 | |||||
| 2025-07-25 | 13F | Yousif Capital Management, Llc | 270,547 | -1.71 | 19,420 | 30.56 | ||||
| 2025-08-13 | 13F | Schroder Investment Management Group | 1,065,620 | 31,122.38 | 75,382 | 40,427.42 | ||||
| 2025-07-15 | 13F | Fifth Third Bancorp | 68 | -56.96 | 5 | -50.00 | ||||
| 2025-08-04 | 13F | Waterfront Wealth Inc. | 11,080 | -1.32 | 795 | 31.19 | ||||
| 2025-08-14 | 13F | Peak6 Llc | 0 | -100.00 | 0 | |||||
| 2025-08-14 | 13F | FIL Ltd | 346,272 | 116.42 | 24,855 | 187.47 | ||||
| 2025-08-19 | 13F | Newbridge Financial Services Group, Inc. | 8 | 0.00 | 1 | |||||
| 2025-07-31 | 13F | GenTrust, LLC | 18,244 | 3.74 | 1,310 | 37.79 | ||||
| 2025-07-14 | 13F | UMA Financial Services, Inc. | 63 | 0.00 | 5 | 33.33 | ||||
| 2025-08-18 | 13F | Wolverine Trading, Llc | Call | 154,600 | 10,936 | |||||
| 2025-08-14 | 13F | Wexford Capital Lp | 60,462 | 4,340 | ||||||
| 2025-08-14 | 13F | Qube Research & Technologies Ltd | 7,257 | 280.75 | 521 | 404.85 | ||||
| 2025-07-09 | 13F | Breakwater Investment Management | 763 | -17.25 | 55 | 10.20 | ||||
| 2025-08-07 | 13F | Allworth Financial LP | 77 | 0.00 | 6 | 25.00 | ||||
| 2025-08-18 | 13F | Wolverine Trading, Llc | Put | 74,400 | 5,263 | |||||
| 2025-08-18 | 13F | Wolverine Trading, Llc | 72,232 | 5,110 | ||||||
| 2025-08-05 | 13F | Simplex Trading, Llc | 0 | -100.00 | 0 | |||||
| 2025-08-14 | 13F | Driehaus Capital Management Llc | 38,126 | 2,737 | ||||||
| 2025-08-12 | 13F | Proequities, Inc. | 0 | 0 | ||||||
| 2025-07-29 | NP | HFND - Unlimited HFND Multi-Strategy Return Tracker ETF | 2,148 | 52.12 | 130 | 68.83 | ||||
| 2025-07-14 | 13F | Ridgewood Investments LLC | Call | 700 | 15 | |||||
| 2025-05-16 | 13F/A | Mbb Public Markets I Llc | 0 | -100.00 | 0 | -100.00 | ||||
| 2025-08-08 | 13F | SG Americas Securities, LLC | 22,078 | 2 | ||||||
| 2025-05-08 | 13F | Alberta Investment Management Corp | 0 | -100.00 | 0 | |||||
| 2025-08-12 | 13F | Elo Mutual Pension Insurance Co | 114,298 | 0.00 | 8,204 | 32.84 | ||||
| 2025-08-14 | 13F | Jane Street Group, Llc | Put | 31,700 | 296.25 | 2,275 | 426.62 | |||
| 2025-08-14 | 13F | Jane Street Group, Llc | Call | 52,600 | -73.91 | 3,776 | -65.35 | |||
| 2025-05-16 | 13F/A | Mbb Public Markets I Llc | Call | 0 | -100.00 | 0 | -100.00 | |||
| 2025-08-15 | 13F | State of Tennessee, Treasury Department | 7,253,614 | -2.29 | 520,664 | 29.78 | ||||
| 2025-08-14 | 13F | Banco BTG Pactual S.A. | 26,000 | 550.00 | 1,866 | 763.89 | ||||
| 2025-08-14 | 13F | Integrated Wealth Concepts LLC | 22,274 | 1,599 | ||||||
| 2025-04-28 | 13F | Pictet North America Advisors SA | 0 | -100.00 | 0 | |||||
| 2025-08-14 | 13F | CIBC World Markets Inc. | 76,482 | -5.48 | 5,490 | 25.55 |