Mga Batayang Estadistika
| Pemilik Institusional | 255 total, 238 long only, 1 short only, 16 long/short - change of 11.35% MRQ |
| Alokasi Portofolio Rata-rata | 0.4018 % - change of -19.15% MRQ |
| Saham Institusional (Jangka Panjang) | 36,223,402 (ex 13D/G) - change of 0.38MM shares 1.06% MRQ |
| Nilai Institusional (Jangka Panjang) | $ 1,679,259 USD ($1000) |
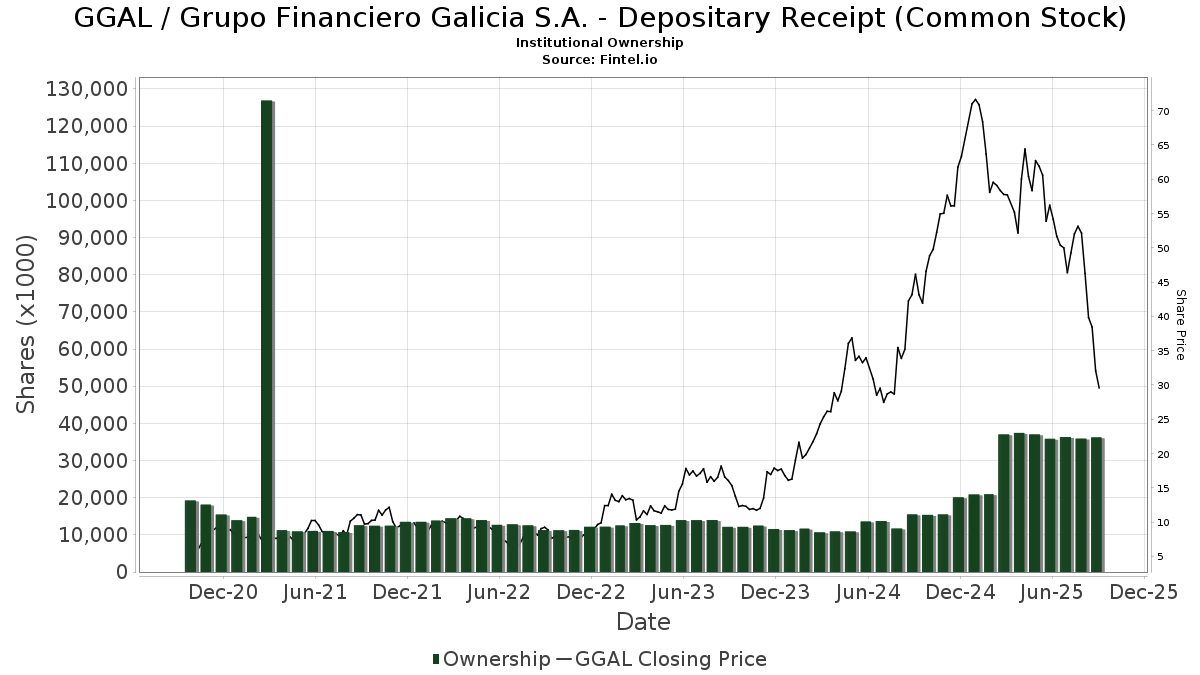
Kepemilikan Institusional dan Pemegang Saham
Grupo Financiero Galicia S.A. - Depositary Receipt (Common Stock) (US:GGAL) memiliki 255 pemilik institusional dan pemegang saham yang telah mengajukan formulir 13D/G atau 13F kepada Komisi Bursa Efek (Securities Exchange Commission/SEC). Lembaga-lembaga ini memegang total 36,223,402 saham. Pemegang saham terbesar meliputi GQG Partners LLC, GQGPX - GQG PARTNERS EMERGING MARKETS EQUITY FUND Investor Shares, MIRAE ASSET GLOBAL ETFS HOLDINGS Ltd., Price T Rowe Associates Inc /md/, PointState Capital LP, Axiom International Investors Llc /de, ARGT - Global X MSCI Argentina ETF, Morgan Stanley, Capital World Investors, and Driehaus Capital Management Llc .
Struktur kepemilikan institusional Grupo Financiero Galicia S.A. - Depositary Receipt (Common Stock) (NasdaqCM:GGAL) menunjukkan posisi terkini di perusahaan oleh institusi dan dana, serta perubahan terbaru dalam ukuran posisi. Pemegang saham utama dapat mencakup investor individu, reksa dana, dana lindung nilai, atau institusi. Jadwal 13D menunjukkan bahwa investor memegang (atau pernah memegang) lebih dari 5% saham perusahaan dan bermaksud (atau pernah bermaksud) untuk secara aktif mengejar perubahan strategi bisnis. Jadwal 13G menunjukkan investasi pasif lebih dari 5%.
The share price as of September 5, 2025 is 40.10 / share. Previously, on September 9, 2024, the share price was 42.29 / share. This represents a decline of 5.18% over that period.
Skor Sentimen Dana
Skor Sentimen Dana (sebelumnya dikenal sebagai Skor Akumulasi Kepemilikan) menemukan saham-saham yang paling banyak dibeli oleh dana. Ini adalah hasil dari model kuantitatif multi-faktor yang canggih yang mengidentifikasi perusahaan dengan tingkat akumulasi institusional tertinggi. Model penilaian menggunakan kombinasi dari total peningkatan pemilik yang diungkapkan, perubahan dalam alokasi portofolio pada pemilik tersebut, dan metrik lainnya. Angka berkisar dari 0 hingga 100, dengan angka yang lebih tinggi menunjukkan tingkat akumulasi yang lebih tinggi dibandingkan dengan perusahaan sejenisnya, dan 50 adalah rata-ratanya.
Frekuensi Pembaruan: Setiap Hari
Lihat Ownership Explorer, yang menyediakan daftar perusahaan dengan peringkat tertinggi.
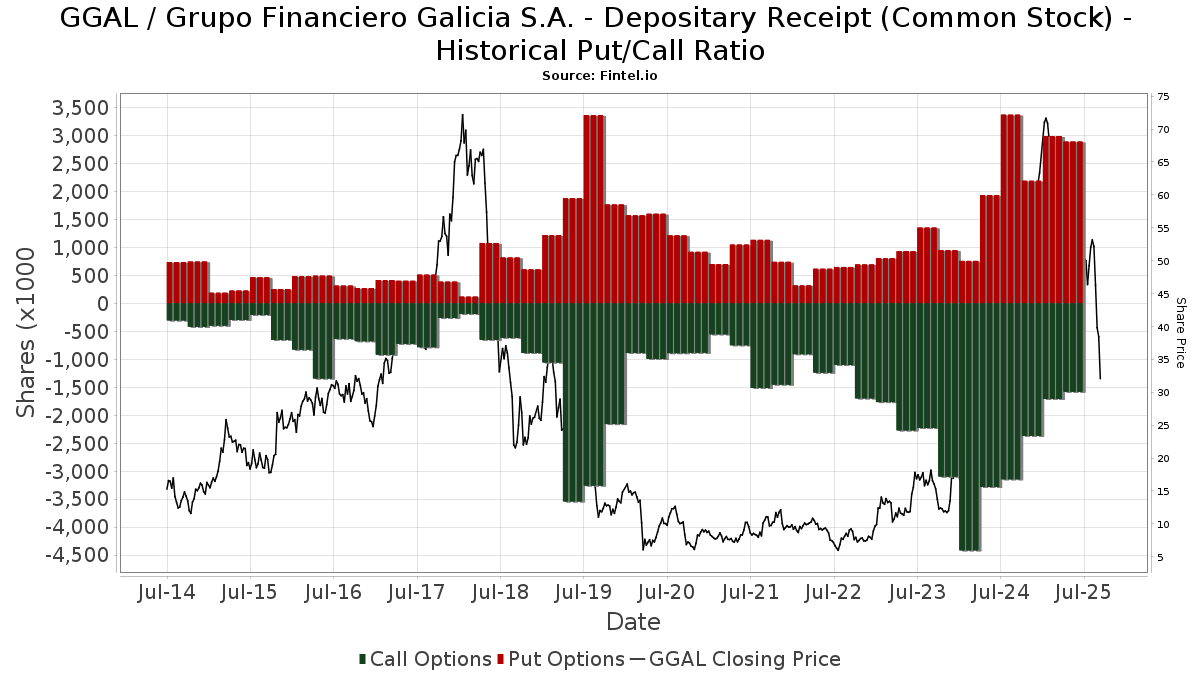
Rasio Put/Call Institusional
Selain melaporkan isu ekuitas dan utang standar, institusi dengan aset di bawah manajemen lebih dari 100 juta dolar AS juga harus mengungkapkan kepemilikan opsi put dan call mereka. Karena opsi put umumnya menunjukkan sentimen negatif, dan opsi call menunjukkan sentimen positif, kita dapat mengetahui sentimen institusional secara keseluruhan dengan memplot rasio put terhadap call. Grafik di sebelah kanan memplot rasio put/call historis untuk instrumen ini.
Menggunakan Rasio Put/Call sebagai indikator sentimen investor mengatasi salah satu kekurangan utama dari penggunaan total kepemilikan institusional, yaitu sejumlah besar aset yang dikelola diinvestasikan secara pasif untuk melacak indeks. Dana yang dikelola secara pasif biasanya tidak membeli opsi, sehingga indikator rasio put/call lebih akurat dalam melacak sentimen dana yang dikelola secara aktif.
Pengajuan 13D/G
Kami menyajikan pengajuan 13D/G secara terpisah dari pengajuan 13F karena perlakuan yang berbeda oleh SEC. Pengajuan 13D/G dapat diajukan oleh kelompok investor (dengan satu pemimpin), sedangkan pengajuan 13F tidak bisa. Hal ini mengakibatkan situasi di mana seorang investor dapat mengajukan 13D/G yang melaporkan satu nilai untuk total saham (mewakili semua saham yang dimiliki oleh kelompok investor), tetapi kemudian mengajukan 13F yang melaporkan nilai yang berbeda untuk total saham (mewakili kepemilikan mereka sendiri). Ini berarti bahwa kepemilikan saham dari pengajuan 13D/G dan pengajuan 13F seringkali tidak dapat dibandingkan secara langsung, sehingga kami menyajikannya secara terpisah.
Catatan: Mulai 16 Mei 2021, kami tidak lagi menampilkan pemilik yang belum mengajukan 13D/G dalam setahun terakhir. Sebelumnya, kami menampilkan riwayat lengkap pengajuan 13D/G. Secara umum, entitas yang diwajibkan untuk mengajukan pengajuan 13D/G harus mengajukan setidaknya setiap tahun sebelum mengirimkan pengajuan penutupan. Namun, terkadang dana keluar dari posisi tanpa mengirimkan pengajuan penutupan (misalnya, mereka menghentikan operasi), sehingga menampilkan riwayat lengkap terkadang menyebabkan kebingungan tentang kepemilikan saat ini. Untuk mencegah kebingungan, kami sekarang hanya menampilkan pemilik 'saat ini' - yaitu - pemilik yang telah mengajukan dalam setahun terakhir.
Upgrade to unlock premium data.
| Tanggal File | Formulir | Investor | Sebelumnya Saham |
Terbaru Saham |
Δ Saham (Persen) |
Kepemilikan (Persen) |
Δ Pagmamay-ari (Persen) |
|
|---|---|---|---|---|---|---|---|---|
| 2025-06-20 | HSBC HOLDINGS PLC | 115,064,730 | 1,163,480 | -98.99 | 0.10 | -98.86 |
Pengajuan 13F dan NPORT
Detail pada pengajuan 13F tersedia gratis. Detail pada pengajuan NP memerlukan keanggotaan premium. Baris berwarna hijau menunjukkan posisi baru. Baris berwarna merah menunjukkan posisi yang sudah ditutup. Klik tautan ini ikon untuk melihat riwayat transaksi selengkapnya.
Tingkatkan
untuk membuka data premium dan mengekspor ke Excel ![]() .
.
| Tanggal File | Sumber | Investor | Ketik | Presyo ng Avg (Silangan) |
Saham | Δ Saham (%) |
Dilaporkan Nilai ($1000) |
Nilai Δ (%) |
Alokasi Port (%) |
|
|---|---|---|---|---|---|---|---|---|---|---|
| 2025-08-12 | 13F | LPL Financial LLC | 23,721 | 200.91 | 1,195 | 178.55 | ||||
| 2025-05-29 | NP | GBEMX - Victory Sophus Emerging Markets Fund Class A | 25,410 | 1,384 | ||||||
| 2025-05-29 | NP | SEASONS SERIES TRUST - SA Putnam Asset Allocation Diversified Growth Portfolio Class 1 | 637 | 76.45 | 35 | 54.55 | ||||
| 2025-08-11 | 13F | Dorsey Wright & Associates | 53,980 | -38.70 | 2,720 | -43.29 | ||||
| 2025-06-23 | NP | Global Macro Absolute Return Advantage Portfolio - Global Macro Absolute Return Advantage Portfolio | 68,050 | 19.39 | 4,110 | 6.86 | ||||
| 2025-05-15 | 13F | Parallax Volatility Advisers, L.P. | Call | 0 | -100.00 | 0 | ||||
| 2025-07-14 | 13F | Ridgewood Investments LLC | 100 | 0.00 | 5 | 0.00 | ||||
| 2025-07-15 | 13F | Burns Matteson Capital Management, LLC | 6,340 | 39.56 | 319 | 29.15 | ||||
| 2025-05-15 | 13F | Parallax Volatility Advisers, L.P. | Put | 0 | -100.00 | 0 | ||||
| 2025-08-14 | 13F | Integrated Wealth Concepts LLC | 9,511 | 479 | ||||||
| 2025-07-22 | 13F | Gsa Capital Partners Llp | 4,979 | 0 | ||||||
| 2025-08-14 | 13F | Fmr Llc | 17 | 0.00 | 1 | |||||
| 2025-06-18 | NP | Putnam ETF Trust - Putnam Emerging Markets ex-China ETF - | 1,318 | 15.92 | 80 | 3.95 | ||||
| 2025-06-25 | NP | RPGEX - T. Rowe Price Global Growth Stock Fund This fund is a listed as child fund of Price T Rowe Associates Inc /md/ and if that institution has disclosed ownership in this security, then these positions will not be double counted when calculating total shares and total value | 93,963 | 6.53 | 5,675 | -4.65 | ||||
| 2025-05-15 | 13F | Tower Research Capital LLC (TRC) | 0 | -100.00 | 0 | |||||
| 2025-06-27 | NP | PCEMX - PACE International Emerging Markets Equity Investments Class P | 4,335 | -48.93 | 262 | -54.37 | ||||
| 2025-07-24 | NP | ONEQ - Fidelity Nasdaq Composite Index Tracking Stock This fund is a listed as child fund of Fmr Llc and if that institution has disclosed ownership in this security, then these positions will not be double counted when calculating total shares and total value | 14,826 | 0.47 | 861 | 1.90 | ||||
| 2025-05-29 | NP | PAEAX - Putnam Dynamic Asset Allocation Growth Fund Class A shares | 8,440 | 84.28 | 460 | 61.05 | ||||
| 2025-05-07 | 13F | Nkcfo Llc | 0 | -100.00 | 0 | |||||
| 2025-08-12 | 13F | Stelac Advisory Services LLC | 12,200 | 0.00 | 615 | -7.53 | ||||
| 2025-08-27 | NP | RYKIX - Banking Fund Investor Class | 4,195 | 29.04 | 211 | 19.21 | ||||
| 2025-08-01 | 13F | Jennison Associates Llc | 683,645 | -37.01 | 34,449 | -41.73 | ||||
| 2025-05-09 | 13F | JGP Global Gestao de Recursos Ltda. | 0 | -100.00 | 0 | |||||
| 2025-07-21 | 13F | Ping Capital Management, Inc. | 380,859 | -0.08 | 19,191 | -7.56 | ||||
| 2025-07-25 | 13F | NorthRock Partners, LLC | 6,066 | -0.02 | 306 | -7.58 | ||||
| 2025-05-05 | 13F | Ping Capital Management, Inc. | Call | 0 | -100.00 | 0 | -100.00 | |||
| 2025-08-14 | 13F | FIL Ltd | 0 | -100.00 | 0 | |||||
| 2025-07-18 | 13F | Truist Financial Corp | 7,891 | -3.00 | 398 | -10.38 | ||||
| 2025-08-01 | 13F | Envestnet Asset Management Inc | 45,463 | -3.55 | 2,291 | -10.79 | ||||
| 2025-08-08 | 13F | Wrapmanager Inc | 5,502 | -4.46 | 277 | -11.50 | ||||
| 2025-08-14 | 13F | Jane Street Group, Llc | Put | 75,900 | -55.82 | 3,825 | -59.13 | |||
| 2025-08-29 | NP | XC - WisdomTree Emerging Markets ex-China Fund N/A | 1,537 | 12.44 | 77 | 4.05 | ||||
| 2025-08-14 | 13F | Jane Street Group, Llc | Call | 200,000 | 9.89 | 10,078 | 1.66 | |||
| 2025-08-14 | 13F | Verition Fund Management LLC | 60,154 | 3,031 | ||||||
| 2025-07-29 | 13F | INCA Investments LLC | 1,069,878 | -2.60 | 53,911 | -9.90 | ||||
| 2025-07-29 | NP | RBB FUND, INC. - Aquarius International Fund | 13,272 | 77.96 | 770 | 80.75 | ||||
| 2025-08-14 | 13F | Jane Street Group, Llc | 989,585 | 5,165.15 | 49,865 | 4,774.39 | ||||
| 2025-07-17 | 13F | Park Place Capital Corp | 89 | 4 | ||||||
| 2025-08-08 | 13F | Fiera Capital Corp | 110,236 | 5,555 | ||||||
| 2025-05-15 | 13F | Compass Group Llc | 0 | -100.00 | 0 | |||||
| 2025-08-13 | 13F | Capital Fund Management S.a. | 0 | -100.00 | 0 | -100.00 | ||||
| 2025-08-07 | 13F | Mitsubishi UFJ Kokusai Asset Management Co., Ltd. | 0 | -100.00 | 0 | |||||
| 2025-08-14 | 13F | UBS Group AG | 60,406 | -13.87 | 3,044 | -20.34 | ||||
| 2025-05-15 | 13F | Glenmede Trust Co Na | 6,347 | 1.12 | 346 | -11.76 | ||||
| 2025-06-26 | NP | JIJIX - John Hancock International Dynamic Growth Fund Class NAV | 242,490 | -1.65 | 14,646 | -11.97 | ||||
| 2025-08-28 | NP | IDVO - Amplify International Enhanced Dividend Income ETF | 58,423 | 151.30 | 2,944 | 132.46 | ||||
| 2025-05-15 | 13F | Hood River Capital Management LLC | 0 | -100.00 | 0 | |||||
| 2025-08-14 | 13F | Brevan Howard Capital Management LP | 125,280 | 83.06 | 6,560 | 80.52 | ||||
| 2025-08-14 | 13F | UBS Group AG | Call | 98,000 | -18.33 | 4,938 | -24.45 | |||
| 2025-08-08 | 13F | Geode Capital Management, Llc | 54,525 | 0.67 | 2,748 | -6.88 | ||||
| 2025-08-13 | 13F | Northwestern Mutual Wealth Management Co | 0 | -100.00 | 0 | |||||
| 2025-08-14 | 13F | UBS Group AG | Put | 35,000 | 1,764 | |||||
| 2025-08-12 | 13F | Personal Cfo Solutions, Llc | 7,247 | 0.06 | 365 | -7.36 | ||||
| 2025-08-22 | NP | Columbia Funds Variable Series Trust II - Columbia Variable Portfolio - Emerging Markets Fund Class 3 | 46,824 | 0.00 | 2,359 | -7.49 | ||||
| 2025-08-14 | 13F | Headlands Technologies LLC | 423 | 21 | ||||||
| 2025-05-15 | 13F | Point72 (DIFC) Ltd | 0 | -100.00 | 0 | -100.00 | ||||
| 2025-08-14 | 13F | Van Eck Associates Corp | 104,614 | 5 | ||||||
| 2025-07-18 | 13F | La Banque Postale Asset Management SA | 12,300 | 44.71 | 620 | 33.98 | ||||
| 2025-08-14 | 13F | Seldon Capital Lp | 45,636 | 2,300 | ||||||
| 2025-08-25 | NP | AADR - AdvisorShares Dorsey Wright ADR ETF | 37,253 | 16.65 | 1,877 | 7.94 | ||||
| 2025-08-05 | 13F | Bank of New York Mellon Corp | 31,825 | 3.03 | 1,604 | -4.70 | ||||
| 2025-08-14 | 13F | Peak6 Llc | Call | 93,300 | 48.10 | 4,701 | 37.02 | |||
| 2025-07-09 | 13F | Systrade AG | 15,167 | 49.18 | 764 | 38.16 | ||||
| 2025-06-23 | NP | Global Macro Capital Opportunities Portfolio - Global Macro Capital Opportunities Portfolio | 284,925 | 92.26 | 17,209 | 72.09 | ||||
| 2025-08-14 | 13F | Moneda S.A. Administradora General de Fondos | 66,660 | 3,359 | ||||||
| 2025-08-12 | 13F | Global Retirement Partners, LLC | 199 | 10 | ||||||
| 2025-08-14 | 13F | BTG Pactual Asset Management US LLC | 8,577 | -26.31 | 432 | -31.86 | ||||
| 2025-08-14 | 13F | Peak6 Llc | Put | 38,200 | -57.46 | 1,925 | -60.66 | |||
| 2025-07-24 | 13F | Ramirez Asset Management, Inc. | 48,818 | 98.07 | 2,460 | 83.23 | ||||
| 2025-08-05 | 13F | Claro Advisors LLC | 0 | -100.00 | 0 | |||||
| 2025-08-13 | 13F | Hsbc Holdings Plc | 103,715 | -99.12 | 5,313 | -99.18 | ||||
| 2025-08-27 | NP | RYDEX VARIABLE TRUST - Banking Fund Variable Annuity | 925 | 120.24 | 47 | 109.09 | ||||
| 2025-06-25 | NP | IMRFX - Columbia Global Opportunities Fund Class A | 3,171 | 1.12 | 192 | -9.48 | ||||
| 2025-08-12 | 13F | Virtu Financial LLC | 13,561 | 1 | ||||||
| 2025-08-14 | 13F | Gemsstock Ltd. | 337,302 | 0.96 | 16,997 | -6.60 | ||||
| 2025-08-27 | 13F/A | Brinker Capital Investments, LLC | 7,661 | 386 | ||||||
| 2025-07-31 | 13F | Cambridge Investment Research Advisors, Inc. | 13,105 | 1 | ||||||
| 2025-06-26 | NP | EMQAX - Ashmore Emerging Markets Active Equity Fund CLASS A | 3,466 | 131.38 | 209 | 106.93 | ||||
| 2025-08-14 | 13F | Lazard Asset Management Llc | 65,133 | 3 | ||||||
| 2025-07-29 | 13F | William Blair Investment Management, Llc | 1,028,488 | -4.44 | 51,838 | -11.58 | ||||
| 2025-08-14 | 13F | Diversify Wealth Management, Llc | 42,705 | 14.54 | 2,229 | -2.75 | ||||
| 2025-08-14 | 13F | Graham Capital Management, L.P. | 15,986 | 265.14 | 806 | 238.24 | ||||
| 2025-08-13 | 13F | Jump Financial, LLC | 0 | -100.00 | 0 | |||||
| 2025-05-15 | 13F | Old Mission Capital Llc | 0 | -100.00 | 0 | -100.00 | ||||
| 2025-08-06 | 13F | Fox Run Management, L.l.c. | 0 | -100.00 | 0 | |||||
| 2025-08-13 | 13F | EverSource Wealth Advisors, LLC | 2,419 | 4.00 | 122 | -3.97 | ||||
| 2025-08-08 | 13F | Cetera Investment Advisers | 11,824 | 1.95 | 596 | -5.71 | ||||
| 2025-07-25 | NP | Putnam Funds Trust - Putnam Emerging Markets Equity Fund Class A | 22,345 | -12.48 | 1,297 | -11.16 | ||||
| 2025-08-14 | 13F | Ameriprise Financial Inc | 346,704 | -7.30 | 17,470 | -14.25 | ||||
| 2025-08-25 | NP | AMERICAN FUNDS INSURANCE SERIES - New World Fund Class 1 This fund is a listed as child fund of Capital World Investors and if that institution has disclosed ownership in this security, then these positions will not be double counted when calculating total shares and total value | 55,124 | 57.77 | 2,778 | 45.93 | ||||
| 2025-08-14 | 13F | Soros Fund Management Llc | 228,252 | 11,502 | ||||||
| 2025-08-12 | 13F | Jpmorgan Chase & Co | 75,302 | 93.20 | 3,794 | 78.71 | ||||
| 2025-06-25 | NP | PRIJX - T. Rowe Price Emerging Markets Discovery Stock Fund This fund is a listed as child fund of Price T Rowe Associates Inc /md/ and if that institution has disclosed ownership in this security, then these positions will not be double counted when calculating total shares and total value | 285,211 | -21.67 | 17,227 | -29.89 | ||||
| 2025-08-01 | 13F | Shilanski & Associates, Inc. | 7,983 | 0.08 | 402 | -7.37 | ||||
| 2025-08-14 | 13F | Point72 Asset Management, L.P. | 71,011 | 256.50 | 3,578 | 230.07 | ||||
| 2025-08-14 | 13F | Point72 Asset Management, L.P. | Call | 12,900 | 0.00 | 650 | -7.41 | |||
| 2025-08-14 | 13F | Point72 Asset Management, L.P. | Put | 12,400 | 625 | |||||
| 2025-08-25 | 13F/A | Neuberger Berman Group LLC | 73,896 | 3,731 | ||||||
| 2025-06-23 | NP | Global Macro Portfolio - Global Macro Portfolio | 17,186 | 13.07 | 1,038 | 1.27 | ||||
| 2025-08-13 | 13F | Russell Investments Group, Ltd. | 184,026 | -11.00 | 9,273 | -17.66 | ||||
| 2025-08-14 | 13F | Citadel Advisors Llc | Put | 551,500 | 61.73 | 27,790 | 49.62 | |||
| 2025-08-27 | 13F/A | Squarepoint Ops LLC | Call | 0 | -100.00 | 0 | ||||
| 2025-08-27 | 13F/A | Squarepoint Ops LLC | Put | 0 | -100.00 | 0 | ||||
| 2025-08-12 | 13F | Handelsbanken Fonder AB | 46,479 | 66.12 | 2 | 100.00 | ||||
| 2025-08-14 | 13F | Citadel Advisors Llc | 291,728 | 17.52 | 14,700 | 8.72 | ||||
| 2025-08-14 | 13F | Citadel Advisors Llc | Call | 113,100 | -51.89 | 5,699 | -55.49 | |||
| 2025-05-06 | 13F | Y-Intercept (Hong Kong) Ltd | 0 | -100.00 | 0 | |||||
| 2025-08-12 | 13F | Insigneo Advisory Services, Llc | 40,648 | 112.86 | 2,048 | 96.92 | ||||
| 2025-08-28 | NP | GQGPX - GQG PARTNERS EMERGING MARKETS EQUITY FUND Investor Shares | 2,040,261 | 102,809 | ||||||
| 2025-08-13 | 13F | Polen Capital Management Llc | 39,394 | 1,985 | ||||||
| 2025-08-13 | 13F | Victory Capital Management Inc | 11,877 | -91.03 | 598 | -91.70 | ||||
| 2025-08-13 | 13F | Northern Trust Corp | 12,176 | -86.35 | 614 | -87.38 | ||||
| 2025-08-12 | 13F | Proequities, Inc. | Put | 0 | 0 | |||||
| 2025-08-12 | 13F | Proequities, Inc. | Call | 0 | 0 | |||||
| 2025-08-12 | 13F | Proequities, Inc. | 0 | 0 | ||||||
| 2025-04-22 | 13F | Channing Global Advisors, Llc | 0 | -100.00 | 0 | |||||
| 2025-08-13 | 13F | Townsquare Capital Llc | 0 | -100.00 | 0 | |||||
| 2025-04-28 | 13F | Redmont Wealth Advisors Llc | 180 | 10 | ||||||
| 2025-05-09 | 13F | R Squared Ltd | 0 | -100.00 | 0 | |||||
| 2025-07-11 | 13F | Diversified Trust Co | 8,200 | 413 | ||||||
| 2025-08-13 | 13F | Invesco Ltd. | 40,072 | -0.69 | 2,019 | -8.10 | ||||
| 2025-08-14 | 13F | D. E. Shaw & Co., Inc. | Call | 12,500 | -85.80 | 630 | -86.88 | |||
| 2025-05-13 | 13F | Quadrature Capital Ltd | 0 | -100.00 | 0 | |||||
| 2025-08-13 | 13F | RWC Asset Management LLP | 242,772 | 447.59 | 12,233 | 406.75 | ||||
| 2025-05-16 | 13F | Empowered Funds, LLC | 0 | -100.00 | 0 | |||||
| 2025-06-25 | NP | PRLAX - T. Rowe Price Latin America Fund This fund is a listed as child fund of Price T Rowe Associates Inc /md/ and if that institution has disclosed ownership in this security, then these positions will not be double counted when calculating total shares and total value | 26,998 | 1.12 | 1,631 | -9.49 | ||||
| 2025-08-07 | 13F | NS Partners Ltd | 192,900 | 9,720 | ||||||
| 2025-05-08 | NP | QGBLX - Quantified Global Fund Investor Class | 1,098 | 272.20 | 60 | 227.78 | ||||
| 2025-08-21 | NP | GBFAX - Emerging Markets Fund Class A | 68,957 | 3,475 | ||||||
| 2025-07-30 | 13F | Blume Capital Management, Inc. | 1,004 | 0.00 | 51 | -7.41 | ||||
| 2025-08-13 | 13F | Carmignac Gestion | 77,070 | -44.57 | 3,889 | -48.68 | ||||
| 2025-08-27 | NP | Jnl Series Trust - Jnl/lazard Emerging Markets Fund (a) | 45,723 | 82.74 | 2,304 | 69.09 | ||||
| 2025-05-05 | 13F | Eagle Bay Advisors LLC | 0 | -100.00 | 0 | |||||
| 2025-08-06 | 13F | Agf Management Ltd | 251,275 | 12,662 | ||||||
| 2025-05-13 | 13F | Alliance Wealth Advisors, LLC /UT | 0 | -100.00 | 0 | |||||
| 2025-08-07 | 13F | Fourth Sail Capital LP | 0 | -100.00 | 0 | |||||
| 2025-08-14 | 13F | Two Sigma Investments, Lp | 23,805 | -84.40 | 1,200 | -85.58 | ||||
| 2025-07-11 | 13F | Farther Finance Advisors, LLC | 100 | 66.67 | 5 | 66.67 | ||||
| 2025-08-12 | 13F | Deutsche Bank Ag\ | 22,500 | -18.18 | 1,134 | -24.32 | ||||
| 2025-08-08 | 13F | Financial Gravity Companies, Inc. | 12 | 0.00 | 1 | |||||
| 2025-08-14 | 13F/A | Barclays Plc | 20,730 | 242.08 | 1 | |||||
| 2025-08-12 | 13F | Ci Investments Inc. | 760,319 | 335.89 | 38 | 322.22 | ||||
| 2025-08-04 | 13F | AdvisorShares Investments LLC | 37,253 | 16.65 | 1,877 | 6.47 | ||||
| 2025-08-12 | 13F | MAI Capital Management | 4 | 0 | ||||||
| 2025-08-14 | 13F | Susquehanna International Group, Llp | 134,045 | 187.12 | 6,755 | 165.70 | ||||
| 2025-08-14 | 13F | Susquehanna International Group, Llp | Call | 572,300 | -6.88 | 28,838 | -13.86 | |||
| 2025-08-14 | 13F | Engineers Gate Manager LP | 10,273 | -67.25 | 518 | -69.73 | ||||
| 2025-08-14 | 13F | D. E. Shaw & Co., Inc. | Put | 0 | -100.00 | 0 | -100.00 | |||
| 2025-08-14 | 13F | Discovery Capital Management, Llc / Ct | 500,000 | -50.39 | 25,195 | -54.10 | ||||
| 2025-08-14 | 13F | Susquehanna International Group, Llp | Put | 968,000 | -7.27 | 48,778 | -14.22 | |||
| 2025-08-19 | 13F | National Asset Management, Inc. | 0 | -100.00 | 0 | |||||
| 2025-08-20 | NP | WXCIX - William Blair Emerging Markets ex China Growth Fund Class I | 5,488 | -11.08 | 277 | -17.86 | ||||
| 2025-08-14 | 13F | Burkehill Global Management, LP | 200,000 | 10,078 | ||||||
| 2025-08-11 | 13F | HighTower Advisors, LLC | 11,379 | 573 | ||||||
| 2025-08-14 | 13F | Wellington Management Group Llp | 637,501 | 32,124 | ||||||
| 2025-06-18 | NP | RAZAX - Multi-Asset Growth Strategy Fund Class A | 609 | -75.88 | 37 | -78.82 | ||||
| 2025-08-13 | 13F | Schroder Investment Management Group | 0 | -100.00 | 0 | |||||
| 2025-07-10 | 13F | Baader Bank INC | 5,386 | -13.82 | 264 | -21.96 | ||||
| 2025-08-13 | 13F | Walleye Capital LLC | Call | 11,000 | 1.85 | 554 | -5.78 | |||
| 2025-07-23 | 13F | Vontobel Holding Ltd. | 4,136 | 0.00 | 208 | -7.56 | ||||
| 2025-08-11 | 13F | Citigroup Inc | 20,413 | 34.69 | 1,029 | 24.61 | ||||
| 2025-08-14 | 13F | Glenmede Investment Management, LP | 6,347 | 320 | ||||||
| 2025-08-13 | 13F | Arrowstreet Capital, Limited Partnership | 1,066,605 | -6.16 | 53,746 | -13.19 | ||||
| 2025-05-29 | NP | PUTNAM VARIABLE TRUST - Putnam VT International Growth Fund Class IA Shares | 1,667 | 84.81 | 91 | 60.71 | ||||
| 2025-08-13 | 13F | Walleye Capital LLC | Put | 5,100 | 1,175.00 | 257 | 1,119.05 | |||
| 2025-08-14 | 13F | Wells Fargo & Company/mn | 12,406 | 473.03 | 625 | 434.19 | ||||
| 2025-05-29 | NP | VICTORY VARIABLE INSURANCE FUNDS - Victory Sophus Emerging Markets VIP Series Class I | 1,952 | 106 | ||||||
| 2025-08-08 | 13F | SBI Securities Co., Ltd. | 1,202 | 240.51 | 61 | 215.79 | ||||
| 2025-08-11 | 13F | Absolute Gestao de Investimentos Ltda. | 9,500 | -75.95 | 479 | -77.78 | ||||
| 2025-08-26 | NP | DREGX - DRIEHAUS EMERGING MARKETS GROWTH FUND Investor Share Class | 501,475 | 86.26 | 25,269 | 72.32 | ||||
| 2025-06-27 | NP | EAEMX - Parametric Emerging Markets Fund Investor Class | 2,555 | 1.11 | 154 | -9.41 | ||||
| 2025-04-30 | 13F | Sofos Investments, Inc. | 12 | 1 | ||||||
| 2025-08-12 | 13F | SPX Equities Gestao de Recursos Ltda | 368,261 | 66.10 | 18,557 | 53.66 | ||||
| 2025-08-14 | 13F | Cubist Systematic Strategies, LLC | Call | 3,100 | -87.70 | 156 | -88.63 | |||
| 2025-08-25 | NP | MEMX - Matthews Emerging Markets ex China Active ETF | 5,996 | 302 | ||||||
| 2025-08-14 | 13F | Cubist Systematic Strategies, LLC | 157,089 | -29.52 | 7,916 | -34.80 | ||||
| 2025-08-13 | 13F | Options Solutions, Llc | 25,986 | -7.90 | 1,309 | -14.78 | ||||
| 2025-07-18 | 13F | Deltec Asset Management Llc | 19,300 | 183.41 | 973 | 162.70 | ||||
| 2025-08-14 | 13F | Group One Trading, L.p. | 228,898 | 119.16 | 11,534 | 102.74 | ||||
| 2025-08-27 | 13F/A | Squarepoint Ops LLC | 15,019 | 757 | ||||||
| 2025-07-25 | 13F | Cwm, Llc | 91 | 0.00 | 0 | |||||
| 2025-08-15 | 13F | Duquesne Family Office LLC | 231,481 | -39.32 | 12 | -45.00 | ||||
| 2025-08-14 | 13F | Group One Trading, L.p. | Put | 555,500 | 117.08 | 27,992 | 100.83 | |||
| 2025-08-14 | 13F | Balyasny Asset Management Llc | Put | 7,000 | 353 | |||||
| 2025-08-14 | 13F | Group One Trading, L.p. | Call | 160,000 | 0.44 | 8,062 | -7.09 | |||
| 2025-08-14 | 13F | Millennium Management Llc | 345,014 | -4.29 | 17,385 | -11.46 | ||||
| 2025-08-04 | 13F | Atria Investments Llc | 13,196 | -1.34 | 665 | -8.79 | ||||
| 2025-05-15 | 13F | Ancient Art, L.P. | 0 | -100.00 | 0 | |||||
| 2025-05-15 | 13F | Rokos Capital Management LLP | Put | 0 | -100.00 | 0 | -100.00 | |||
| 2025-08-11 | 13F | Rwc Asset Advisors (us) Llc | 162,452 | -28.58 | 8,186 | -33.94 | ||||
| 2025-08-14 | 13F | Driehaus Capital Management Llc | 1,095,098 | 74.36 | 55,182 | 61.30 | ||||
| 2025-08-12 | 13F | Edmond De Rothschild Holding S.a. | 7,880 | -14.16 | 397 | -20.60 | ||||
| 2025-08-14 | 13F | Stifel Financial Corp | 18,497 | -5.41 | 932 | -12.49 | ||||
| 2025-08-14 | 13F | Millennium Management Llc | Put | 14,100 | -14.55 | 710 | -20.94 | |||
| 2025-05-15 | 13F | Amundi | 0 | -100.00 | 0 | |||||
| 2025-05-07 | 13F | Marvin & Palmer Associates Inc | 0 | -100.00 | 0 | |||||
| 2025-05-13 | 13F | Moerus Capital Management LLC | 0 | -100.00 | 0 | |||||
| 2025-08-14 | 13F | Tudor Investment Corp Et Al | Call | 25,500 | -32.72 | 1,285 | -37.79 | |||
| 2025-08-14 | 13F | Tudor Investment Corp Et Al | Put | 7,200 | -89.80 | 363 | -90.59 | |||
| 2025-04-14 | 13F | IMC-Chicago, LLC | Call | 0 | -100.00 | 0 | -100.00 | |||
| 2025-08-14 | 13F | Balyasny Asset Management Llc | 30,526 | 268.23 | 1,538 | 241.02 | ||||
| 2025-08-14 | 13F | Barometer Capital Management Inc. | 6,884 | -45.73 | 346 | -50.00 | ||||
| 2025-08-14 | 13F | Balyasny Asset Management Llc | Call | 7,300 | 368 | |||||
| 2025-07-25 | NP | USEMX - Emerging Markets Fund Shares | 16,751 | 972 | ||||||
| 2025-04-14 | 13F | IMC-Chicago, LLC | 0 | -100.00 | 0 | -100.00 | ||||
| 2025-05-15 | 13F | Jain Global LLC | 0 | -100.00 | 0 | |||||
| 2025-08-14 | 13F | Voloridge Investment Management, Llc | 298,935 | 15,063 | ||||||
| 2025-08-27 | NP | JNL SERIES TRUST - JNL/GQG Emerging Markets Equity Fund (A) | 76,898 | 3,875 | ||||||
| 2025-06-18 | NP | RTNAX - Tax-Managed International Equity Fund Class A | 30,645 | -33.05 | 1,851 | -40.09 | ||||
| 2025-05-13 | 13F | Stokes Family Office, LLC | 0 | -100.00 | 0 | |||||
| 2025-08-14 | 13F | Benjamin Edwards Inc | 6,054 | 2.18 | 305 | -5.28 | ||||
| 2025-08-14 | 13F | Raymond James Financial Inc | 3,001 | 151 | ||||||
| 2025-07-30 | 13F | Whittier Trust Co Of Nevada Inc | 6,881 | 63.17 | 347 | 51.09 | ||||
| 2025-07-30 | 13F | Whittier Trust Co | 13,842 | 11.63 | 697 | 3.26 | ||||
| 2025-07-09 | 13F | Crocodile Capital Partners GmbH | 10,000 | 0.00 | 504 | -7.54 | ||||
| 2025-08-13 | 13F | Seven Grand Managers, Llc | 200,000 | 10,078 | ||||||
| 2025-08-26 | NP | NMMEX - Active M Emerging Markets Equity Fund | 9,501 | 6.42 | 479 | -1.65 | ||||
| 2025-04-15 | 13F | Assenagon Asset Management S.A. | 0 | -100.00 | 0 | |||||
| 2025-08-27 | NP | Advanced Series Trust - Ast Prudential Growth Allocation Portfolio | 9,741 | -36.54 | 491 | -41.39 | ||||
| 2025-07-30 | 13F | Wallace Advisory Group, LLC | 0 | -100.00 | 0 | |||||
| 2025-08-14 | 13F | Price T Rowe Associates Inc /md/ | 1,920,829 | 27.95 | 97 | 18.52 | ||||
| 2025-08-01 | 13F | Banco Santander, S.A. | 37,844 | 13.11 | 1,907 | 4.61 | ||||
| 2025-07-25 | NP | EEMAX - Columbia Emerging Markets Fund Class A | 77,146 | 0.00 | 4,478 | 1.45 | ||||
| 2025-07-14 | 13F | Painted Porch Advisors LLC | 371 | 0.00 | 19 | -10.00 | ||||
| 2025-08-13 | 13F | Capital World Investors | 1,099,332 | 60.02 | 55,395 | 48.04 | ||||
| 2025-05-05 | 13F | Creekmur Asset Management LLC | 0 | -100.00 | 0 | |||||
| 2025-07-16 | 13F | ABS Direct Equity Fund LLC | 27,648 | 32.98 | 1,393 | 23.06 | ||||
| 2025-08-13 | 13F | Quantbot Technologies LP | 2,129 | -90.06 | 107 | -90.82 | ||||
| 2025-08-14 | 13F | Mariner, LLC | 7,994 | 4.46 | 403 | -3.37 | ||||
| 2025-06-27 | NP | ARGT - Global X MSCI Argentina ETF This fund is a listed as child fund of Mirae Asset Global Investments Co., Ltd. and if that institution has disclosed ownership in this security, then these positions will not be double counted when calculating total shares and total value | 1,260,613 | -11.05 | 76,141 | -20.38 | ||||
| 2025-08-14 | 13F | Cubist Systematic Strategies, LLC | Put | 0 | -100.00 | 0 | ||||
| 2025-08-25 | NP | MMIUX - MassMutual Select T. Rowe Price International Equity Fund Class I | 2,363 | -29.67 | 119 | -34.97 | ||||
| 2025-08-04 | 13F | Spire Wealth Management | 0 | -100.00 | 0 | |||||
| 2025-08-14 | 13F | CoreCap Advisors, LLC | 100 | 0.00 | 5 | 0.00 | ||||
| 2025-08-15 | 13F | Binnacle Investments Inc | 25 | 1 | ||||||
| 2025-08-11 | 13F | TD Waterhouse Canada Inc. | 1 | 0.00 | 0 | |||||
| 2025-07-09 | 13F | Bank of New Hampshire | 4,825 | -75.54 | 243 | -77.37 | ||||
| 2025-08-28 | NP | RWCIX - RWC Global Emerging Equity Fund Class I Shares | 8,389 | -2.24 | 423 | -9.64 | ||||
| 2025-07-30 | 13F | Eqis Capital Management, Inc. | 0 | -100.00 | 0 | |||||
| 2025-06-27 | 13F/A | Goldman Sachs Group Inc | Put | 0 | -100.00 | 0 | -100.00 | |||
| 2025-08-05 | 13F | Simplex Trading, Llc | Put | 49,700 | -49.85 | 3 | -60.00 | |||
| 2025-05-07 | 13F/A | Symmetry Investments LP | Call | 0 | -100.00 | 0 | -100.00 | |||
| 2025-08-05 | 13F | Simplex Trading, Llc | 21,896 | -0.27 | 1 | 0.00 | ||||
| 2025-08-05 | 13F | Simplex Trading, Llc | Call | 40,900 | 85.07 | 2 | 100.00 | |||
| 2025-08-13 | 13F | Guggenheim Capital Llc | 5,120 | 258 | ||||||
| 2025-05-15 | 13F | Canada Pension Plan Investment Board | 0 | -100.00 | 0 | |||||
| 2025-08-14 | 13F | Peak6 Llc | 0 | -100.00 | 0 | |||||
| 2025-07-16 | 13F | ORG Wealth Partners, LLC | 153 | 0.00 | 8 | -12.50 | ||||
| 2025-07-29 | 13F | Activest Wealth Management | 33,728 | 1.75 | 1,700 | -5.87 | ||||
| 2025-08-13 | 13F | Northwest & Ethical Investments L.P. | 10,606 | 0.00 | 534 | -7.45 | ||||
| 2025-08-14 | 13F | CIBC World Markets Inc. | 4,465 | 0.00 | 224 | -7.82 | ||||
| 2025-08-20 | NP | WBENX - William Blair Emerging Markets Growth Fund Class N | 90,482 | -6.35 | 4,559 | -13.38 | ||||
| 2025-07-28 | NP | TEMUX - Emerging Markets Equity Fund | 8,500 | 470.09 | 493 | 4,381.82 | ||||
| 2025-08-14 | 13F/A | Skopos Labs, Inc. | 1,043 | 492.61 | 53 | 477.78 | ||||
| 2025-08-08 | 13F | Itau Unibanco Holding S.A. | 893,965 | 90.50 | 45,047 | 187,591.67 | ||||
| 2025-08-13 | 13F | Shelton Capital Management | 0 | -100.00 | 0 | |||||
| 2025-08-13 | 13F | Mirabella Financial Services Llp | 0 | -100.00 | 0 | |||||
| 2025-08-05 | 13F | Advisors Preferred, LLC | 0 | -100.00 | 0 | |||||
| 2025-08-14 | 13F | PointState Capital LP | 1,598,899 | 6.30 | 80,569 | -1.66 | ||||
| 2025-08-14 | 13F | MIRAE ASSET GLOBAL ETFS HOLDINGS Ltd. | 1,937,465 | 52.20 | 97,629 | 40.80 | ||||
| 2025-08-07 | 13F | Capital Wealth Planning, LLC | 30,745 | 32.25 | 1,549 | 22.35 | ||||
| 2025-08-21 | NP | ECEIX - Lazard Emerging Markets Core Equity Portfolio Institutional Shares | 12,149 | 612 | ||||||
| 2025-04-29 | 13F | SMART Wealth LLC | 0 | -100.00 | 0 | |||||
| 2025-07-29 | 13F | Beverly Hills Private Wealth, LLC | 6,869 | -5.61 | 346 | -12.63 | ||||
| 2025-07-28 | NP | NEMAX - Neuberger Berman Emerging Markets Equity Fund Class A | 15,435 | 896 | ||||||
| 2025-08-14 | 13F | Schonfeld Strategic Advisors LLC | 0 | -100.00 | 0 | |||||
| 2025-08-11 | 13F | Principal Securities, Inc. | 0 | -100.00 | 0 | |||||
| 2025-08-12 | 13F | Aigen Investment Management, Lp | 0 | -100.00 | 0 | |||||
| 2025-07-23 | 13F | Ameliora Wealth Management Ltd. | 0 | -100.00 | 0 | |||||
| 2025-07-14 | 13F | GAMMA Investing LLC | 2,532 | -5.94 | 128 | -13.01 | ||||
| 2025-08-19 | 13F | Marex Group plc | 12,451 | 627 | ||||||
| 2025-08-14 | 13F | Goldman Sachs Group Inc | Call | 9,700 | 0.00 | 489 | -7.58 | |||
| 2025-06-18 | NP | REMSX - Emerging Markets Fund Class S | 13,022 | -35.31 | 787 | -42.12 | ||||
| 2025-05-09 | 13F | GeoWealth Management, LLC | 0 | -100.00 | 0 | |||||
| 2025-05-15 | 13F | Scientech Research LLC | 0 | -100.00 | 0 | |||||
| 2025-08-14 | 13F | Goldman Sachs Group Inc | 200,240 | 41.10 | 10,090 | 30.53 | ||||
| 2025-08-15 | 13F | Great West Life Assurance Co /can/ | 217 | -10.33 | 0 | |||||
| 2025-08-26 | NP | MCTOX - Modern Capital Tactical Opportunities Fund Class A Shares | 46,000 | 109.09 | 2,318 | 93.41 | ||||
| 2025-05-14 | 13F | Credit Agricole S A | 1,750 | 0.00 | 95 | -12.84 | ||||
| 2025-08-13 | 13F | Walleye Trading LLC | Call | 108,600 | 334.40 | 5,472 | 302.06 | |||
| 2025-08-14 | 13F | Diversify Advisory Services, LLC | 13,486 | 26.01 | 704 | 7.00 | ||||
| 2025-06-17 | NP | GSEQX - Goldman Sachs Multi-Manager Global Equity Fund Class R6 Shares | 6,356 | -37.44 | 384 | -44.09 | ||||
| 2025-07-11 | 13F | Seacrest Wealth Management, Llc | 9,445 | -1.36 | 476 | -8.83 | ||||
| 2025-07-24 | 13F | Ronald Blue Trust, Inc. | 3,528 | 184.75 | 178 | 164.18 | ||||
| 2025-08-13 | 13F | Walleye Trading LLC | Put | 188,500 | 89.45 | 9,499 | 75.27 | |||
| 2025-08-14 | 13F | Aquatic Capital Management LLC | 0 | -100.00 | 0 | |||||
| 2025-08-13 | 13F | Walleye Trading LLC | 28,547 | 457.45 | 1,438 | 417.27 | ||||
| 2025-08-14 | 13F | Bank Of America Corp /de/ | 125,279 | 117.08 | 6,313 | 100.83 | ||||
| 2025-08-14 | 13F | Nwi Management Lp | 99,312 | 0.00 | 5 | 0.00 | ||||
| 2025-08-14 | 13F | Longaeva Partners L.P. | 12,277 | 619 | ||||||
| 2025-08-13 | 13F | Jones Financial Companies Lllp | 1,562 | 81 | ||||||
| 2025-07-30 | NP | APIE - ActivePassive International Equity ETF | 11,822 | 62.57 | 686 | 64.90 | ||||
| 2025-07-23 | 13F | Triasima Portfolio Management inc. | 6,873 | -6.11 | 346 | -13.07 | ||||
| 2025-07-31 | 13F | Caitong International Asset Management Co., Ltd | 42 | 223.08 | 2 | |||||
| 2025-08-14 | 13F | Bnp Paribas Arbitrage, Sa | 177,635 | -21.72 | 8,951 | -27.58 | ||||
| 2025-08-14 | 13F | State Street Corp | 0 | -100.00 | 0 | |||||
| 2025-06-11 | NP | SEKAX - DWS Emerging Markets Equity Fund Class A | 20,000 | -20.00 | 1,208 | -28.39 | ||||
| 2025-05-15 | 13F | Ewing Morris & Co. Investment Partners Ltd. | 0 | -100.00 | 0 | |||||
| 2025-07-28 | 13F | Bayforest Capital Ltd | 5,332 | 269 | ||||||
| 2025-08-08 | 13F | Pnc Financial Services Group, Inc. | 160 | 0.00 | 8 | 0.00 | ||||
| 2025-08-13 | 13F | Pictet Asset Management Holding SA | 6,306 | -83.24 | 318 | -84.53 | ||||
| 2025-08-14 | 13F | Deprince Race & Zollo Inc | 204,907 | 55.38 | 10,325 | 43.74 | ||||
| 2025-08-14 | 13F | GWM Advisors LLC | 9,003 | 0.00 | 454 | -7.55 | ||||
| 2025-08-14 | 13F | Samlyn Capital, Llc | 437,515 | 22,046 | ||||||
| 2025-07-11 | 13F | Harbour Capital Advisors, LLC | 18,375 | -0.81 | 926 | -6.85 | ||||
| 2025-08-13 | 13F | Marshall Wace, Llp | 105,165 | 5,299 | ||||||
| 2025-08-14 | 13F | Ratan Capital Management LP | 55,000 | -71.79 | 2,771 | -73.91 | ||||
| 2025-08-12 | 13F | Franklin Resources Inc | 0 | -100.00 | 0 | |||||
| 2025-08-15 | 13F | Morgan Stanley | 1,251,697 | 78.29 | 63,073 | 64.94 | ||||
| 2025-08-14 | 13F | Turim 21 Investimentos Ltda. | 17,700 | 0.00 | 892 | -7.57 | ||||
| 2025-08-14 | 13F | Caption Management, LLC | Put | 305,700 | -21.49 | 15,404 | -27.37 | |||
| 2025-08-04 | 13F | Hantz Financial Services, Inc. | 405 | 5,685.71 | 0 | |||||
| 2025-08-18 | 13F | Wolverine Trading, Llc | 0 | -100.00 | 0 | -100.00 | ||||
| 2025-06-24 | NP | Innovator ETFs Trust - Innovator IBD Breakout Opportunities ETF | 903 | 55 | ||||||
| 2025-08-14 | 13F | Caption Management, LLC | 275,708 | 11.40 | 13,893 | 3.05 | ||||
| 2025-08-13 | 13F | Capital Fund Management S.a. | Call | 84,200 | -6.96 | 4,243 | -13.94 | |||
| 2025-08-14 | 13F | Qube Research & Technologies Ltd | 0 | -100.00 | 0 | |||||
| 2025-08-21 | NP | VanEck VIP Trust - VanEck VIP Emerging Markets Fund Initial Class | 15,299 | 771 | ||||||
| 2025-08-29 | NP | XSOE - WisdomTree Emerging Markets ex-State-Owned Enterprises Fund N/A | 29,675 | 1.51 | 1,495 | -6.09 | ||||
| 2025-08-13 | 13F | Capital Fund Management S.a. | Put | 27,700 | -52.32 | 1,396 | -55.91 | |||
| 2025-08-14 | 13F/A | Barclays Plc | Put | 0 | -100.00 | 0 | -100.00 | |||
| 2025-08-14 | 13F | Rokos Capital Management LLP | 110,167 | 0.37 | 5,549 | -7.19 | ||||
| 2025-08-14 | 13F | Royal Bank Of Canada | 1,675 | -11.05 | 85 | -17.48 | ||||
| 2025-07-25 | NP | USAWX - World Growth Fund Shares | 7,856 | 456 | ||||||
| 2025-06-11 | NP | SLANX - DWS Latin America Equity Fund Class A | 48,280 | -51.72 | 2,916 | 143.00 | ||||
| 2025-05-28 | NP | KOMP - SPDR S&P Kensho New Economies Composite ETF This fund is a listed as child fund of State Street Corp and if that institution has disclosed ownership in this security, then these positions will not be double counted when calculating total shares and total value | 66,562 | 2.76 | 3,626 | -10.18 | ||||
| 2025-08-04 | 13F | Yorktown Management & Research Co Inc | 7,450 | 0.00 | 375 | -7.41 | ||||
| 2025-08-07 | 13F | Axiom International Investors Llc /de | 1,442,719 | -1.58 | 72,699 | -8.96 | ||||
| 2025-07-25 | NP | PUTNAM FUNDS TRUST - Putnam Dynamic Asset Allocation Equity Fund Class A | 180 | -11.76 | 10 | -9.09 | ||||
| 2025-08-14 | 13F | Sei Investments Co | 201,141 | -12.86 | 10,135 | -19.39 | ||||
| 2025-08-14 | 13F | Riggs Asset Managment Co. Inc. | 16 | 1 | ||||||
| 2025-06-30 | NP | APITX - Yorktown Growth Fund Class L Shares | 7,450 | 0.00 | 450 | -10.56 | ||||
| 2025-09-04 | 13F/A | Advisor Group Holdings, Inc. | 8,711 | 439 | ||||||
| 2025-07-21 | 13F | Mirae Asset Global Investments Co., Ltd. | 2,369 | 9.73 | 119 | 0.00 | ||||
| 2025-08-07 | NP | OTGAX - OTG Latin America Fund Class A Shares | 4,540 | 229 | ||||||
| 2025-08-12 | 13F | CIBC Private Wealth Group, LLC | 557 | 3.15 | 28 | 16.67 | ||||
| 2025-07-24 | 13F | Verde Servicos Internacionais S.A. | 500 | 0 | ||||||
| 2025-08-14 | 13F | Banco BTG Pactual S.A. | 487,916 | 198.31 | 24,586 | 175.97 | ||||
| 2025-08-13 | 13F | GQG Partners LLC | 3,127,768 | 157,608 | ||||||
| 2025-06-18 | NP | RMYAX - Multi-Strategy Income Fund Class A | 530 | 0.00 | 32 | -8.57 | ||||
| 2025-08-14 | 13F | Tudor Investment Corp Et Al | 0 | -100.00 | 0 | -100.00 | ||||
| 2025-08-12 | 13F | Sagil Capital Llp | 195,000 | 9,826 | ||||||
| 2025-06-26 | NP | NEWFX - NEW WORLD FUND INC Class A | 635,876 | 131.00 | 38,407 | 106.76 | ||||
| 2025-06-26 | NP | PDEAX - PGIM JENNISON EMERGING MARKETS EQUITY OPPORTUNITIES FUND Class A | 477,551 | -10.22 | 28,844 | -19.64 | ||||
| 2025-07-22 | 13F | IMC-Chicago, LLC | Put | 28,000 | 13.82 | 1,411 | 5.30 | |||
| 2025-08-19 | 13F | Anchor Investment Management, LLC | 303 | 0.00 | 15 | -6.25 | ||||
| 2025-07-24 | NP | FNCMX - Fidelity Nasdaq Composite Index Fund This fund is a listed as child fund of Fmr Llc and if that institution has disclosed ownership in this security, then these positions will not be double counted when calculating total shares and total value | 39,505 | 22.52 | 2,293 | 24.28 | ||||
| 2025-06-23 | NP | UBPIX - Ultralatin America Profund Investor Class | 2,387 | 5.02 | 144 | -5.88 | ||||
| 2025-05-09 | 13F | DJE Kapital AG | 0 | -100.00 | 0 | |||||
| 2025-05-15 | 13F | D. E. Shaw & Co., Inc. | 0 | -100.00 | 0 | -100.00 | ||||
| 2025-08-18 | 13F | Wolverine Trading, Llc | Call | 24,300 | 140.59 | 1,256 | 122.91 | |||
| 2025-08-18 | 13F | Wolverine Trading, Llc | Put | 22,800 | -31.33 | 1,178 | -36.36 | |||
| 2025-08-06 | 13F | Commonwealth Equity Services, Llc | 6,467 | 0.09 | 0 | |||||
| 2025-08-14 | 13F | Vident Advisory, LLC | 5,031 | -7.31 | 254 | -14.24 |