Mga Batayang Estadistika
| Pemilik Institusional | 266 total, 252 long only, 0 short only, 14 long/short - change of 0.75% MRQ |
| Alokasi Portofolio Rata-rata | 0.2906 % - change of 22.44% MRQ |
| Saham Institusional (Jangka Panjang) | 19,228,546 (ex 13D/G) - change of -0.54MM shares -2.74% MRQ |
| Nilai Institusional (Jangka Panjang) | $ 990,665 USD ($1000) |
Kepemilikan Institusional dan Pemegang Saham
SPDR Series Trust - SPDR S&P Bank ETF (US:KBE) memiliki 266 pemilik institusional dan pemegang saham yang telah mengajukan formulir 13D/G atau 13F kepada Komisi Bursa Efek (Securities Exchange Commission/SEC). Lembaga-lembaga ini memegang total 19,228,546 saham. Pemegang saham terbesar meliputi Goldman Sachs Group Inc, Two Sigma Investments, Lp, Morgan Stanley, Susquehanna International Group, Llp, UBS Group AG, Schroder Investment Management Group, Bank Of America Corp /de/, UBS Group AG, Avanda Investment Management Pte. Ltd., and Edmond De Rothschild Holding S.a. .
Struktur kepemilikan institusional SPDR Series Trust - SPDR S&P Bank ETF (ARCA:KBE) menunjukkan posisi terkini di perusahaan oleh institusi dan dana, serta perubahan terbaru dalam ukuran posisi. Pemegang saham utama dapat mencakup investor individu, reksa dana, dana lindung nilai, atau institusi. Jadwal 13D menunjukkan bahwa investor memegang (atau pernah memegang) lebih dari 5% saham perusahaan dan bermaksud (atau pernah bermaksud) untuk secara aktif mengejar perubahan strategi bisnis. Jadwal 13G menunjukkan investasi pasif lebih dari 5%.
The share price as of September 5, 2025 is 61.16 / share. Previously, on September 6, 2024, the share price was 51.16 / share. This represents an increase of 19.55% over that period.

Skor Sentimen Dana
Skor Sentimen Dana (sebelumnya dikenal sebagai Skor Akumulasi Kepemilikan) menemukan saham-saham yang paling banyak dibeli oleh dana. Ini adalah hasil dari model kuantitatif multi-faktor yang canggih yang mengidentifikasi perusahaan dengan tingkat akumulasi institusional tertinggi. Model penilaian menggunakan kombinasi dari total peningkatan pemilik yang diungkapkan, perubahan dalam alokasi portofolio pada pemilik tersebut, dan metrik lainnya. Angka berkisar dari 0 hingga 100, dengan angka yang lebih tinggi menunjukkan tingkat akumulasi yang lebih tinggi dibandingkan dengan perusahaan sejenisnya, dan 50 adalah rata-ratanya.
Frekuensi Pembaruan: Setiap Hari
Lihat Ownership Explorer, yang menyediakan daftar perusahaan dengan peringkat tertinggi.
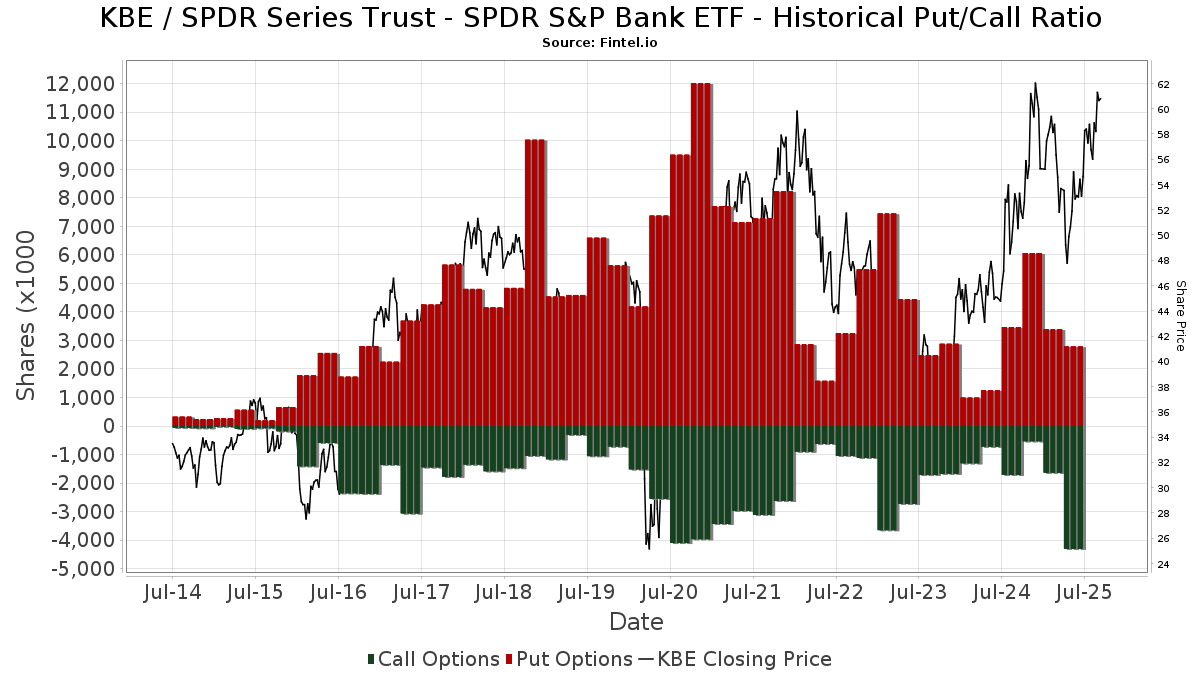
Rasio Put/Call Institusional
Selain melaporkan isu ekuitas dan utang standar, institusi dengan aset di bawah manajemen lebih dari 100 juta dolar AS juga harus mengungkapkan kepemilikan opsi put dan call mereka. Karena opsi put umumnya menunjukkan sentimen negatif, dan opsi call menunjukkan sentimen positif, kita dapat mengetahui sentimen institusional secara keseluruhan dengan memplot rasio put terhadap call. Grafik di sebelah kanan memplot rasio put/call historis untuk instrumen ini.
Menggunakan Rasio Put/Call sebagai indikator sentimen investor mengatasi salah satu kekurangan utama dari penggunaan total kepemilikan institusional, yaitu sejumlah besar aset yang dikelola diinvestasikan secara pasif untuk melacak indeks. Dana yang dikelola secara pasif biasanya tidak membeli opsi, sehingga indikator rasio put/call lebih akurat dalam melacak sentimen dana yang dikelola secara aktif.
Pengajuan 13F dan NPORT
Detail pada pengajuan 13F tersedia gratis. Detail pada pengajuan NP memerlukan keanggotaan premium. Baris berwarna hijau menunjukkan posisi baru. Baris berwarna merah menunjukkan posisi yang sudah ditutup. Klik tautan ini ikon untuk melihat riwayat transaksi selengkapnya.
Tingkatkan
untuk membuka data premium dan mengekspor ke Excel ![]() .
.
| Tanggal File | Sumber | Investor | Ketik | Presyo ng Avg (Silangan) |
Saham | Δ Saham (%) |
Dilaporkan Nilai ($1000) |
Nilai Δ (%) |
Alokasi Port (%) |
|
|---|---|---|---|---|---|---|---|---|---|---|
| 2025-08-18 | 13F | Wolverine Trading, Llc | Put | 0 | -100.00 | 0 | ||||
| 2025-07-28 | 13F | Td Asset Management Inc | 143,300 | 0.00 | 7,990 | 5.28 | ||||
| 2025-07-23 | 13F | Viewpoint Capital Management LLC | 275 | 0.00 | 15 | 7.14 | ||||
| 2025-07-25 | 13F | Johnson Investment Counsel Inc | 5,825 | -4.12 | 325 | 0.93 | ||||
| 2025-05-15 | 13F | Quantessence Capital LLC | 0 | -100.00 | 0 | |||||
| 2025-08-14 | 13F | Hrt Financial Lp | 14,666 | 1 | ||||||
| 2025-08-18 | 13F/A | National Bank Of Canada /fi/ | 8,557 | -4.38 | 477 | 0.63 | ||||
| 2025-08-11 | 13F | Madison Asset Management, LLC | 361,338 | -9.17 | 20,148 | -4.36 | ||||
| 2025-08-12 | 13F | Steward Partners Investment Advisory, Llc | 8,848 | 0.07 | 493 | 5.34 | ||||
| 2025-07-17 | 13F | Janney Capital Management LLC | 338,079 | -3.80 | 19 | 0.00 | ||||
| 2025-08-01 | 13F | Bessemer Group Inc | 422 | -10.59 | 0 | |||||
| 2025-08-08 | 13F | Creative Planning | 5,617 | 1.15 | 313 | 6.46 | ||||
| 2025-04-23 | 13F | Aspetuck Financial Management LLC | 0 | -100.00 | 0 | |||||
| 2025-08-14 | 13F | Qube Research & Technologies Ltd | 2,663 | 0.00 | 148 | 4.96 | ||||
| 2025-07-28 | 13F | BRYN MAWR TRUST Co | 1,170 | -28.96 | 65 | -25.29 | ||||
| 2025-08-04 | 13F | Spire Wealth Management | 5,089 | -1.15 | 284 | 4.04 | ||||
| 2025-08-14 | 13F | RMB Capital Management, LLC | 15,536 | 6.51 | 866 | 12.18 | ||||
| 2025-08-14 | 13F | DRW Securities, LLC | 84,879 | -19.17 | 4,652 | -16.35 | ||||
| 2025-08-12 | 13F | North Star Asset Management Inc | 9,762 | 0.00 | 544 | 5.43 | ||||
| 2025-08-13 | 13F | Crescent Grove Advisors, LLC | 4,463 | 0.00 | 249 | 5.08 | ||||
| 2025-08-12 | 13F | Global Retirement Partners, LLC | 233 | -99.03 | 13 | -99.03 | ||||
| 2025-07-22 | 13F | Mascoma Wealth Management LLC | 200 | 0.00 | 11 | 10.00 | ||||
| 2025-07-21 | 13F | Segment Wealth Management, LLC | 32,690 | 0.00 | 1,823 | 5.26 | ||||
| 2025-08-14 | 13F | Jane Street Group, Llc | 175,201 | -19.49 | 9,769 | -15.24 | ||||
| 2025-08-12 | 13F | Cowa, Llc | 0 | -100.00 | 0 | |||||
| 2025-07-14 | 13F | Kapitalo Investimentos Ltda | 0 | -100.00 | 0 | |||||
| 2025-06-17 | 13F | Howe & Rusling Inc | 0 | -100.00 | 0 | |||||
| 2025-07-18 | 13F | Institute for Wealth Management, LLC. | 4,380 | -6.53 | 244 | -1.61 | ||||
| 2025-08-01 | 13F | Cobblestone Capital Advisors Llc /ny/ | 10,750 | 0.00 | 599 | 5.27 | ||||
| 2025-05-14 | 13F | OMERS ADMINISTRATION Corp | 0 | -100.00 | 0 | |||||
| 2025-07-21 | 13F | Ameritas Advisory Services, LLC | 634 | 35 | ||||||
| 2025-07-29 | 13F | Stratos Wealth Partners, LTD. | 3,972 | 221 | ||||||
| 2025-08-08 | 13F | Capital Investment Counsel, Inc | 1,425 | 0.00 | 79 | 5.33 | ||||
| 2025-08-14 | 13F | FIL Ltd | 0 | -100.00 | 0 | |||||
| 2025-05-15 | 13F | Macquarie Group Ltd | 0 | -100.00 | 0 | |||||
| 2025-07-25 | 13F | Cwm, Llc | 948 | 7.24 | 0 | |||||
| 2025-07-25 | 13F | Envestnet Portfolio Solutions, Inc. | 13,194 | 736 | ||||||
| 2025-08-12 | 13F | Edmond De Rothschild Holding S.a. | 575,420 | 2.44 | 32,085 | 7.86 | ||||
| 2025-07-17 | 13F | HB Wealth Management, LLC | 3,642 | 203 | ||||||
| 2025-05-14 | 13F | Sig Brokerage, Lp | 0 | -100.00 | 0 | -100.00 | ||||
| 2025-08-14 | 13F | Wharton Business Group, LLC | 435,481 | 7.25 | 24 | 14.29 | ||||
| 2025-07-24 | 13F | Jfs Wealth Advisors, Llc | 0 | -100.00 | 0 | |||||
| 2025-08-15 | 13F | WFA of San Diego, LLC | 215 | 0.00 | 12 | 0.00 | ||||
| 2025-05-14 | 13F | Sig Brokerage, Lp | Put | 0 | -100.00 | 0 | -100.00 | |||
| 2025-05-15 | 13F | Angeles Investment Advisors, LLC | 0 | -100.00 | 0 | |||||
| 2025-05-08 | 13F | Waldron Private Wealth LLC | 0 | -100.00 | 0 | |||||
| 2025-08-14 | 13F | Millennium Management Llc | 15,847 | -96.34 | 884 | -96.15 | ||||
| 2025-07-18 | 13F | Truist Financial Corp | 14,648 | 41.94 | 817 | 49.45 | ||||
| 2025-08-13 | 13F | Cerity Partners LLC | 4,812 | -4.75 | 268 | 0.37 | ||||
| 2025-07-30 | 13F | Cullen/frost Bankers, Inc. | 1,100 | 0.00 | 61 | 5.17 | ||||
| 2025-07-29 | 13F | Stephens Inc /ar/ | 10,110 | 7.30 | 564 | 13.05 | ||||
| 2025-08-13 | 13F | First Trust Advisors Lp | 44,631 | 5.00 | 2,489 | 10.53 | ||||
| 2025-08-06 | 13F | Atlantic Union Bankshares Corp | 48,075 | 2,681 | ||||||
| 2025-08-07 | 13F | Allworth Financial LP | 14 | 0.00 | 1 | |||||
| 2025-04-22 | 13F | Synergy Financial Management, LLC | 0 | -100.00 | 0 | |||||
| 2025-08-08 | 13F | Avantax Advisory Services, Inc. | 9,601 | -0.90 | 535 | 4.29 | ||||
| 2025-07-21 | 13F | Exchange Capital Management, Inc. | 5,495 | -18.28 | 306 | -14.04 | ||||
| 2025-08-14 | 13F | Snowden Capital Advisors LLC | 6,353 | 0.00 | 354 | 5.36 | ||||
| 2025-08-14 | 13F | Logan Stone Capital, LLC | 9,983 | 557 | ||||||
| 2025-07-24 | 13F | IFP Advisors, Inc | 451 | -90.40 | 25 | -89.92 | ||||
| 2025-08-04 | 13F | Balentine LLC | 2,640 | 0.00 | 147 | 5.76 | ||||
| 2025-08-14 | 13F | Bank Of America Corp /de/ | Call | 470,000 | 26,207 | |||||
| 2025-07-31 | 13F | Jackson Hole Capital Partners, LLC | 4,550 | 0.00 | 254 | 5.42 | ||||
| 2025-08-14 | 13F | Bank Of America Corp /de/ | 660,190 | -35.05 | 36,812 | -31.61 | ||||
| 2025-08-14 | 13F | Comerica Bank | 4,578 | 33.12 | 255 | 40.11 | ||||
| 2025-08-13 | 13F | Walleye Capital LLC | 64,314 | 3,586 | ||||||
| 2025-08-08 | 13F | Larson Financial Group LLC | 1,752 | 98 | ||||||
| 2025-07-28 | 13F | Deroy & Devereaux Private Investment Counsel Inc | 6,200 | 0.00 | 0 | |||||
| 2025-08-14 | 13F | Quantitative Investment Management, LLC | 14,022 | -35.92 | 1 | -100.00 | ||||
| 2025-08-14 | 13F | Transamerica Financial Advisors, Inc. | 4 | 0.00 | 0 | |||||
| 2025-05-14 | 13F | Credit Agricole S A | 9,747 | 516 | ||||||
| 2025-07-23 | 13F | Meitav Dash Investments Ltd | 6,748 | 0.00 | 376 | 5.32 | ||||
| 2025-08-15 | 13F | Kestra Advisory Services, LLC | 15,178 | 16.09 | 846 | 22.25 | ||||
| 2025-08-13 | 13F | Summit Financial, LLC | 11,046 | -10.27 | 616 | -5.53 | ||||
| 2025-07-16 | 13F | Register Financial Advisors LLC | 150 | 0.00 | 8 | 14.29 | ||||
| 2025-08-14 | 13F | Goldman Sachs Group Inc | 3,639,735 | 6.23 | 202,952 | 11.84 | ||||
| 2025-07-28 | 13F | Harbour Investments, Inc. | 3,476 | 0.67 | 194 | 6.04 | ||||
| 2025-08-07 | 13F | Evoke Wealth, Llc | 0 | -100.00 | 0 | |||||
| 2025-08-08 | 13F | WP Advisors, LLC | 4,943 | 0.67 | 276 | 5.77 | ||||
| 2025-08-13 | 13F | Jones Financial Companies Lllp | 1,127 | 47.51 | 63 | 55.00 | ||||
| 2025-07-16 | 13F | Arlington Capital Management, Inc. | 0 | -100.00 | 0 | |||||
| 2025-08-05 | 13F | Castlekeep Investment Advisors Llc | 202,108 | 11.90 | 11,270 | 17.81 | ||||
| 2025-08-11 | 13F | Y.D. More Investments Ltd | 300 | 0.00 | 17 | 6.67 | ||||
| 2025-07-25 | 13F | Sovereign Financial Group, Inc. | 3,684 | -6.38 | 205 | -1.44 | ||||
| 2025-07-30 | 13F | Bogart Wealth, LLC | 200 | 0.00 | 11 | 10.00 | ||||
| 2025-07-22 | 13F | IMC-Chicago, LLC | 0 | -100.00 | 0 | |||||
| 2025-08-11 | 13F | Rothschild Investment Llc | 1,365 | 0.00 | 76 | 5.56 | ||||
| 2025-05-14 | 13F | Congress Wealth Management LLC / DE / | 0 | -100.00 | 0 | |||||
| 2025-07-22 | 13F | SOL Capital Management CO | 4,097 | 0.00 | 0 | |||||
| 2025-07-15 | 13F | Fifth Third Bancorp | 2,847 | 0.00 | 159 | 5.33 | ||||
| 2025-07-28 | 13F | Tlwm | 0 | -100.00 | 0 | |||||
| 2025-04-29 | 13F | Hm Payson & Co | 4,000 | 0.00 | 212 | -4.52 | ||||
| 2025-07-11 | 13F | Caldwell Securities, Inc | 503 | 0.60 | 28 | 7.69 | ||||
| 2025-08-11 | 13F | Aptus Capital Advisors, LLC | 40 | 0.00 | 2 | 0.00 | ||||
| 2025-08-12 | 13F | Trexquant Investment LP | 0 | -100.00 | 0 | |||||
| 2025-08-04 | 13F | Creative Financial Designs Inc /adv | 100 | 0.00 | 6 | 0.00 | ||||
| 2025-08-12 | 13F | SRS Capital Advisors, Inc. | 1,801 | 100 | ||||||
| 2025-05-02 | 13F | Transcendent Capital Group LLC | 0 | -100.00 | 0 | |||||
| 2025-07-22 | 13F | Belpointe Asset Management LLC | 6,096 | 0.00 | 340 | 5.28 | ||||
| 2025-07-16 | 13F | Essex Financial Services, Inc. | 5,197 | 23.83 | 290 | 30.18 | ||||
| 2025-08-13 | 13F | Marshall Wace, Llp | 0 | -100.00 | 0 | |||||
| 2025-08-14 | 13F | GWM Advisors LLC | 5,720 | -12.26 | 319 | -7.83 | ||||
| 2025-04-24 | 13F | Wright Fund Managment, LLC | 0 | -100.00 | 0 | |||||
| 2025-05-15 | 13F | Ulysses Management LLC | 0 | -100.00 | 0 | -100.00 | ||||
| 2025-08-13 | 13F | Consultiva Wealth Management, Corp. | 108 | 0.00 | 6 | 20.00 | ||||
| 2025-08-12 | 13F | Jpmorgan Chase & Co | 62,547 | -68.06 | 3,488 | -66.37 | ||||
| 2025-05-13 | 13F | Cercano Management LLC | 0 | -100.00 | 0 | |||||
| 2025-07-07 | 13F | Trust Co | 356 | 0.00 | 20 | 5.56 | ||||
| 2025-08-13 | 13F | Baird Financial Group, Inc. | 17,210 | -46.09 | 960 | -43.25 | ||||
| 2025-08-14 | 13F | Ameriprise Financial Inc | 83,113 | -0.73 | 4,634 | 4.51 | ||||
| 2025-08-05 | 13F | Carolinas Wealth Consulting Llc | 0 | -100.00 | 0 | -100.00 | ||||
| 2025-08-05 | 13F | Hiddenite Capital Partners LP | Call | 0 | -100.00 | 0 | ||||
| 2025-08-27 | 13F/A | Squarepoint Ops LLC | 48,406 | -83.20 | 2,699 | -82.31 | ||||
| 2025-06-17 | NP | MCNAX - Madison Conservative Allocation Fund Conservative Allocation Fund Class A | 15,004 | 54.84 | 760 | 33.16 | ||||
| 2025-08-08 | 13F | Evolution Wealth Advisors, LLC | 53,022 | 0.00 | 2,957 | 5.27 | ||||
| 2025-08-14 | 13F | Sig Brokerage, Lp | Call | 10,000 | 558 | |||||
| 2025-08-14 | 13F | Aster Capital Management (DIFC) Ltd | 0 | -100.00 | 0 | |||||
| 2025-08-15 | 13F | Tower Research Capital LLC (TRC) | 4,586 | 256 | ||||||
| 2025-08-06 | 13F | Simmons Bank | 9,045 | -1.31 | 504 | 3.92 | ||||
| 2025-08-27 | 13F/A | Squarepoint Ops LLC | Call | 5,000 | 0.00 | 279 | 5.30 | |||
| 2025-08-27 | 13F/A | Squarepoint Ops LLC | Put | 38,300 | 0.00 | 2,136 | 5.28 | |||
| 2025-07-23 | 13F | Nbt Bank N A /ny | 2,996 | -15.51 | 167 | -10.70 | ||||
| 2025-07-11 | 13F | Pinnacle Bancorp, Inc. | 0 | -100.00 | 0 | |||||
| 2025-08-14 | 13F | Bank Of America Corp /de/ | Put | 0 | -100.00 | 0 | -100.00 | |||
| 2025-08-14 | 13F | BTG Pactual Asset Management US LLC | 128 | 0.00 | 7 | 16.67 | ||||
| 2025-08-14 | 13F | Silvercrest Asset Management Group Llc | 20,472 | 0.00 | 1,142 | 5.26 | ||||
| 2025-08-19 | 13F | Marex Group plc | 4,507 | 251 | ||||||
| 2025-07-24 | 13F | Eastern Bank | 183 | 10 | ||||||
| 2025-08-06 | 13F | Sage Advisory Services, Ltd.Co. | 79,640 | 4,441 | ||||||
| 2025-08-14 | 13F | Balyasny Asset Management Llc | Put | 60,000 | 0.00 | 3,346 | 5.29 | |||
| 2025-07-28 | 13F | Twin Tree Management, LP | Put | 114,200 | 6,368 | |||||
| 2025-07-28 | 13F | Twin Tree Management, LP | 10,066 | 561 | ||||||
| 2025-08-05 | 13F | Bank Of Montreal /can/ | 173,162 | -8.06 | 9,656 | -3.21 | ||||
| 2025-08-14 | 13F | Stifel Financial Corp | 84,074 | 3.46 | 4,688 | 8.92 | ||||
| 2025-08-14 | 13F | Two Sigma Investments, Lp | 1,783,840 | -11.26 | 99,467 | -6.57 | ||||
| 2025-08-14 | 13F | Balyasny Asset Management Llc | 7,200 | -95.78 | 401 | -95.56 | ||||
| 2025-07-16 | 13F | Highline Wealth Partners Llc | 0 | -100.00 | 0 | |||||
| 2025-08-13 | 13F | Healthcare Of Ontario Pension Plan Trust Fund | 65,900 | 3,675 | ||||||
| 2025-08-08 | 13F | Capital Investment Advisory Services, LLC | 960 | 108.70 | 54 | 120.83 | ||||
| 2025-07-28 | 13F | Pettinga Financial Advisors, LLC | 0 | -100.00 | 0 | |||||
| 2025-08-13 | 13F | Great Diamond Partners, LLC | 0 | -100.00 | 0 | |||||
| 2025-08-14 | 13F | Two Sigma Securities, Llc | 9,881 | 551 | ||||||
| 2025-07-10 | 13F | Anderson Hoagland & Co | 4,926 | 275 | ||||||
| 2025-07-11 | 13F | Farther Finance Advisors, LLC | 3,470 | -2.12 | 193 | 3.76 | ||||
| 2025-05-15 | 13F | StoneX Group Inc. | 0 | -100.00 | 0 | -100.00 | ||||
| 2025-08-11 | 13F | Private Advisor Group, LLC | 4,449 | -84.86 | 248 | -84.06 | ||||
| 2025-08-05 | 13F | C2P Capital Advisory Group, LLC d.b.a. Prosperity Capital Advisors | 50,444 | 2,813 | ||||||
| 2025-05-13 | 13F | Northern Trust Corp | 0 | -100.00 | 0 | |||||
| 2025-08-12 | 13F | Jefferies Financial Group Inc. | 18,945 | -24.22 | 1,056 | -20.24 | ||||
| 2025-08-14 | 13F | Group One Trading, L.p. | 13,278 | 121.04 | 740 | 132.70 | ||||
| 2025-08-18 | NP | ULTRA SERIES FUND - Madison Target Retirement 2030 Fund Class I | 20,423 | 11.23 | 1,139 | 17.08 | ||||
| 2025-08-11 | 13F | TD Waterhouse Canada Inc. | 3,509 | 24.92 | 201 | 35.81 | ||||
| 2025-07-21 | 13F | Cape Cod Five Cents Savings Bank | 8,622 | 0.00 | 456 | 0.00 | ||||
| 2025-07-16 | 13F/A | CX Institutional | 1,526 | -29.68 | 0 | |||||
| 2025-05-15 | 13F | Mpwm Advisory Solutions, Llc | 0 | -100.00 | 0 | |||||
| 2025-08-14 | 13F | Federation des caisses Desjardins du Quebec | 2,110 | -12.45 | 118 | -7.87 | ||||
| 2025-08-14 | 13F/A | Barclays Plc | 396,374 | -15.77 | 22 | -8.33 | ||||
| 2025-04-23 | 13F | Mascagni Wealth Management, Inc. | 0 | -100.00 | 0 | -100.00 | ||||
| 2025-06-17 | NP | MMDAX - Madison Moderate Allocation Fund Moderate Allocation Fund Class A | 57,827 | 36.77 | 2,928 | 17.60 | ||||
| 2025-08-18 | NP | ULTRA SERIES FUND - Madison Target Retirement 2050 Fund Class I | 26,654 | -6.59 | 1,486 | -1.65 | ||||
| 2025-06-17 | NP | MAGSX - Madison Aggressive Allocation Fund Aggressive Allocation Fund Class A | 47,574 | 27.67 | 2,409 | 9.80 | ||||
| 2025-08-14 | 13F | Jane Street Group, Llc | Call | 70,400 | 382.19 | 3,926 | 407.76 | |||
| 2025-08-19 | 13F | Advisory Services Network, LLC | 12,557 | 8.72 | 706 | 15.38 | ||||
| 2025-07-08 | 13F | Parallel Advisors, LLC | 0 | 0 | ||||||
| 2025-08-13 | 13F | Helix Partners Management LP | 45,000 | 2,509 | ||||||
| 2025-08-14 | 13F | Jane Street Group, Llc | Put | 184,200 | 19.46 | 10,271 | 25.77 | |||
| 2025-07-28 | 13F | Courier Capital Llc | 4,373 | 0.00 | 244 | 5.19 | ||||
| 2025-05-15 | 13F | Amundi | 0 | -100.00 | 0 | |||||
| 2025-08-07 | 13F | Samalin Investment Counsel, LLC | 7,381 | 0.56 | 412 | 5.93 | ||||
| 2025-08-12 | 13F | Coston, McIsaac & Partners | 1 | 0 | ||||||
| 2025-07-14 | 13F | Armstrong Advisory Group, Inc | 938 | 0.00 | 52 | 0.00 | ||||
| 2025-08-07 | 13F | FDx Advisors, Inc. | 40,979 | 2 | ||||||
| 2025-08-14 | 13F | UBS Group AG | Call | 625,600 | 1,151.20 | 34,883 | 1,217.33 | |||
| 2025-07-24 | 13F | Blair William & Co/il | 553 | -22.55 | 31 | -18.92 | ||||
| 2025-08-14 | 13F | UBS Group AG | Put | 150,100 | 0.07 | 8,370 | 5.35 | |||
| 2025-08-18 | NP | ULTRA SERIES FUND - Aggressive Allocation Fund Class I | 33,398 | -13.68 | 1,862 | -9.08 | ||||
| 2025-05-12 | 13F | Sandy Spring Bank | 48,631 | -0.67 | 2,575 | -5.16 | ||||
| 2025-08-14 | 13F | Toronto Dominion Bank | 4 | 0.00 | 0 | |||||
| 2025-08-13 | 13F | Fisher Asset Management, LLC | 0 | -100.00 | 0 | |||||
| 2025-08-14 | 13F | UBS Group AG | 884,395 | 39.28 | 49,314 | 46.64 | ||||
| 2025-08-14 | 13F | CoreCap Advisors, LLC | 1,145 | 0.00 | 64 | 5.00 | ||||
| 2025-08-14 | 13F | Tudor Investment Corp Et Al | 81,790 | 60.92 | 4,561 | 69.45 | ||||
| 2025-08-12 | 13F | CIBC Private Wealth Group, LLC | 757 | -96.80 | 42 | -96.12 | ||||
| 2025-08-15 | 13F | Resources Management Corp /ct/ /adv | 100 | 0.00 | 0 | |||||
| 2025-08-18 | 13F | Tyler-Stone Wealth Management | 4,358 | 243 | ||||||
| 2025-08-14 | 13F | Tudor Investment Corp Et Al | Call | 425,000 | 23,698 | |||||
| 2025-04-29 | 13F | Lee Danner & Bass Inc | 0 | -100.00 | 0 | |||||
| 2025-08-08 | 13F | Banco Bilbao Vizcaya Argentaria, S.a. | 7,514 | -5.05 | 420 | 0.72 | ||||
| 2025-08-14 | 13F | Tudor Investment Corp Et Al | Put | 105,100 | 0.00 | 5,860 | 5.28 | |||
| 2025-08-14 | 13F | Wiley Bros.-aintree Capital, Llc | 6,235 | 348 | ||||||
| 2025-08-13 | 13F | Hsbc Holdings Plc | 15,030 | -24.96 | 838 | -20.94 | ||||
| 2025-07-28 | 13F | Mutual Advisors, LLC | 10,837 | -1.95 | 626 | 12.61 | ||||
| 2025-08-14 | 13F | Lighthouse Investment Partners, LLC | 9,827 | 548 | ||||||
| 2025-08-06 | 13F | Golden State Wealth Management, LLC | 0 | -100.00 | 0 | |||||
| 2025-08-05 | 13F | Simplex Trading, Llc | 84,604 | -19.78 | 5 | -20.00 | ||||
| 2025-08-14 | 13F | Wells Fargo & Company/mn | 573,573 | 36.15 | 31,982 | 43.35 | ||||
| 2025-07-25 | 13F | NorthRock Partners, LLC | 0 | -100.00 | 0 | |||||
| 2025-07-29 | 13F | Koshinski Asset Management, Inc. | 4,565 | 0.07 | 255 | 5.39 | ||||
| 2025-08-06 | 13F | Commonwealth Equity Services, Llc | 31,228 | -3.43 | 2 | 0.00 | ||||
| 2025-07-18 | 13F | Founders Capital Management | 300 | 0.00 | 17 | 6.67 | ||||
| 2025-08-08 | 13F | Compass Financial Services Inc | 143 | 0.70 | 8 | 0.00 | ||||
| 2025-08-11 | 13F | One Capital Management, LLC | 0 | -100.00 | 0 | |||||
| 2025-05-12 | 13F | Citigroup Inc | Put | 0 | -100.00 | 0 | -100.00 | |||
| 2025-07-10 | 13F | Global Financial Private Client, LLC | 0 | -100.00 | 0 | |||||
| 2025-05-13 | 13F | Eldridge Investment Advisors, Inc. | 0 | -100.00 | 0 | |||||
| 2025-08-14 | 13F | Parallax Volatility Advisers, L.P. | 1 | 0.00 | 0 | |||||
| 2025-08-13 | 13F | Capital Fund Management S.a. | Call | 344,300 | 21.32 | 19,198 | 27.73 | |||
| 2025-08-01 | 13F | Envestnet Asset Management Inc | 61,412 | 161.52 | 3,424 | 175.46 | ||||
| 2025-08-13 | 13F | Capital Fund Management S.a. | Put | 127,700 | 2.98 | 7,121 | 8.42 | |||
| 2025-08-08 | 13F | SG Americas Securities, LLC | 6,041 | -26.52 | 0 | |||||
| 2025-08-12 | 13F | Boreal Capital Management LLC | 1,000 | 56 | ||||||
| 2025-05-12 | 13F | Pinnbrook Capital Management Lp | 0 | -100.00 | 0 | |||||
| 2025-08-14 | 13F | Parallax Volatility Advisers, L.P. | Call | 35,400 | 0.00 | 1,974 | 5.28 | |||
| 2025-08-14 | 13F | Susquehanna International Group, Llp | 27,849 | -43.53 | 1,553 | -40.56 | ||||
| 2025-05-15 | 13F | Mariner, LLC | 0 | -100.00 | 0 | |||||
| 2025-08-14 | 13F | Susquehanna International Group, Llp | Call | 389,400 | 36.30 | 21,713 | 43.50 | |||
| 2025-07-22 | 13F | Diligent Investors, LLC | 0 | -100.00 | 0 | |||||
| 2025-08-14 | 13F | Susquehanna International Group, Llp | Put | 1,149,000 | -25.52 | 64,068 | -21.58 | |||
| 2025-08-18 | NP | ULTRA SERIES FUND - Madison Target Retirement 2040 Fund Class I | 28,329 | 2.53 | 1,580 | 7.93 | ||||
| 2025-08-13 | 13F | Lido Advisors, LLC | 5,241 | 11.13 | 292 | 17.27 | ||||
| 2025-07-24 | 13F | Us Bancorp \de\ | 1,729 | 62.35 | 96 | 71.43 | ||||
| 2025-08-18 | 13F | Wolverine Trading, Llc | Call | 0 | -100.00 | 0 | ||||
| 2025-08-14 | 13F | Integrated Wealth Concepts LLC | 11,078 | -71.08 | 618 | -69.58 | ||||
| 2025-08-13 | 13F | Schroder Investment Management Group | 673,025 | 37,514 | ||||||
| 2025-05-13 | 13F | Prime Capital Investment Advisors, LLC | 0 | -100.00 | 0 | |||||
| 2025-08-14 | 13F | Parallax Volatility Advisers, L.P. | Put | 61,000 | 0.00 | 3,401 | 5.29 | |||
| 2025-08-18 | NP | ULTRA SERIES FUND - Conservative Allocation Fund Class I | 12,842 | -26.83 | 716 | -22.93 | ||||
| 2025-08-05 | 13F | Huntington National Bank | 467 | 5.42 | ||||||
| 2025-08-12 | 13F | Proequities, Inc. | 0 | 0 | ||||||
| 2025-08-12 | 13F | XTX Topco Ltd | 9,111 | 136.22 | 508 | 149.02 | ||||
| 2025-08-14 | 13F | BlueCrest Capital Management Ltd | Call | 40,500 | 2,258 | |||||
| 2025-08-07 | 13F/A | Credit Industriel Et Commercial | 3,852 | -81.89 | 215 | -80.99 | ||||
| 2025-08-13 | 13F | Renaissance Technologies Llc | 27,600 | 1,539 | ||||||
| 2025-07-15 | 13F | BigSur Wealth Management LLC | 12,325 | 0.00 | 687 | 5.37 | ||||
| 2025-08-11 | 13F | Principal Securities, Inc. | 300 | 0.00 | 17 | 0.00 | ||||
| 2025-08-11 | 13F | HighTower Advisors, LLC | 10,619 | 3.82 | 592 | 9.43 | ||||
| 2025-08-14 | 13F | Great Valley Advisor Group, Inc. | 10,984 | 7.94 | 612 | 13.75 | ||||
| 2025-08-13 | 13F | Continuum Advisory, LLC | 0 | -100.00 | 0 | |||||
| 2025-08-15 | 13F | Equitable Holdings, Inc. | 12,824 | -7.57 | 715 | -2.59 | ||||
| 2025-07-18 | 13F | Vicus Capital | 0 | -100.00 | 0 | |||||
| 2025-04-25 | 13F | New Wave Wealth Advisors Llc | 0 | -100.00 | 0 | |||||
| 2025-08-14 | 13F | Atom Investors LP | 34,298 | 1,912 | ||||||
| 2025-08-14 | 13F | Aspen Grove Capital, LLC | 29,920 | 0.00 | 1,668 | 5.30 | ||||
| 2025-04-23 | 13F | International Assets Investment Management, Llc | 0 | -100.00 | 0 | |||||
| 2025-07-17 | 13F | Janney Montgomery Scott LLC | 16,418 | -3.37 | 1 | |||||
| 2025-08-14 | 13F | Alaska Permanent Fund Corp | 0 | -100.00 | 0 | |||||
| 2025-08-07 | 13F/A | Credit Industriel Et Commercial | Put | 37,500 | -40.00 | 2,091 | -36.83 | |||
| 2025-08-13 | 13F | Cary Street Partners Financial Llc | 5,194 | 23.84 | 290 | 30.18 | ||||
| 2025-07-25 | 13F | Pandora Wealth, Inc. | 0 | -100.00 | 0 | |||||
| 2025-08-13 | 13F | Baker Avenue Asset Management, LP | 0 | -100.00 | 0 | |||||
| 2025-08-14 | 13F | Capstone Investment Advisors, Llc | 72,827 | -17.92 | 4,061 | -13.58 | ||||
| 2025-07-17 | 13F | SeaBridge Investment Advisors LLC | 5,409 | -31.64 | 302 | -28.16 | ||||
| 2025-08-12 | 13F | Trans-Canada Capital Inc. | 70,000 | 0.00 | 3,903 | 5.29 | ||||
| 2025-08-13 | 13F | Walleye Trading LLC | Call | 100,500 | 839.25 | 5,604 | 889.93 | |||
| 2025-04-25 | 13F | Mather Group, Llc. | 0 | -100.00 | 0 | |||||
| 2025-08-04 | 13F | Atria Investments Llc | 5,988 | -73.16 | 334 | 112.10 | ||||
| 2025-08-18 | NP | ULTRA SERIES FUND - Madison Target Retirement 2020 Fund Class I | 2,190 | 0.00 | 122 | 6.09 | ||||
| 2025-08-13 | 13F | Walleye Trading LLC | Put | 47,500 | 1.28 | 2,649 | 6.65 | |||
| 2025-08-08 | 13F | NAN FUNG TRINITY (HK) Ltd | 388,500 | 0.00 | 21,663 | 5.29 | ||||
| 2025-08-06 | 13F | Rialto Wealth Management, LLC | 0 | -100.00 | 0 | |||||
| 2025-08-12 | 13F | Nemes Rush Group LLC | 2,150 | 0.00 | 120 | 5.31 | ||||
| 2025-08-14 | 13F | Brevan Howard Capital Management LP | Call | 400,000 | -20.00 | 22,304 | -15.77 | |||
| 2025-07-09 | 13F | Massmutual Trust Co Fsb/adv | 333 | -66.70 | 19 | -65.38 | ||||
| 2025-08-18 | NP | ULTRA SERIES FUND - Moderate Allocation Fund Class I | 55,758 | -16.97 | 3,109 | -12.57 | ||||
| 2025-08-15 | 13F | Morgan Stanley | 1,680,152 | 30.96 | 93,685 | 37.88 | ||||
| 2025-04-29 | 13F | Harel Insurance Investments & Financial Services Ltd. | 0 | -100.00 | 0 | |||||
| 2025-05-15 | 13F | Wolverine Trading, Llc | 0 | -100.00 | 0 | -100.00 | ||||
| 2025-08-08 | 13F | WASHINGTON TRUST Co | 0 | -100.00 | 0 | |||||
| 2025-08-12 | 13F | BlackRock, Inc. | 674 | -34.50 | 38 | -31.48 | ||||
| 2025-08-11 | 13F | HHM Wealth Advisors, LLC | 22 | 0.00 | 1 | 0.00 | ||||
| 2025-07-24 | 13F | Stonebridge Financial Group, LLC | 0 | -100.00 | 0 | |||||
| 2025-07-08 | 13F | Nbc Securities, Inc. | 1,617 | 28.95 | 0 | |||||
| 2025-09-04 | 13F/A | Advisor Group Holdings, Inc. | 25,763 | 51.65 | 1,435 | 59.44 | ||||
| 2025-08-05 | 13F | Sage Capital Management, LLC | 6,217 | 0.65 | 347 | 5.81 | ||||
| 2025-08-14 | 13F | Financial Advisory Service, Inc. | 185 | 10 | ||||||
| 2025-07-15 | 13F | Cranbrook Wealth Management, LLC | 0 | -100.00 | 0 | |||||
| 2025-08-08 | 13F | Altfest L J & Co Inc | 8,741 | -46.95 | 487 | -44.15 | ||||
| 2025-08-08 | 13F/A | Sterling Capital Management LLC | 470 | 0.00 | 26 | 8.33 | ||||
| 2025-08-12 | 13F | SPX Equities Gestao de Recursos Ltda | 322,200 | 17,966 | ||||||
| 2025-08-11 | 13F | Citigroup Inc | 490,805 | 272.31 | 27,367 | 292.02 | ||||
| 2025-07-18 | 13F | Provident Wealth Management, LLC | 1,250 | 0.00 | 70 | 4.55 | ||||
| 2025-05-09 | 13F | Pathway Financial Advisers, LLC | 0 | -100.00 | 0 | |||||
| 2025-08-05 | 13F | American Institute for Advanced Investment Management, LLP | 0 | -100.00 | 0 | |||||
| 2025-08-14 | 13F | EP Wealth Advisors, Inc. | 4,594 | 28.86 | 256 | 36.17 | ||||
| 2025-08-14 | 13F | Avanda Investment Management Pte. Ltd. | Call | 577,500 | 32,201 | |||||
| 2025-08-15 | 13F | CI Private Wealth, LLC | 13,308 | 96.98 | 742 | 107.84 | ||||
| 2025-08-11 | 13F | Hopwood Financial Services, Inc. | 4,000 | 0.00 | 223 | 5.69 | ||||
| 2025-08-14 | 13F | McIlrath & Eck, LLC | 623 | 0.00 | 35 | 6.25 | ||||
| 2025-07-22 | 13F | Valley National Advisers Inc | 528 | 0.00 | 0 | |||||
| 2025-08-19 | 13F | Newbridge Financial Services Group, Inc. | 0 | -100.00 | 0 | |||||
| 2025-08-12 | 13F | MAI Capital Management | 11,794 | -14.48 | 658 | -10.00 | ||||
| 2025-08-15 | 13F | Fairfield, Bush & Co. | 4,350 | 243 | ||||||
| 2025-07-30 | 13F | Forum Financial Management, LP | 17,009 | 0.15 | 948 | 5.45 | ||||
| 2025-08-08 | 13F | Symphony Financial Services, Inc. | 5,340 | 0.06 | 298 | 5.32 | ||||
| 2025-08-08 | 13F | Pnc Financial Services Group, Inc. | 378,941 | 2.31 | 21,130 | 7.72 | ||||
| 2025-08-14 | 13F | Fmr Llc | 7,415 | 12.69 | 413 | 18.68 | ||||
| 2025-08-14 | 13F | Royal Bank Of Canada | 402,274 | 198.54 | 22,431 | 214.34 | ||||
| 2025-08-11 | 13F | Heritage Wealth Advisors | 2,989 | 0.00 | 167 | 5.06 | ||||
| 2025-08-13 | 13F | Quadrature Capital Ltd | 0 | -100.00 | 0 | |||||
| 2025-08-04 | 13F | Assetmark, Inc | 4,262 | -42.33 | 238 | -39.39 | ||||
| 2025-08-14 | 13F | Bnp Paribas Arbitrage, Sa | 6,647 | -81.69 | 371 | -80.75 | ||||
| 2025-08-15 | 13F | Captrust Financial Advisors | 93,083 | -13.32 | 5,190 | -8.74 | ||||
| 2025-05-15 | 13F | Glenmede Trust Co Na | 1,650 | 0.00 | 87 | -4.40 | ||||
| 2025-08-12 | 13F | Calton & Associates, Inc. | 11,443 | -2.78 | 638 | 2.41 | ||||
| 2025-07-10 | 13F | Wealth Enhancement Advisory Services, Llc | 6,551 | 0.09 | 385 | 11.27 | ||||
| 2025-08-05 | 13F | Benchmark Financial Wealth Advisors, LLC | 51,472 | 2,870 | ||||||
| 2025-08-07 | 13F | LOM Asset Management Ltd | 35,751 | 2 | ||||||
| 2025-07-09 | 13F | Graves-Light Private Wealth Management, Inc. | 10,703 | -6.16 | 597 | -1.32 | ||||
| 2025-08-12 | 13F | O'shaughnessy Asset Management, Llc | 1,413 | 0.00 | 79 | 5.41 | ||||
| 2025-08-14 | 13F | Bnp Paribas Arbitrage, Sa | Put | 230 | 1,282 | |||||
| 2025-07-14 | 13F | Toth Financial Advisory Corp | 1,690 | 0.00 | 94 | 5.62 | ||||
| 2025-08-05 | 13F | Bank of New York Mellon Corp | 172,270 | 9,606 | ||||||
| 2025-07-15 | 13F | North Star Investment Management Corp. | 576 | -16.64 | 32 | -11.11 | ||||
| 2025-08-06 | 13F | AE Wealth Management LLC | 153 | -24.63 | 9 | -20.00 | ||||
| 2025-07-14 | 13F | Sowell Financial Services LLC | 60,000 | 3,346 | ||||||
| 2025-04-30 | 13F | GFG Capital, LLC | 0 | -100.00 | 0 | |||||
| 2025-08-14 | 13F | AYAL Capital Advisors Ltd | Call | 95,000 | 5,297 | |||||
| 2025-08-14 | 13F | Objective Capital Management, LLC | 7,304 | -3.31 | 407 | 1.75 | ||||
| 2025-08-14 | 13F | Riggs Asset Managment Co. Inc. | 0 | -100.00 | 0 | |||||
| 2025-08-11 | 13F | Brown Brothers Harriman & Co | 7,209 | 0.00 | 402 | 5.25 | ||||
| 2025-07-31 | 13F | Cambridge Investment Research Advisors, Inc. | 10,524 | 5.57 | 1 | |||||
| 2025-08-13 | 13F | Northwestern Mutual Wealth Management Co | 19,255 | 1.45 | 1,074 | 6.77 | ||||
| 2025-08-11 | 13F | Lowe Brockenbrough & Co Inc | 850 | 47 | ||||||
| 2025-04-17 | 13F | Montecito Bank & Trust | 8,490 | 0.00 | 450 | -4.47 | ||||
| 2025-08-07 | 13F | Garda Capital Partners Lp | 0 | -100.00 | 0 | |||||
| 2025-08-08 | 13F | Itau Unibanco Holding S.A. | 10,000 | 558 | ||||||
| 2025-07-24 | 13F | Total Wealth Planning & Management, Inc. | 8,637 | 0.00 | 482 | 5.25 | ||||
| 2025-08-08 | 13F | ProVise Management Group, LLC | 200,939 | 0.40 | 11,204 | 5.71 | ||||
| 2025-08-14 | 13F | Synovus Financial Corp | 4,083 | -6.63 | 228 | -1.73 | ||||
| 2025-07-08 | 13F | Rise Advisors, LLC | 70 | 1.45 | 4 | 0.00 | ||||
| 2025-08-13 | 13F | Capital Fund Management S.a. | 0 | -100.00 | 0 | -100.00 | ||||
| 2025-05-15 | 13F | Paloma Partners Management Co | 0 | -100.00 | 0 | |||||
| 2025-07-14 | 13F | Pacifica Partners Inc. | 170 | 0.00 | 9 | 12.50 | ||||
| 2025-08-13 | 13F | Berkshire Asset Management Llc/pa | 8,287 | 0.00 | 462 | 5.48 | ||||
| 2025-07-22 | 13F | Cedar Mountain Advisors, LLC | 346 | 0.58 | 19 | 5.56 | ||||
| 2025-08-13 | 13F | Quantbot Technologies LP | 20,093 | 1,120 | ||||||
| 2025-08-14 | 13F | Mml Investors Services, Llc | 5,359 | -2.33 | 0 | |||||
| 2025-07-29 | 13F | Private Trust Co Na | 321 | 237.89 | 18 | 240.00 | ||||
| 2025-05-15 | 13F | Crestline Management, LP | 0 | -100.00 | 0 | |||||
| 2025-08-11 | 13F | CBIZ Investment Advisory Services, LLC | 10 | 0.00 | 1 | |||||
| 2025-07-17 | 13F | XML Financial, LLC | 4,172 | -7.27 | 233 | -2.52 | ||||
| 2025-08-01 | 13F | Y-Intercept (Hong Kong) Ltd | 11,218 | 626 | ||||||
| 2025-08-08 | 13F | Hartland & Co., LLC | 40 | 0.00 | 2 | 0.00 | ||||
| 2025-08-11 | 13F | Wealthspire Advisors, LLC | 0 | -100.00 | 0 | |||||
| 2025-08-14 | 13F | Voya Financial Advisors, Inc. | 8,490 | 473 | ||||||
| 2025-08-12 | 13F | Archer Investment Corp | 93 | 1.09 | 5 | 25.00 | ||||
| 2025-08-14 | 13F | Raymond James Financial Inc | 242,125 | 4.90 | 13,501 | 10.44 | ||||
| 2025-07-16 | 13F | Magnus Financial Group LLC | 6,602 | 4.98 | 368 | 10.51 | ||||
| 2025-07-29 | 13F | Vectors Research Management, LLC | 4,289 | 1.76 | 239 | 7.17 | ||||
| 2025-08-14 | 13F | Citadel Advisors Llc | 388,219 | -17.21 | 21,647 | -12.83 | ||||
| 2025-07-31 | 13F | Wealthfront Advisers Llc | 6,608 | -6.85 | 368 | -1.87 | ||||
| 2025-08-14 | 13F | Citadel Advisors Llc | Put | 460,900 | 24.70 | 25,700 | 31.29 | |||
| 2025-08-08 | 13F | Gts Securities Llc | 27,201 | 1,517 | ||||||
| 2025-08-14 | 13F | Glenmede Investment Management, LP | 1,650 | 92 | ||||||
| 2025-05-13 | 13F | Heck Capital Advisors, LLC | 0 | -100.00 | 0 | -100.00 | ||||
| 2025-05-16 | 13F | Coppell Advisory Solutions LLC | 0 | -100.00 | 0 | |||||
| 2025-08-05 | 13F | Fourth Dimension Wealth, LLC | 726 | -57.89 | 40 | -56.04 | ||||
| 2025-08-06 | 13F | JCSD Capital, LLC | 100 | -99.83 | 6 | -99.84 | ||||
| 2025-07-07 | 13F | Thurston, Springer, Miller, Herd & Titak, Inc. | 1,150 | 0.00 | 64 | 6.67 | ||||
| 2025-08-06 | 13F | JCSD Capital, LLC | Call | 220,000 | 13,066 | |||||
| 2025-08-14 | 13F | Citadel Advisors Llc | Call | 341,100 | 296.63 | 19,020 | 317.63 | |||
| 2025-08-14 | 13F | Peak6 Llc | Put | 252,600 | -21.23 | 14,085 | -17.07 | |||
| 2025-07-16 | 13F | Formidable Asset Management, LLC | 7,000 | 0.00 | 371 | 0.00 | ||||
| 2025-08-12 | 13F | Integrated Advisors Network LLC | 8,602 | -2.37 | 480 | 2.79 | ||||
| 2025-08-12 | 13F | LPL Financial LLC | 416,949 | 0.82 | 23,249 | 6.15 | ||||
| 2025-08-12 | 13F | Pathstone Holdings, LLC | 10,321 | 0.00 | 575 | 5.31 | ||||
| 2025-08-08 | 13F | Cetera Investment Advisers | 40,972 | 32.34 | 2,285 | 39.35 | ||||
| 2025-08-14 | 13F | Headlands Technologies LLC | 397 | 22 | ||||||
| 2025-08-14 | 13F | Peak6 Llc | Call | 149,800 | -1.77 | 8,353 | 3.42 | |||
| 2025-08-07 | 13F | CENTRAL TRUST Co | 209 | 0.00 | 12 | 0.00 | ||||
| 2025-08-13 | 13F | GM Advisory Group, Inc. | 40,189 | 0.32 | 2,241 | 5.61 | ||||
| 2025-08-07 | 13F | Ibex Wealth Advisors | 0 | -100.00 | 0 | |||||
| 2025-05-15 | 13F | Prospera Financial Services Inc | 0 | -100.00 | 0 |